Manage custom charts
Quick BI AIPro lets you integrate platform-compliant custom chart components into your organization for members to use in visual reports. If built-in charts do not meet your business needs, you can create custom charts to expand the available chart types and better present your business data. On the Chart Management page, users with administrative privileges can upload custom charts, set their visibility scope, and manage their lifecycle. This topic describes the required steps.
Prerequisites
Subscription: Your organization must have a subscription to Quick BI AIPro.
Permission restrictions: You can upload and manage custom charts only if you have the AIPro centralized management permission. For instructions on how to configure permissions, see User Permissions.
Access the feature
Go to the Quick BI AIPro Management Center and click Extension Management > Chart Management in the top navigation bar.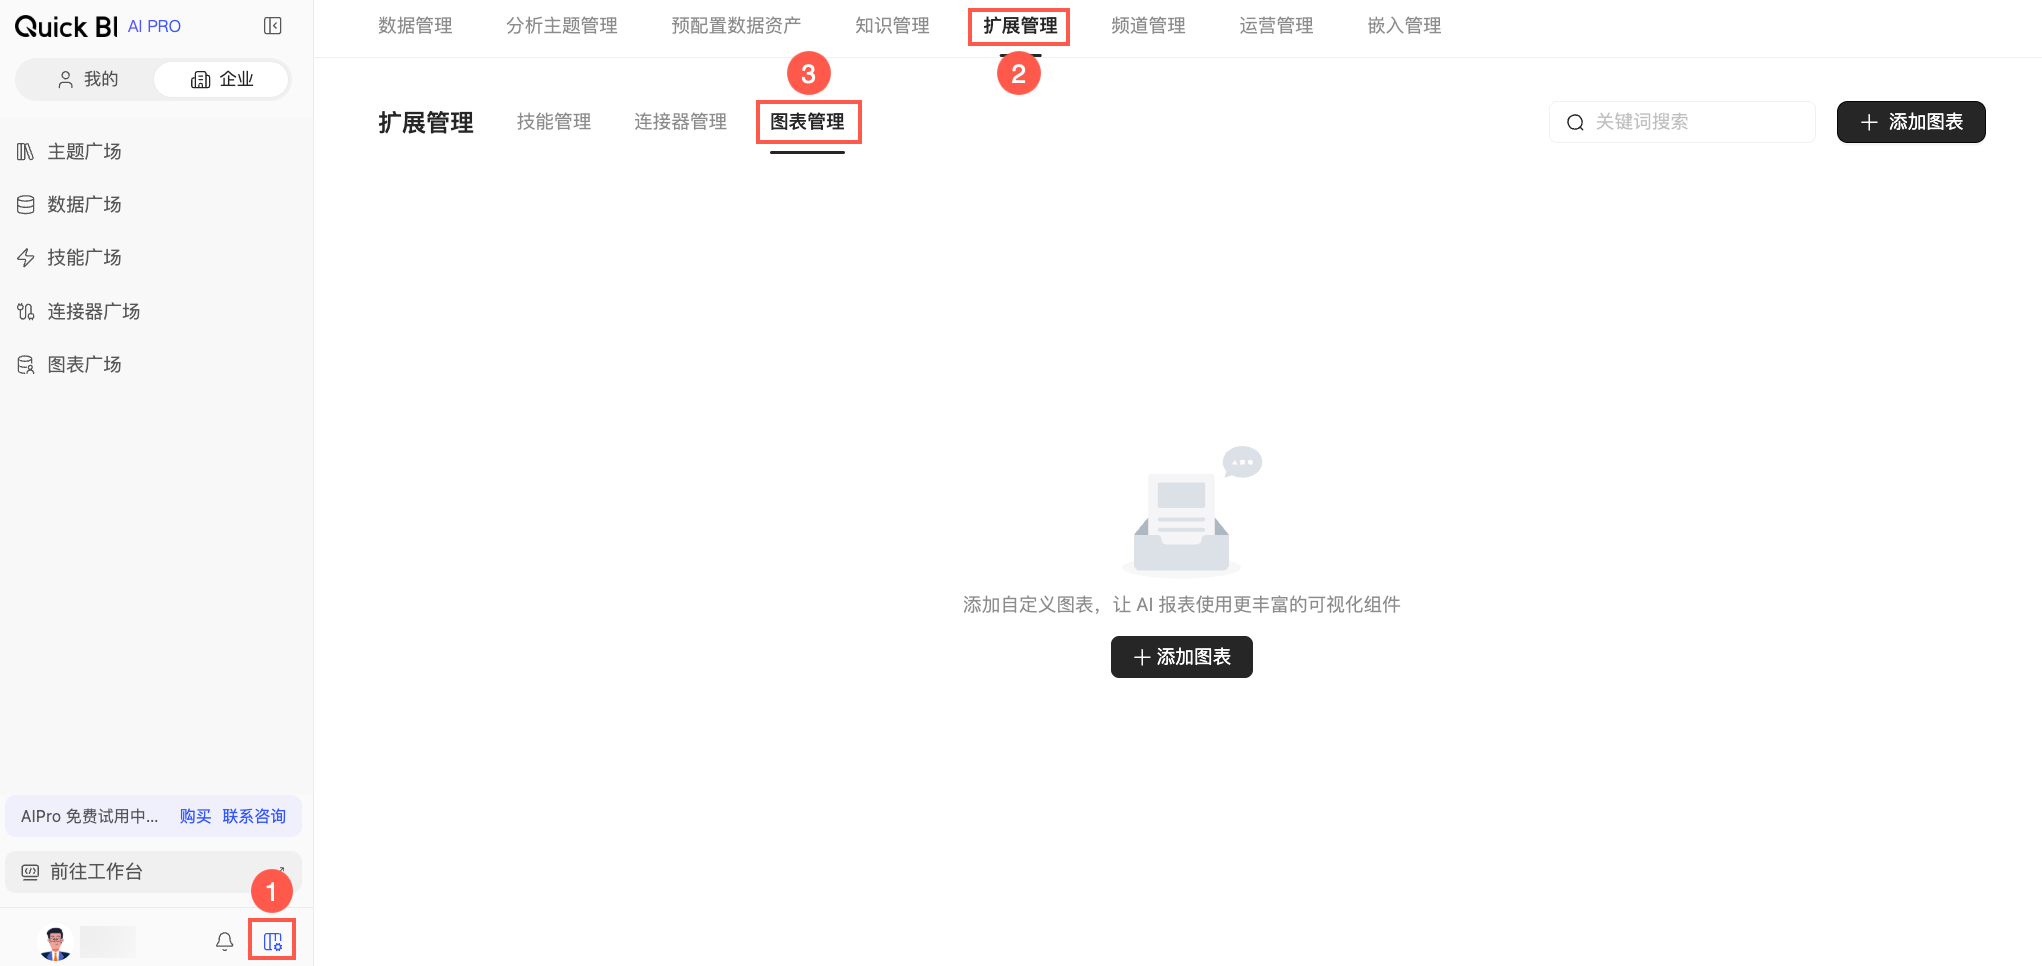
The Chart Management page lists only the custom charts uploaded to the current organization. Built-in charts are not managed on this page.
Add a chart
If you use a Skill to develop and upload a chart, you can skip the steps in this section. For more information, see Develop custom charts.
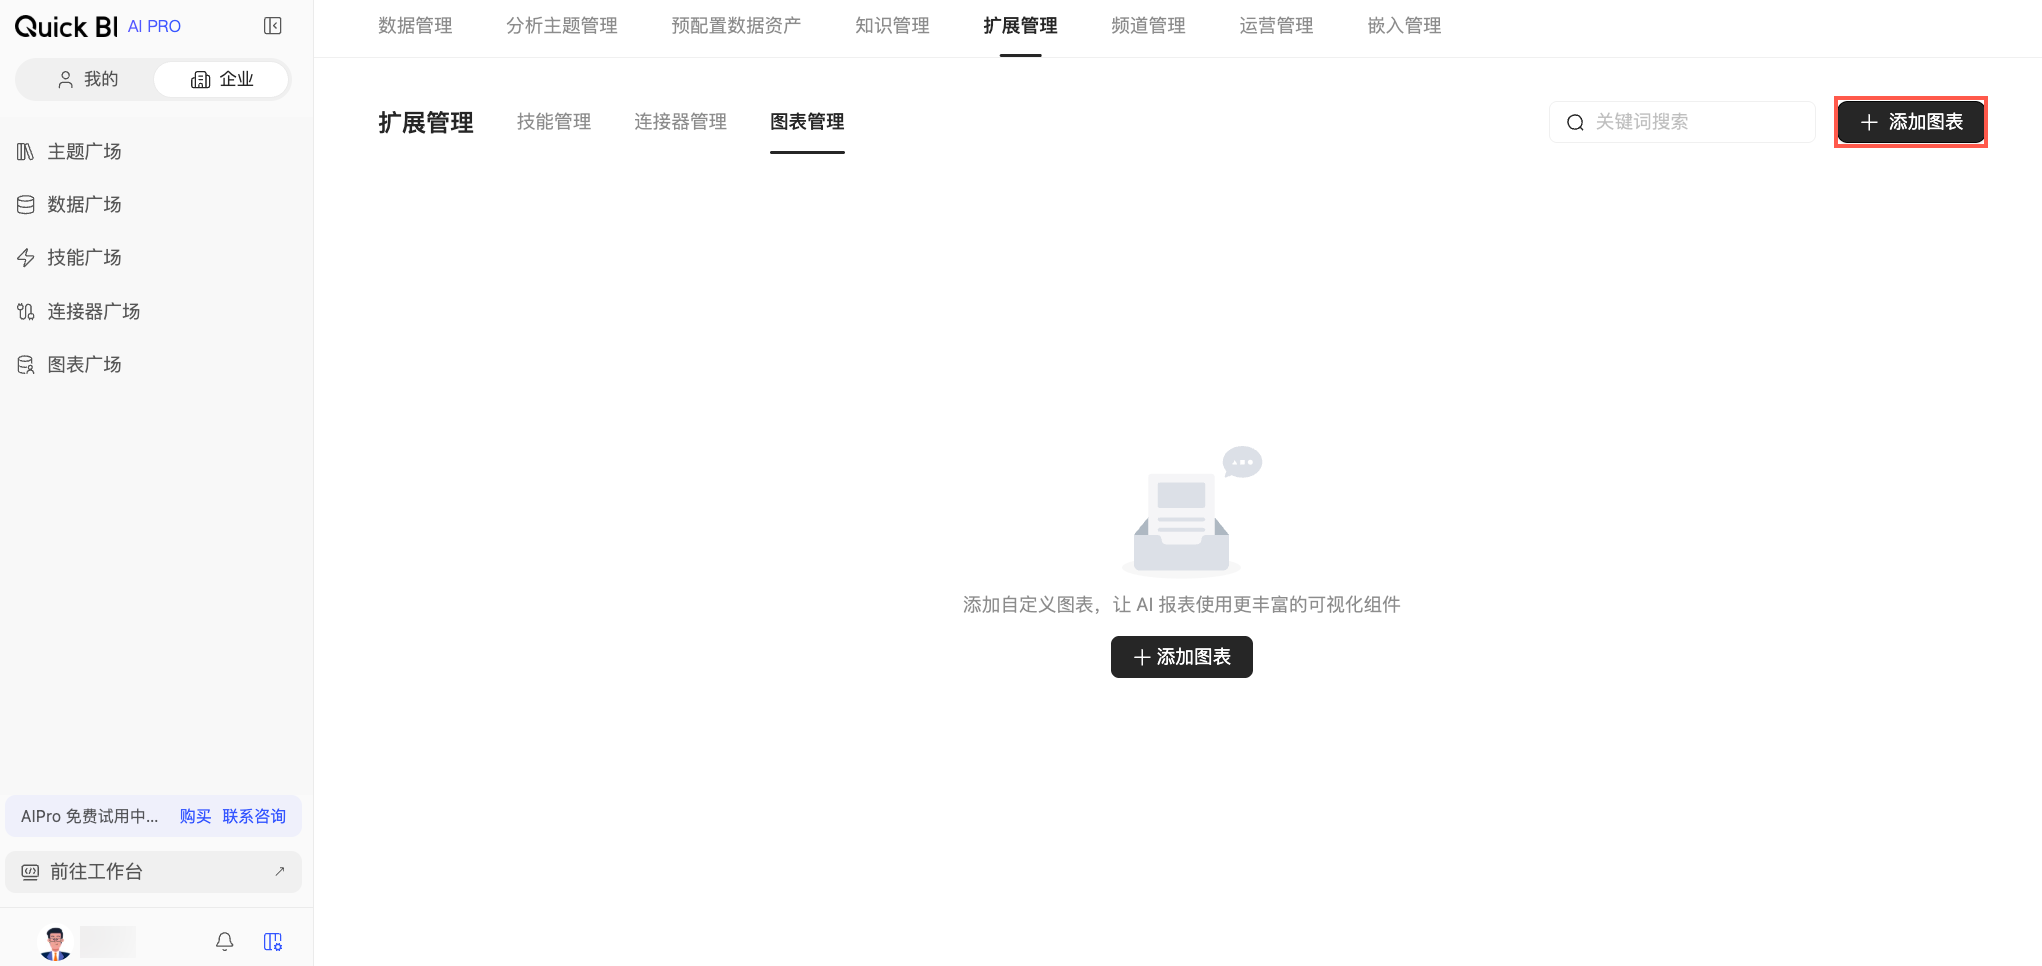
On the Chart Management page, click Add Chart in the upper-right corner.
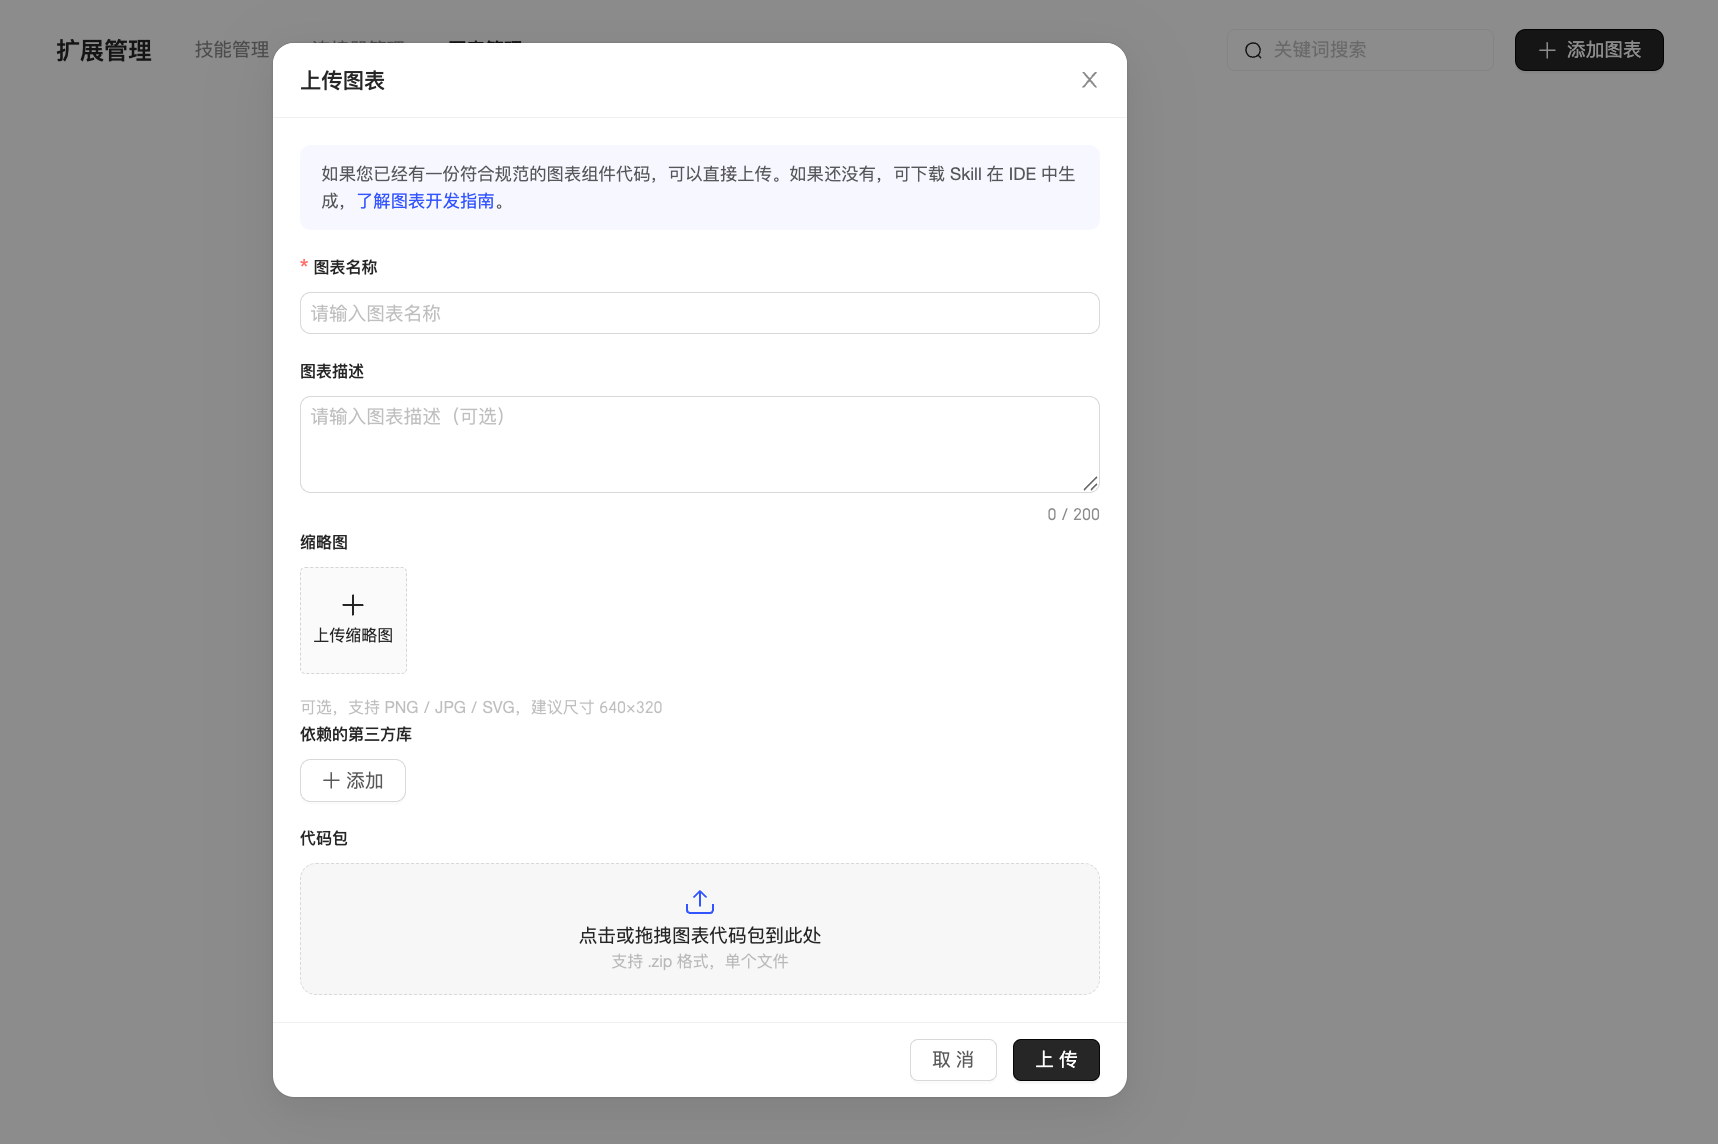
In the Upload Chart dialog box, configure the following items for your chart.
Parameter
Description
Chart Name
Required. Enter a business-friendly name that identifies the chart type, such as "Bar Comparison Chart" or "Funnel Conversion Chart". Members use this name to select the chart when creating reports.
Chart Description
Optional. The description can be up to 200 characters. Describe the chart type, its use cases, and configurable options. Clearly describe the applicable scenarios to improve semantic matching when AI generates reports.
Thumbnail
Optional. Supported formats are PNG, JPG, and SVG. The recommended dimensions are 640×320 pixels. This thumbnail is displayed in the configuration options during report editing to help users identify different custom components.
Third-party dependencies
Optional. Add any third-party dependencies used during chart development. Click Add and provide the library name from the import statement (for example, "echarts" from
import * as echarts from "echarts"), the module export name bound to the global object (for example,echartsinwindow.echarts), and the library's CDN path. The third-party library must comply with the UMD module specification.Code package
Required. Click the upload area or drag and drop the code package here. Only a single
.zipfile is supported. For more information about how to develop a code package, see Develop custom charts.Click Upload to add the chart. Once uploaded, the chart is enabled and set to visible to all by default. It is also automatically installed and enabled in your My Charts. Organization members can then install the chart from the Chart Marketplace to use in visual reports.
Manage charts
The Chart Management page lists the custom charts uploaded to your organization, including their descriptions, visibility scopes, creators, and statuses. You can perform the following actions on this page.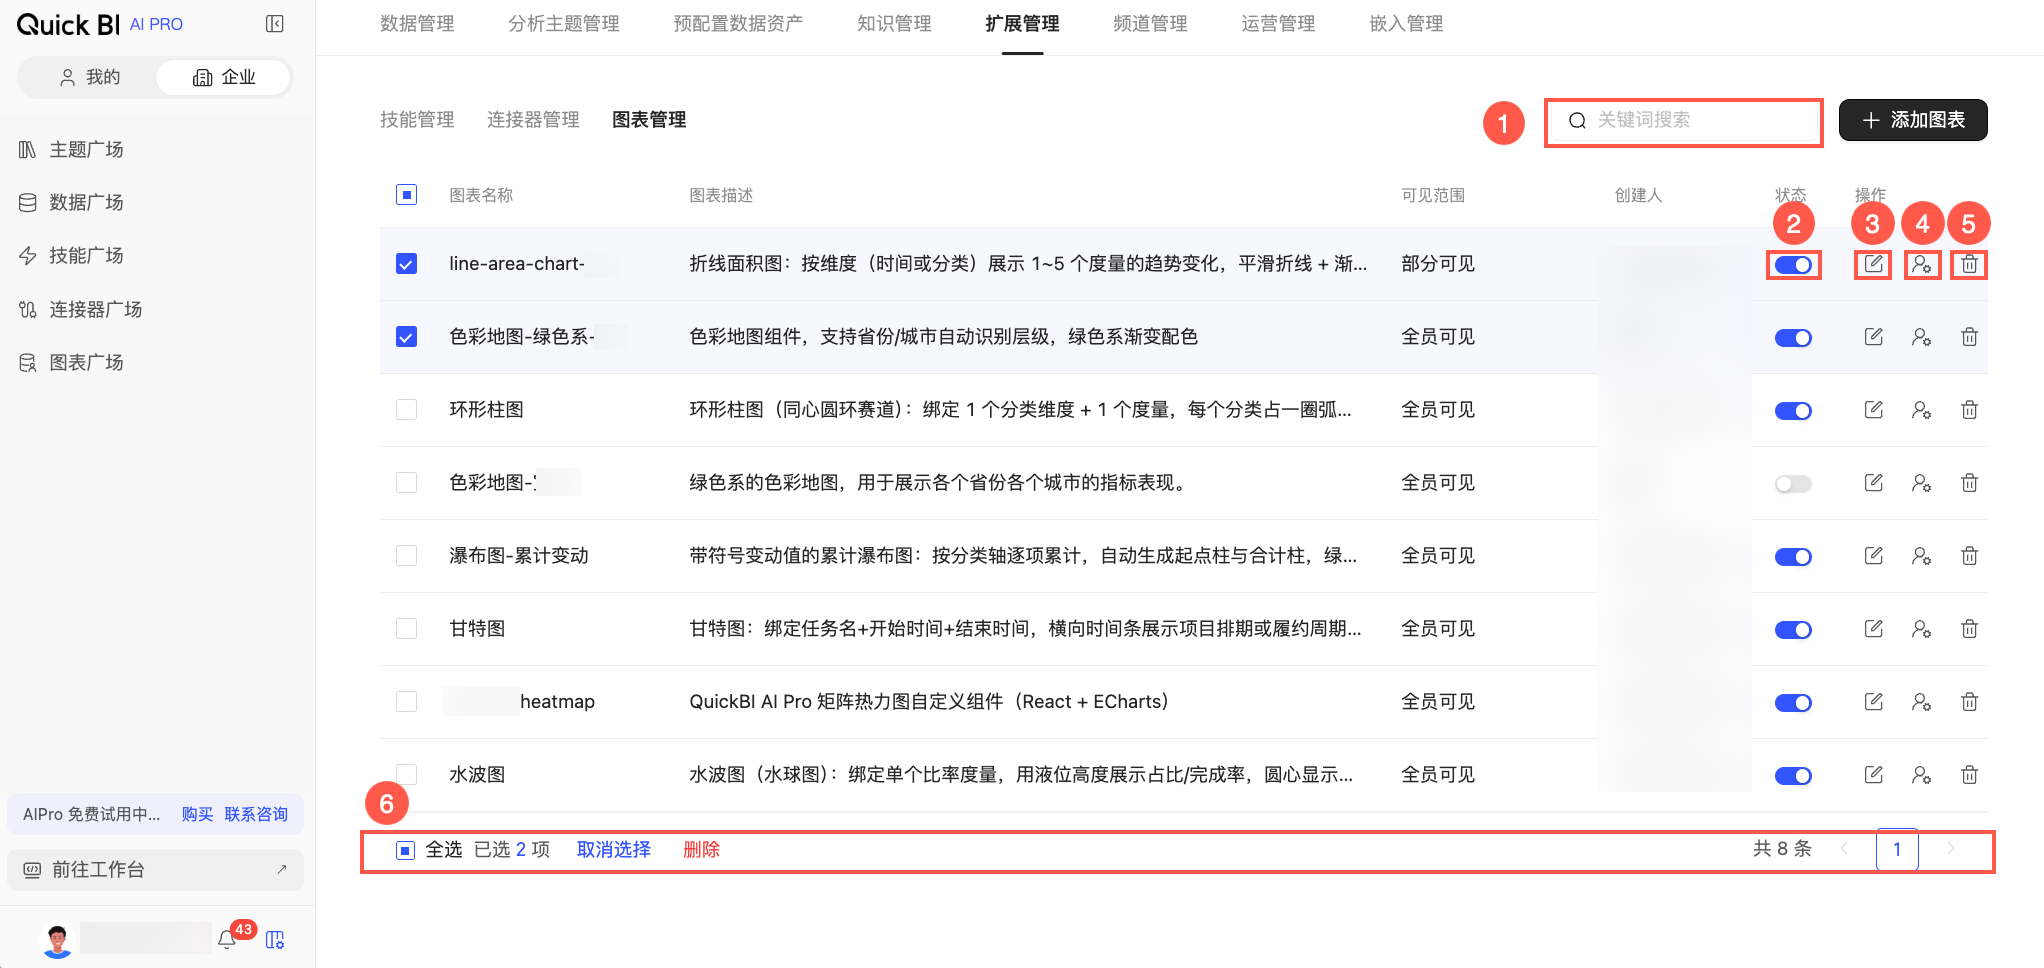
Actions | Description |
① Search for a chart | If you have many charts, enter keywords from the chart name or description in the search box to quickly find the chart. |
② Set status | Charts are enabled by default when uploaded. Use the toggle in the Status column to disable or re-enable a chart. |
③ Edit | Click the Edit icon. In the Edit Chart dialog box, you can modify the chart name, description, thumbnail, third-party dependencies, and code package. Click Save to apply your changes. Re-uploading a code package (.zip) automatically updates all reports that use the chart. |
④ Set visibility scope | Click the Visibility icon to modify the chart's visibility scope. visible to all means all members of the organization can view and install the chart from the Chart Marketplace. partially visible means only selected users can view and install the chart. |
⑤ Delete | Click the Delete icon and confirm the action to remove the chart. Deleting a chart permanently removes its code from the platform and removes the chart from all members' My Charts. Consequently, reports that use it will no longer render correctly. Before deleting a chart, ensure it is not in use. |
⑥ Perform batch operations | You can select multiple charts to delete them at once. |
Related operations
Chart Marketplace: Members can install custom charts published by their organization.
My Charts: Members can manage the enablement status of their installed charts.
Develop custom charts: You can use a Skill to generate a platform-compliant code package for a custom chart in an AI programming tool. Alternatively, developers can manually write a code package that adheres to platform specifications.