Chart Plaza
If the built-in charts do not meet your business needs, you can create custom charts to expand the available chart types and present your data more accurately. The Chart Plaza is a centralized gallery of custom charts that are published in your organization and that you have permission to use. Use it to find and install more charts. After installation, you can use these charts to create visual reports.
Prerequisites
Version: Your organization has purchased Quick BI AIPro.
Permissions: You have at least the basic features permission for Quick BI AIPro.
Chart publishing: An administrator has uploaded a custom chart in the management center and set its visibility scope to include you. For more information, see Manage custom charts.
Entry point
On the Enterprise tab of Quick BI AIPro, click Chart Plaza in the left-side navigation pane.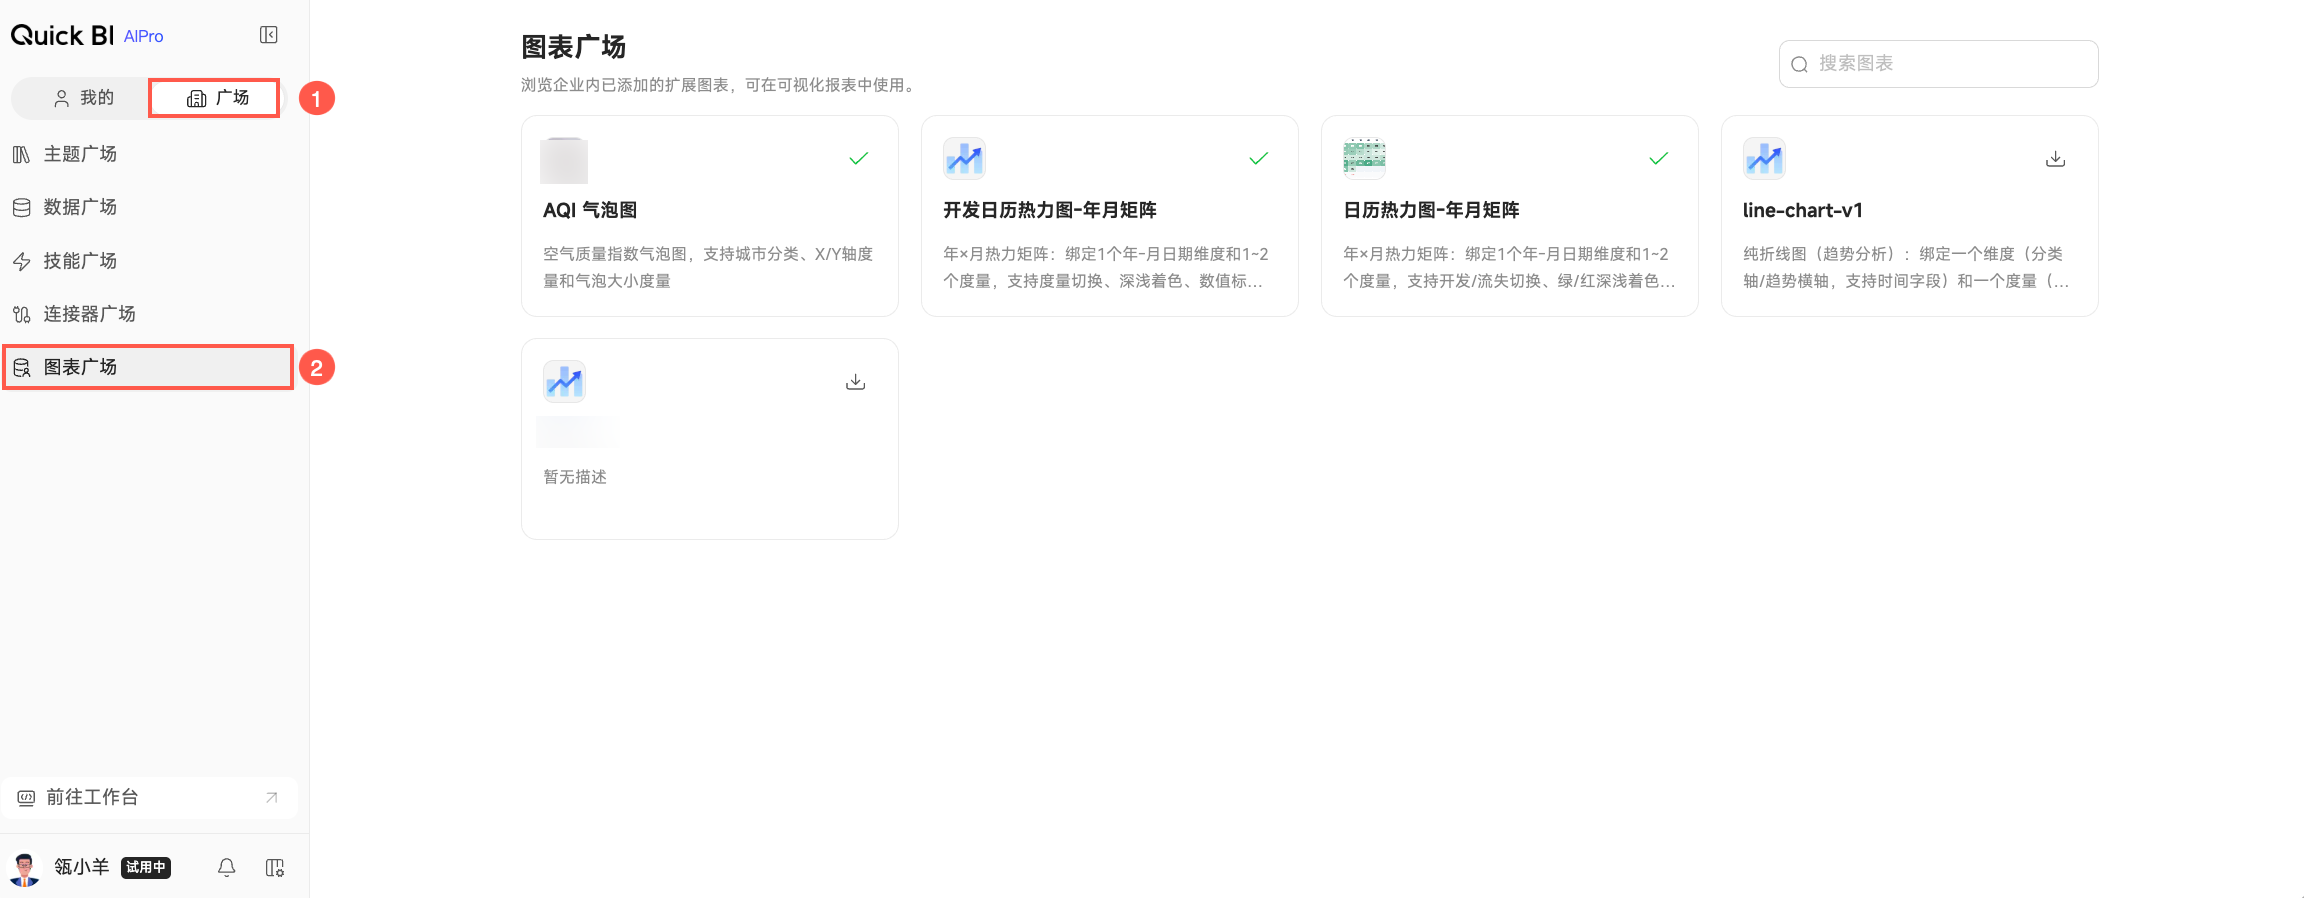
Procedure
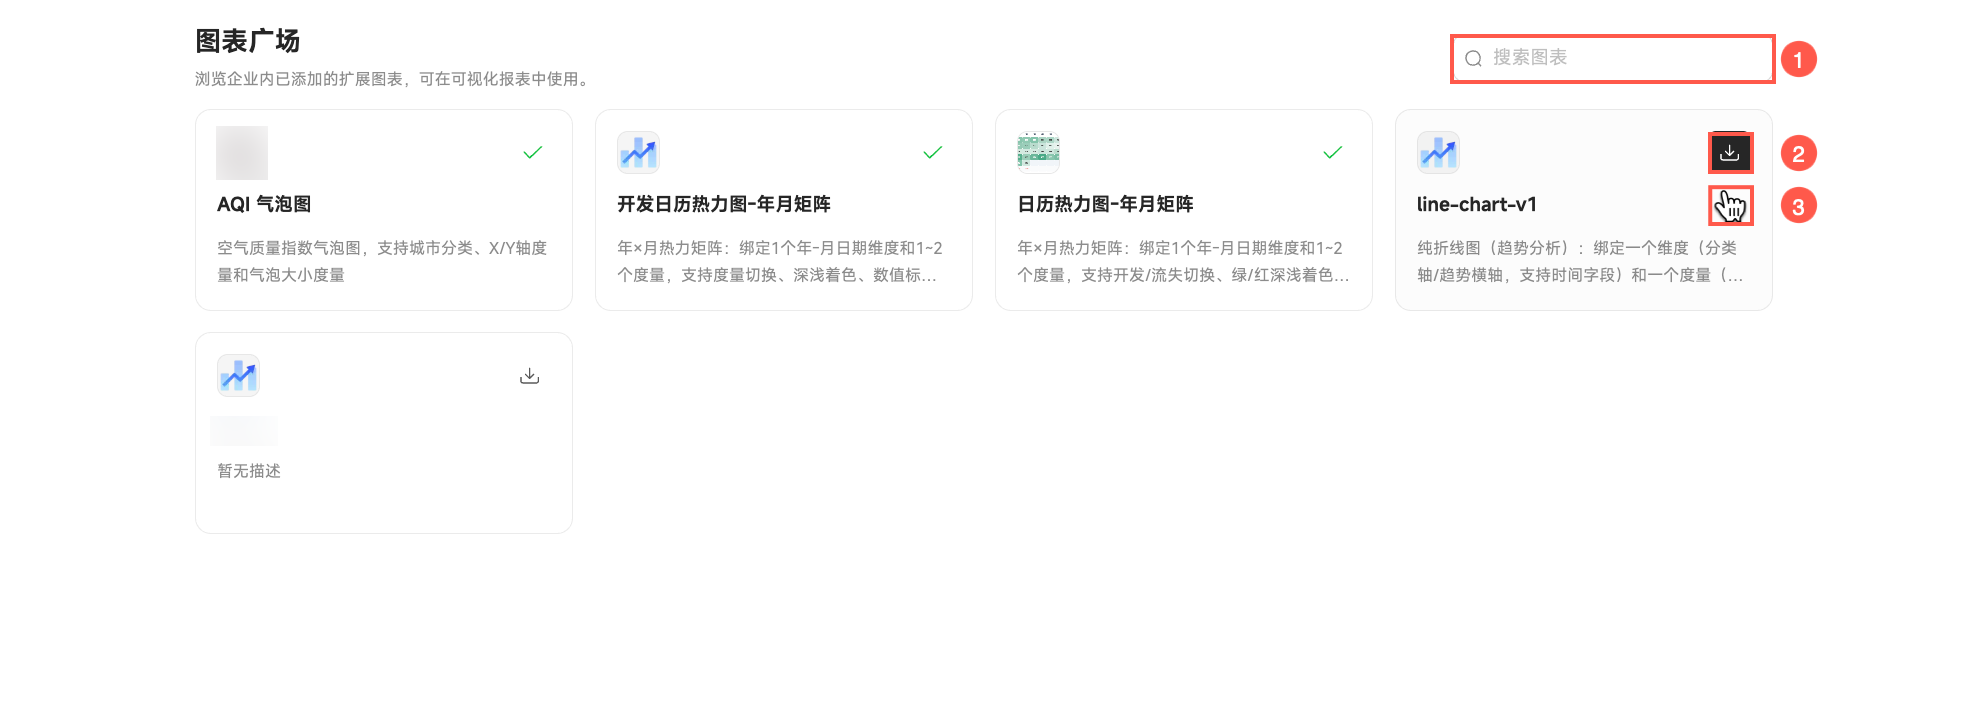
The Chart Plaza page displays the custom charts that are published within your organization and are within your visibility scope. You can view the name and description of each chart and perform the following operations.
If an administrator disables a chart or removes you from its visibility scope, the chart no longer appears in the Chart Plaza, and you cannot install it. However, existing reports that use this chart continue to display normally.
Actions | Description |
① Search for a chart | If there are many charts, enter keywords from the chart name in the search box to find it quickly. |
② Install | After you find a suitable chart, hover over the chart card and click the Install button. This adds the chart to My Charts. Installed charts are enabled by default and ready for use in visual reports. |
③ View | Click a chart card to view its details, such as its name and description, to see if it meets your analysis requirements. |
Related operations
My Charts: After you install a chart, you can manage it in My Charts. You can enable or disable the chart, or remove charts that you no longer use.
Conversation mode: Lets you use custom charts when you create visual reports.
Manage custom charts: Administrators can upload and publish custom charts for the organization.