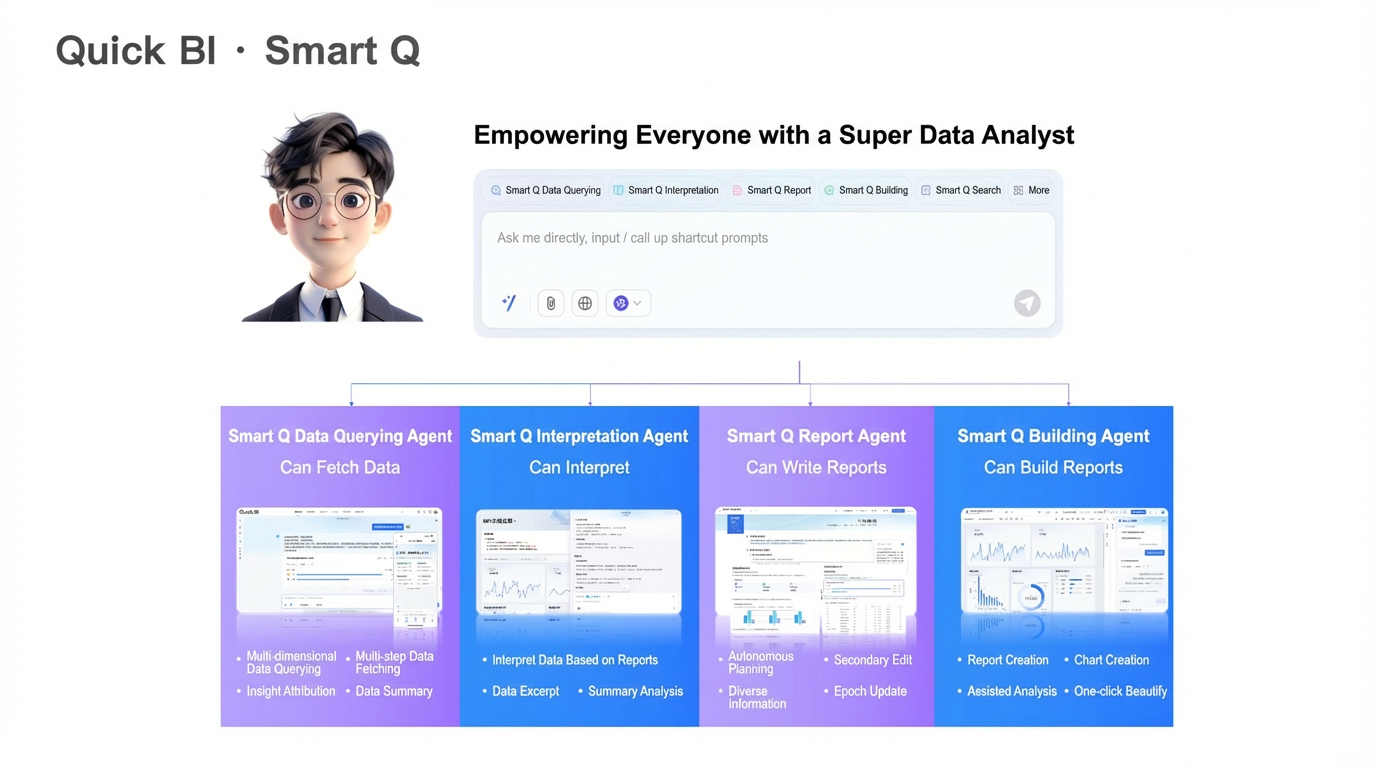
Quick BI Intelli-Q is a value-added module for Quick BI that integrates multiple large models and agent capabilities. It revolutionizes the business intelligence (BI) analytics workflow with a suite of AI agents, including the Q-Query Agent, Q-Insights Agent, Q-Report Agent, Q-Creator Agent, and Q-Analysis Agent, for intelligent and personalized data analysis. You can use natural language to ask questions about your data, interpret results, and generate dashboards and reports with a single click. Quick BI Intelli-Q also supports automated data insights, AI-assisted report editing, in-depth analysis through multi-turn conversation, advanced data interpretation, and custom AI service management.
The five agents in Quick BI Intelli-Q are part of a value-added module and require a separate purchase.
Purchase the Q-Query Agent to use the capabilities of both the Q-Query Agent and the Q-Insights Agent.
Purchase the Q-Report Agent to use Q-Report capabilities.
Purchase the Q-Creator Agent to use Q-Creator capabilities.
Purchase the Q-Analysis Agent to use Q-Analysis capabilities.
After purchasing, organization administrators can assign seats to members on the Member Management page as needed. Members without an assigned seat cannot use the agent features. For detailed instructions, see Manage Organization Users.
Only the Advanced edition and Pro edition support purchasing the five agents of Quick BI Intelli-Q. These agents are not available for the Personal edition.
Features
Q-Query Agent
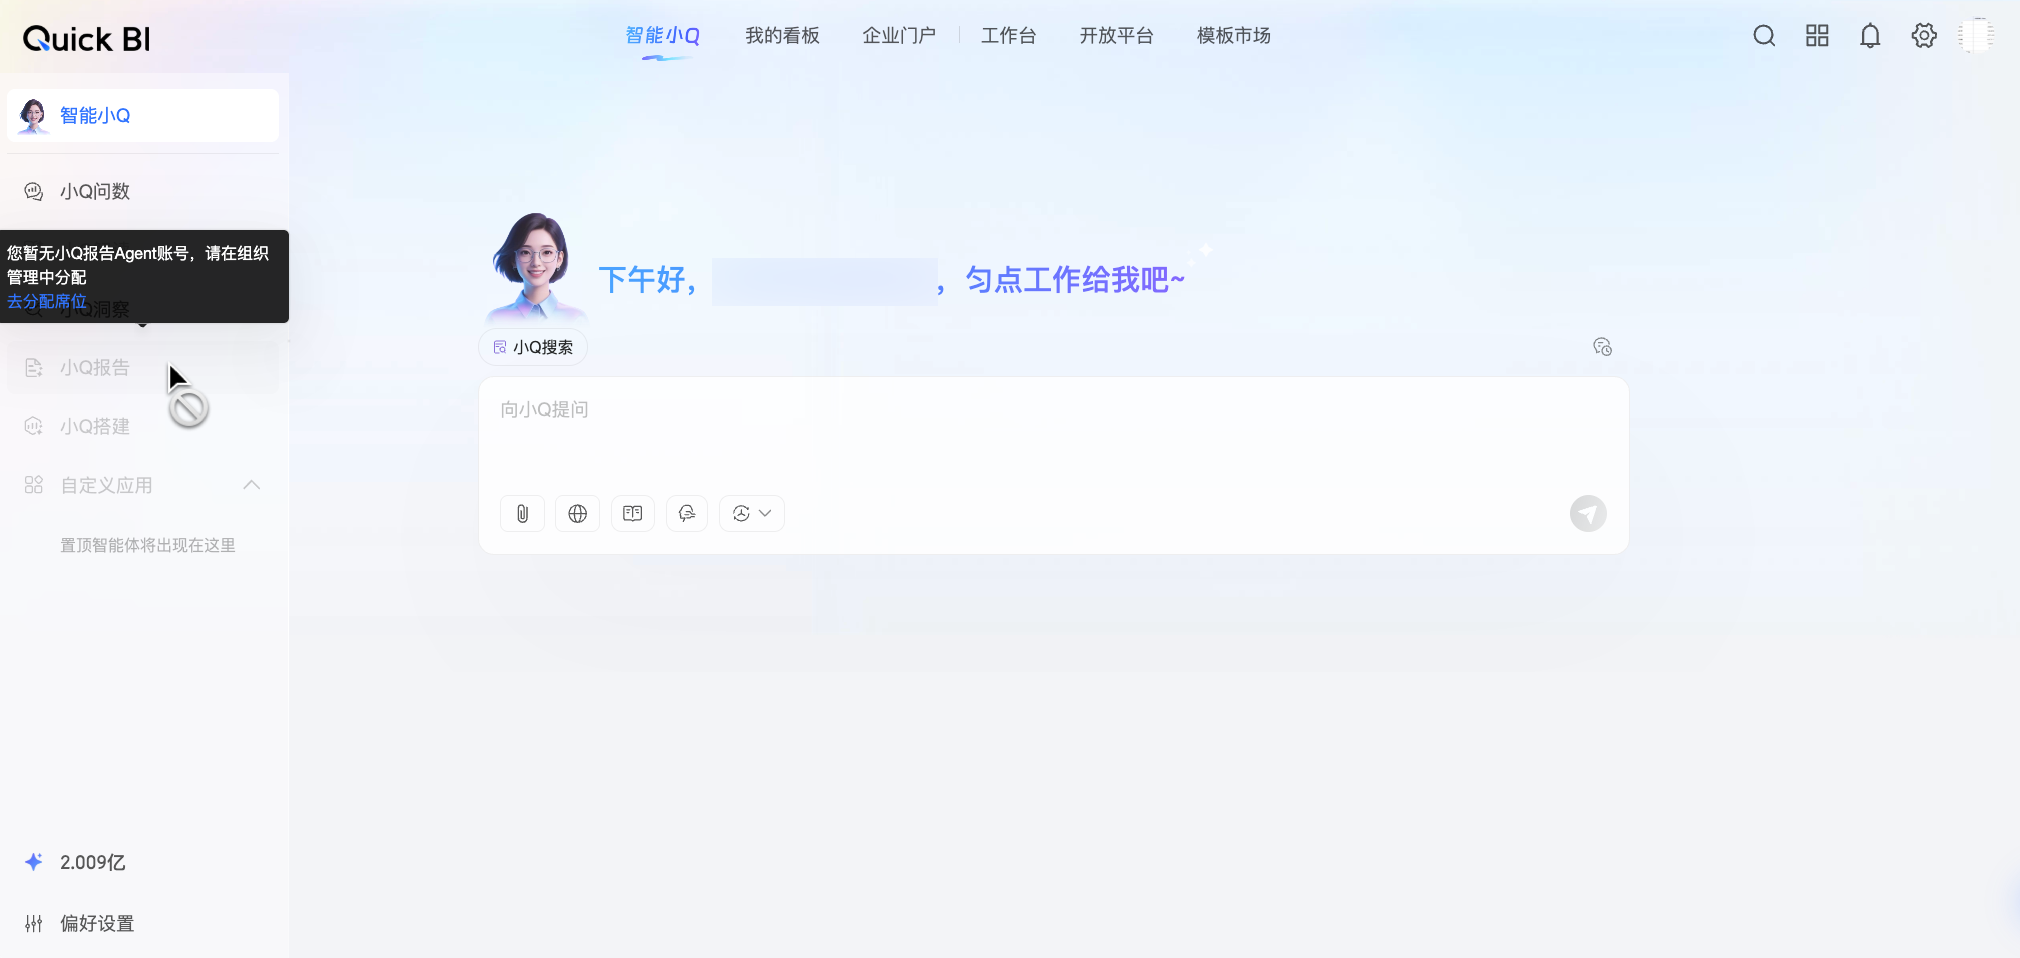
The Q-Query Agent lets you interact with your data using natural language to get immediate answers. This feature makes data analysis accessible to everyone and introduces a new way to consume data. On your PC or mobile client, you can preview and select a dataset in the smart query interface, ask questions directly or use suggested queries, engage in a multi-turn conversation, and review past conversations in the Conversation List.
Use cases:
Quick data retrieval: Use a Q&A format to get data efficiently, reducing the data retrieval workload and responding quickly to ad-hoc requests.
Anomaly detection: Identify unusual data in dashboards or data files and automatically drill down to find the source of the anomaly in more granular objects, such as pinpointing which customer is responsible for a monthly profit deviation.
Fluctuation attribution: Analyze the causes of metric fluctuations over different time periods from multiple perspectives, showing the contribution of each factor. This helps you identify root causes and determine a clear course of action.
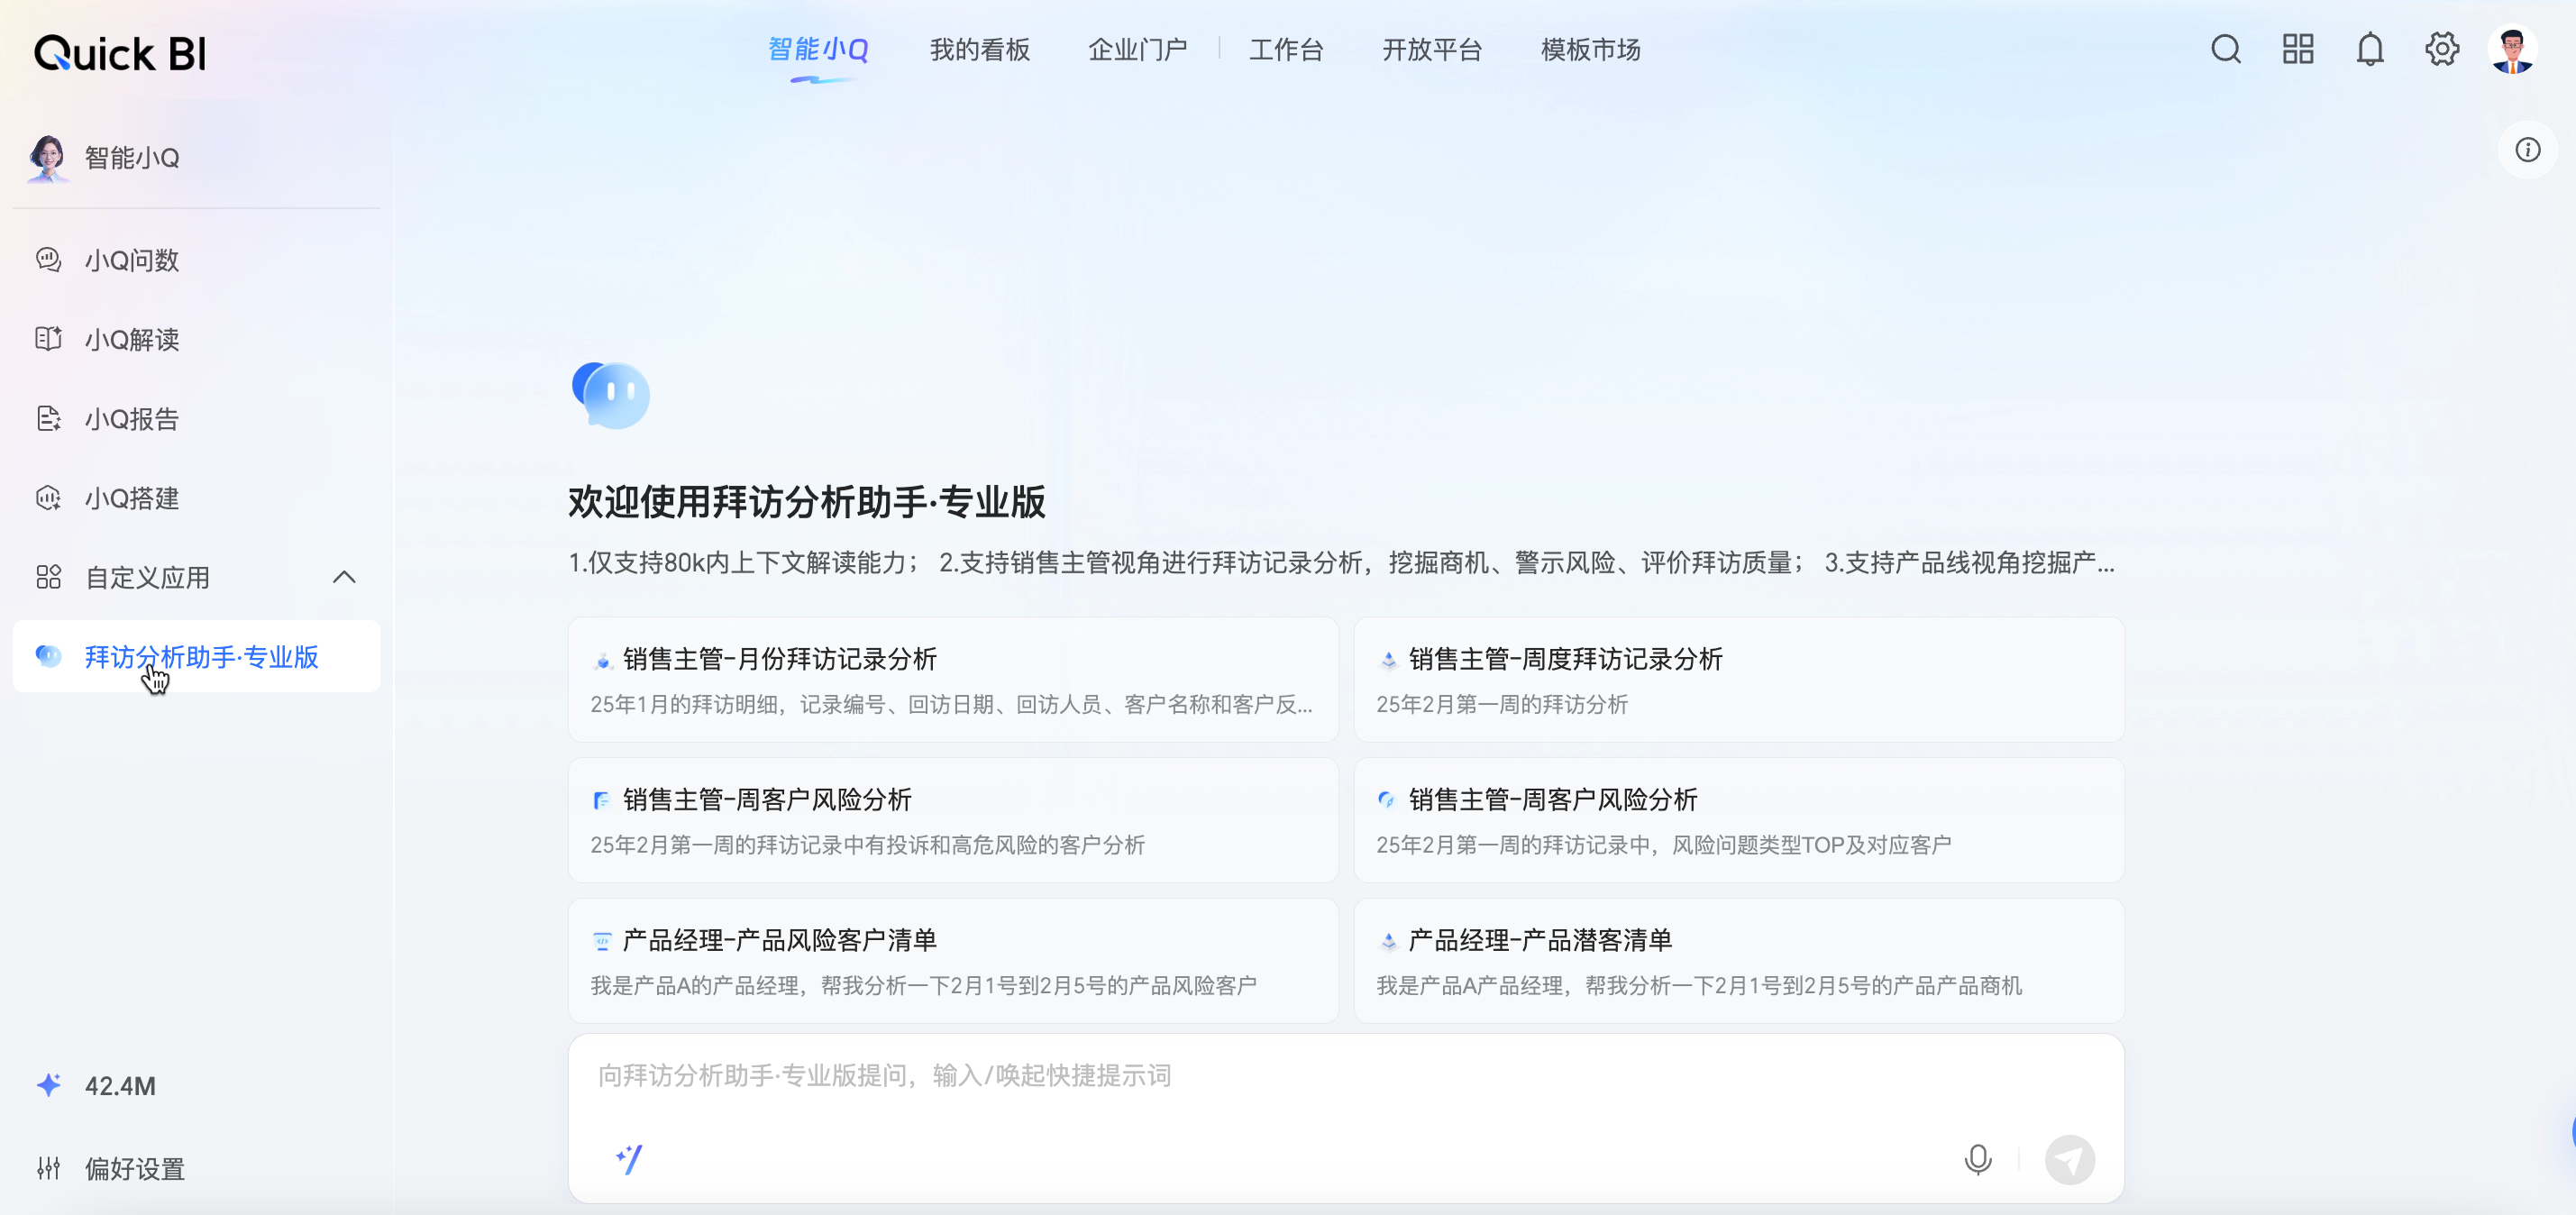
Alternative method:My Agents
If you need to connect to multiple agents, you can use the My Agents feature to have conversations and create custom AI analysis assistants.
Q-Insights Agent
The Q-Insights Agent leverages large models to interpret your dashboards for deeper insights. For example, as a data analyst in a sales department, you can use the one-click smart interpretation feature to analyze this year's sales data. If you need to go beyond a general analysis and dive deeper into specific metrics, you can perform detailed interpretations on multiple charts.
Use cases:
Dashboard analysis: Use large models to interpret the data on a dashboard. You can also generate insights in a specified format for weekly or monthly reports to help you complete standardized insight analysis.
Q-Report Agent
The Q-Report Agent replaces the tedious process of manual data searching, analysis, and screenshot compilation with an intelligent report generation experience with automated data retrieval, automated insights, and dynamic data integration.
A Q-Report is an editable online analysis document that helps you create periodic reports, such as weekly or monthly summaries, or quickly generate a business analysis report to support decision-making. This upgrades your workflow from manual data analysis to intelligent, data-driven decision-making.
Use cases:
Campaign marketing: When planning a 618 promotion, campaign operators can reference data and performance from the previous quarter's promotion to design the new plan.
Business analysis: A financial analyst needs to create a monthly business analysis report. This report provides deep, data-backed insights to support executive decisions during monthly meetings. It helps decision-makers quickly grasp key financial issues without sifting through lengthy documents.
Customer visits: Before visiting a customer, a sales representative can create a pre-visit report to review key information, such as the customer's status and collaboration history. This helps in formulating a more effective visit strategy and building stronger customer relationships.
Q-Creator Agent
The Q-Creator Agent focuses on one-click dashboard generation, conversational chart creation and configuration, one-click smart beautification, and intelligent insight attribution. It streamlines dashboard creation and data analysis.
Use cases:
Dashboard creation: Select a dataset and generate a dashboard with a single click to improve creation efficiency.
Assisted analysis: Perform complex operations, such as period-over-period comparisons, with a simple natural language command. Easily add conditional formatting, reference lines, and highlight maximum or minimum values to better understand your data.
Dashboard beautification: Instantly enhance the visual appeal of your dashboards with one-click beautification, applying thousands of configurations in seconds. You can also create dashboards that align with your corporate identity by using your company's logo and branding.
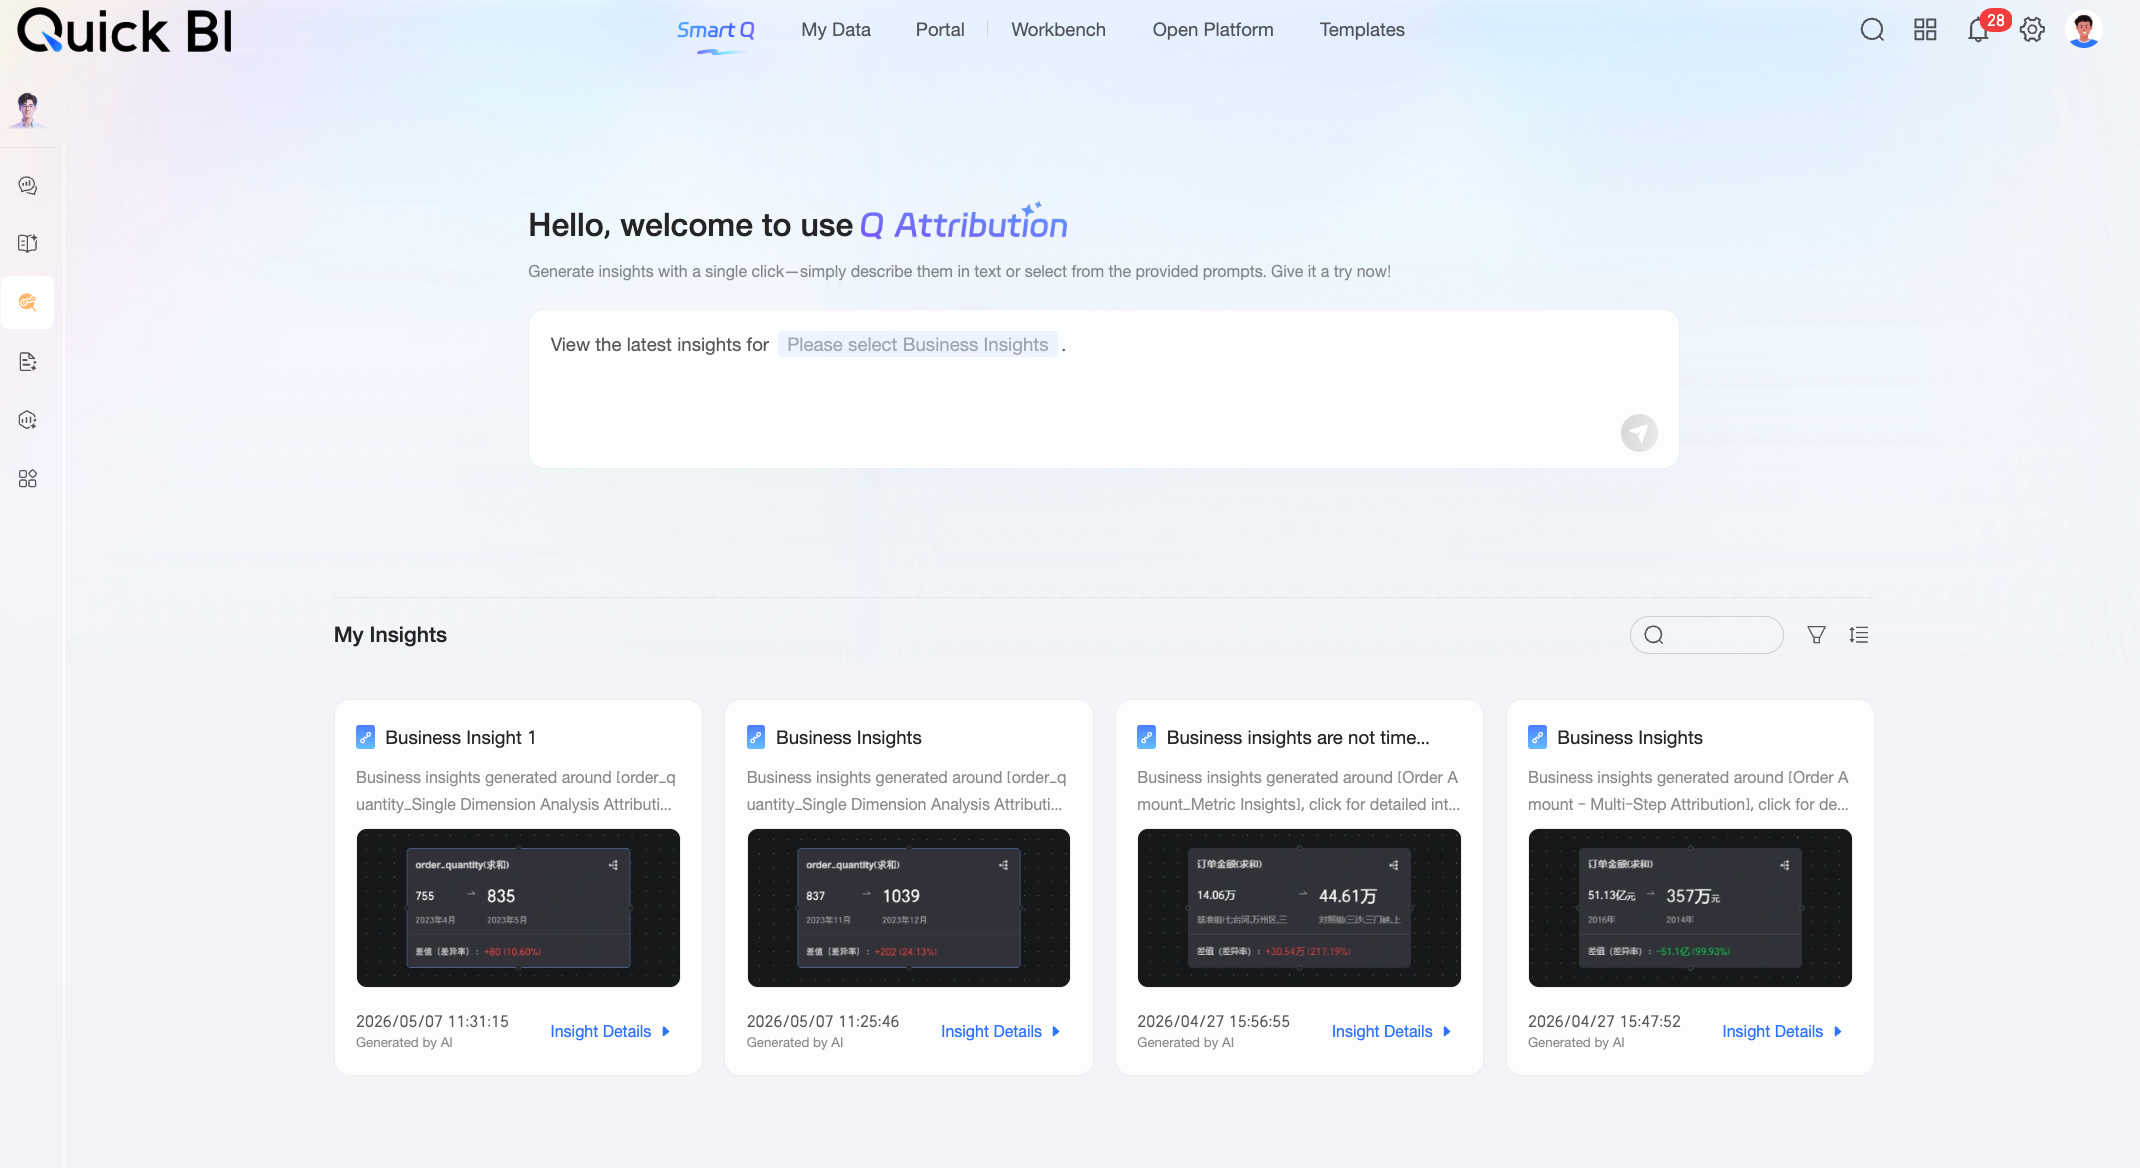
Q-Analysis Agent
The Q-Analysis Agent is designed to address common pain points in business analysis, such as the difficulty of tracking multi-metric fluctuations and the time-consuming nature of attribution analysis. Integrated within the Quick BI framework, it transforms complex business fluctuations into clear diagnostic paths through deep, node-level attribution and interactive exploration. Combined with automatically generated insight summaries, it creates an agile insight loop, from anomaly analysis and root cause identification to business decision-making.
Use cases:
Multi-metric correlated attribution
This feature goes beyond single-metric attribution by supporting simultaneous tracking and correlated attribution for multiple metrics, such as sales, traffic, performance, and efficiency. It supports attribution analysis for both time-based and non-time-based dimension comparisons. You can combine various attribution nodes and methods to build multi-level, multi-path smart attribution chains. After a data analyst configures the attribution logic, business users can reuse it with a single click to generate professional conclusions and add them to a Q-Report.
Interactive visual exploration
The attribution metric tree allows you to drill down from high-level nodes to leaf nodes. The system automatically generates insight summaries, and you can use custom prompts to adjust the analysis perspective for interactive exploration.
Elastic computing engine
To handle the large computational load of attribution, the agent provides both real-time and scheduled attribution modes. A pre-computation mechanism optimizes performance for long-running queries, ensuring system availability in high-frequency scenarios.
Differentiated permission control
Summaries support both a global mode (configured by a developer for a unified data view) and a private mode (where users perform independent attribution based on their own permissions). This ensures a balance between data security and flexibility.
Key advantages
Advantage 1: High accuracy
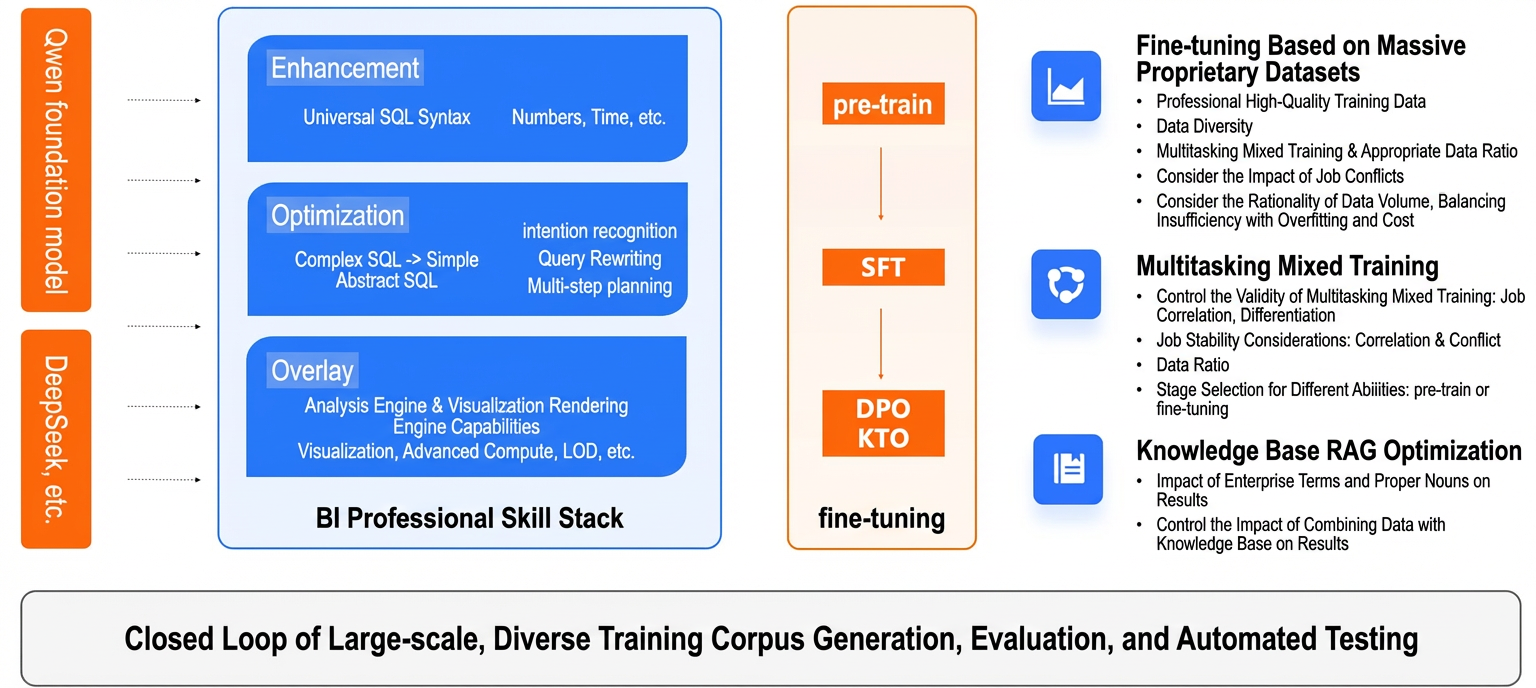
Leveraging the Qwen large model and three core technologies, Quick BI Intelli-Q accurately and quickly queries data from multiple heterogeneous sources. The system is compatible with dozens of database dialects and complex BI analytics. A built-in quality assessment ensures the model deeply understands your data, providing stable and reliable analysis results in any deployment environment.
Advantage 2: High maturity
Quick BI Intelli-Q provides an enterprise-grade intelligent analysis solution. With 15 years of experience serving thousands of customers, it offers an exceptional visual interaction experience and a comprehensive data security management system. This ensures an efficient and secure service for customers at all stages of development.
The product offers highly open integration capabilities, supporting system embedding and open APIs. It also introduces innovative support for custom agents, allowing you to connect to external models like Dify and Model Studio and reuse platform capabilities to build exclusive agents that are deeply integrated with your business scenarios.
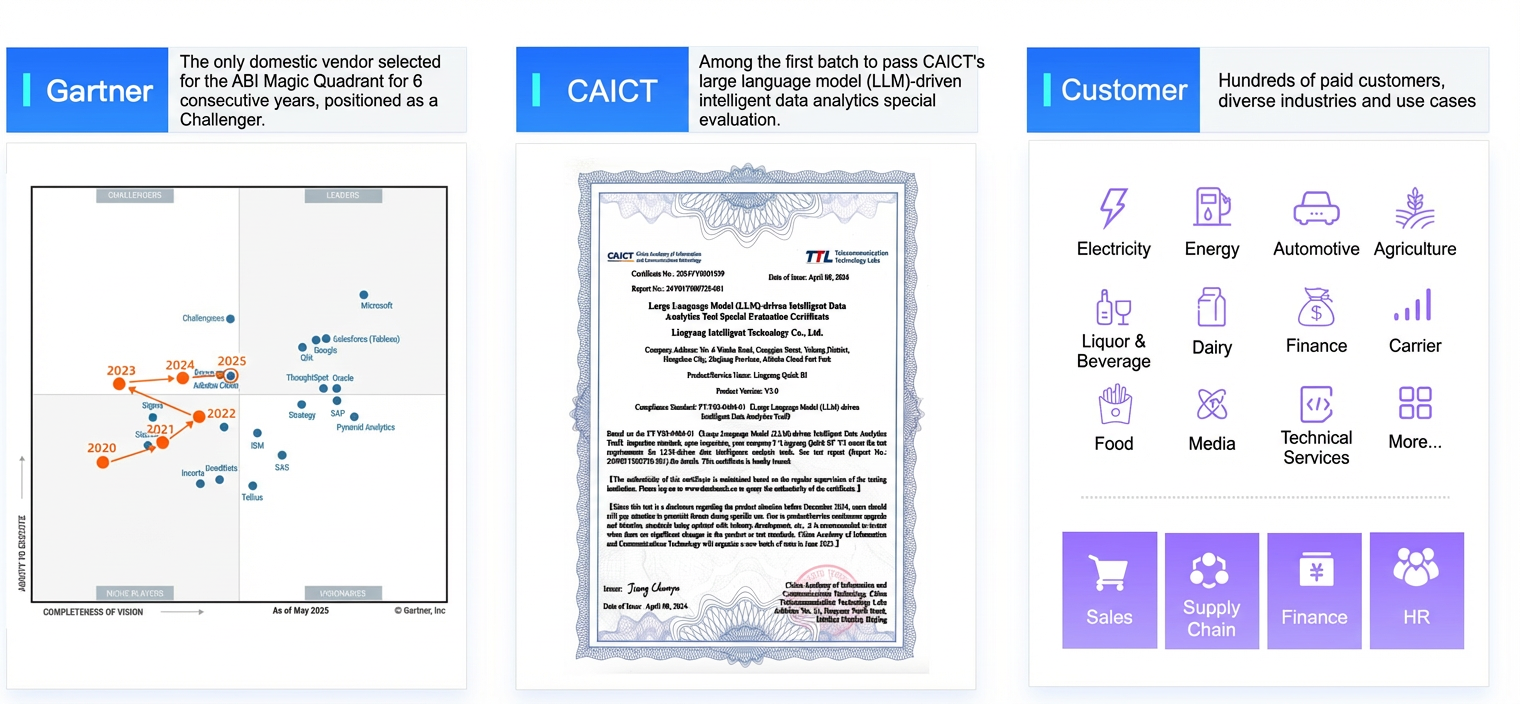
As the only domestic challenger to be included in the Gartner Magic Quadrant for Analytics and Business Intelligence for six consecutive years and among the first to pass the authoritative evaluation by CAICT, its product maturity and leading capabilities are widely recognized.
Advantage 3: High flexibility
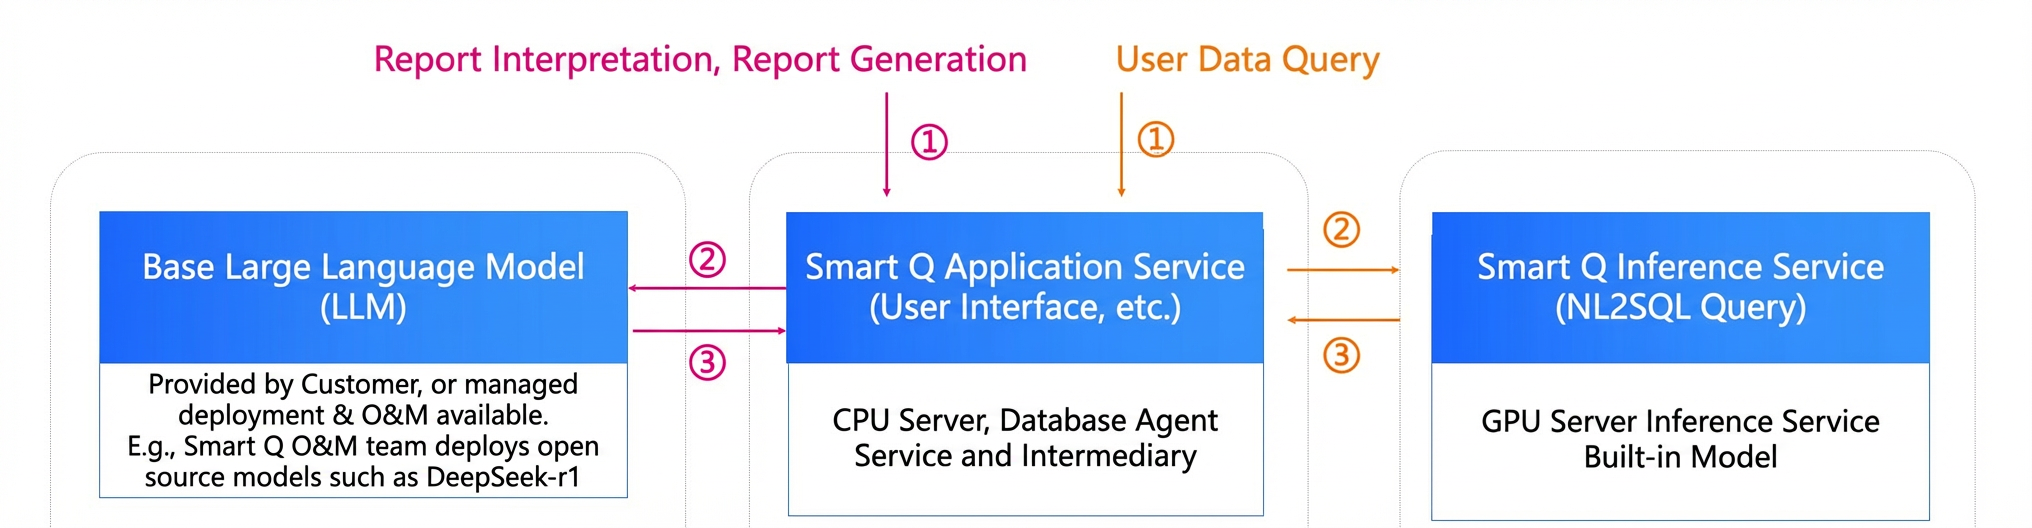
Quick BI Intelli-Q offers maximum flexibility, letting you choose your deployment environment, large model, and feature modules on demand to meet your personalized needs.
Request a trial or consultation
If you are interested in the features of Quick BI Intelli-Q, please fill out this form, and a specialist will contact you.