As your super data analyst, Quick BI Intelligent Q integrates multiple agents—including Q-DataQuery, Q-Report, Q-Insight, Q-Build, and Q-Search—into a unified entry point. Leveraging intent recognition, it automatically plans and routes your requests to the appropriate expert agent. This process enables you to derive key insights from a single sentence, simplifying data analysis. This guide outlines how to use Quick BI Intelligent Q.
Limitations
The four Quick BI Intelligent Q agents are add-ons and require a separate purchase.
If you purchase the Q-DataQuery agent, you can use the features of both the Q-DataQuery agent and the Q-Insight agent.
If you purchase the Q-Report agent, you can use the features of Q-Report.
If you purchase the Q-Build agent, you can use the features of Q-Build.
If you have permissions for at least one agent, the Intelligent Q entry appears in the top navigation bar, and you can use the smart chat box for intent recognition. If you do not have the required permissions, this entry is not displayed.
Only the Advanced Edition and Professional Edition support purchasing the four Quick BI Intelligent Q agents as add-ons. The Personal Edition does not support this feature.
Use cases
In today's complex enterprise data landscape, business users often face fragmented data sources, scattered analysis entry points, and complicated workflows. To address these challenges, Quick BI Intelligent Q is designed to act as a super data analyst.
Quick BI Intelligent Q brings the intelligent capabilities of Quick BI to the forefront, integrating them into a single user experience. It bridges the final gap between data and knowledge, and between questions and actions, and provides every business user with a professional data analyst to guide their analysis and decision-making.
Key use cases include:
Scenario |
Core need |
Intelligent Q solution |
Related feature |
|
You need to immediately analyze an Excel or CSV file, or query a dataset within the system. |
Upload a file or use a dataset within the system. Interact with your data using natural language to get immediate results, including auto-generated charts and conclusions. |
Q-DataQuery |
|
You need to quickly identify the cause of a data anomaly. |
Select a chart on a dashboard and ask a question. The system intelligently analyzes anomalous data, identifies business trends, and generates a key insight report with a single click. |
Q-Insight |
|
You need to efficiently create a structured analysis report for a meeting. |
Select a weekly or monthly report template and upload your data. The system automatically generates a report complete with text and charts. |
Q-Report |
|
You want to monitor specific data over time but lack dashboard design skills. |
Create a visual dashboard from a business dataset with a single click. |
Q-Build |
|
You cannot find a historical report or a relevant analysis example. |
Enter keywords to quickly locate resources such as reports, dashboards, metric monitoring, and workspaces. |
Q-Search |
|
You need to make decisions based on external data or domain knowledge. |
For example, switch to a custom agent like "Market Intelligence Assistant" to query and compare competitor prices. |
custom agent |
For detailed examples, see Scenario examples in this topic.
Key benefits
Shorten the path to insight: By consolidating high-frequency, low-barrier intelligent analysis capabilities into a unified entry point, users can quickly start data analysis, significantly reducing the learning curve and improving efficiency.
Unified data view: It integrates data assets within the BI system with external knowledge bases to create a single, comprehensive view of enterprise data. This breaks down information silos and enables more thorough analysis.
Intelligent intent recognition: Automatically understands your queries and routes them to the appropriate agent. This ensures you get accurate and efficient answers, providing a more intelligent interactive experience.
Features
Chat with Quick BI Intelligent Q
Access
Click Intelligent Q in the top navigation bar of the Quick BI console to open the Quick BI Intelligent Q chat page.
In the smart chat box, you can directly enter questions for Intelligent Q. You can also configure the following options as needed.
Parameter |
Description |
Quick-ask |
Click the |
Upload Attachment |
Click the |
Online Search |
Click the
Note
Currently, only Q-Report supports online search. |
Enterprise Knowledge Base Search |
Click the When this feature is enabled, the large language model can use information from the knowledge base to generate reports that align with your company's specific context and logic.
Note
Before you can select a knowledge base, an organization administrator must configure and enable it in organization management. For instructions on how to configure a knowledge base, see Knowledge base management. |
Analysis Framework |
Click the Once enabled, you can select the required analysis framework or content template from the drop-down list.
Note
|
Select a large language model |
This feature supports Auto-select model. When enabled, the system automatically selects the optimal model by balancing quality and speed. This is suitable for most scenarios. You can also disable Auto-select model and manually choose a built-in large language model or a custom large language model for your analysis. |
 icon to enable this feature. Once enabled, you can specify which knowledge base to use.
 icon to enable or disable specifying an analysis framework.
Quick-ask
If you are not sure what to ask Intelligent Q, you can choose from the quick questions below. These prompt templates cover various business scenarios to help you get started quickly.
You can also click the ![]() icon below the chat box to open the Quick-ask panel.
icon below the chat box to open the Quick-ask panel.
Alternatively, type / to open quick prompts.
Chat history
Click the ![]() icon in the upper-right corner of the smart chat box to open the chat history panel.
icon in the upper-right corner of the smart chat box to open the chat history panel.
You can clear the chat history. This action cannot be undone.
Click Intelligent Q to exit the chat and return to the home page.
Select an expert agent
Automatic intent recognition
If you do not select a feature, the system automatically identifies your intent and routes your query to the appropriate module for analysis.
This section lists only a few basic examples of intent recognition. You can explore other possibilities based on your business needs or try the Quick-ask feature.
Route to Q-DataQuery
For example, if you enter "What was the order amount yesterday?", the system recognizes that you want to query data and automatically selects the Q-DataQuery module. Then, follow the prompts to get the result.
Route to Q-Insight
For example, if you enter "Help me interpret the annual analysis report", the system recognizes your need for data interpretation and automatically selects Q-Insight to perform the task. Then, follow the prompts to select the dashboard for interpretation and get the results.
Route to Q-Report
For example, if you enter "Help me generate a monthly fault monitoring report", the system recognizes that you want to generate a report and automatically selects Q-Report to perform the task. Then, follow the prompts to generate a report.
Route to Q-Build
For example, if you enter "Help me build a dashboard using the sales dataset", the system recognizes that you want to build a dashboard and automatically selects Q-Build to perform the task. Then, follow the prompts to build a dashboard.
Route to a custom agent
The Quick BI Intelligent Q chat box automatically routes queries to official or custom agents based on intent recognition. For example, if you enter "Help me analyze visits for the first week of this year", the system automatically matches this request with the "Visit Analysis Assistant · Professional Edition" agent and provides an answer.
Manually select an agent
If you know which feature you want to use, you can manually select it.
You can select a specific Intelligent Q skill based on your business needs, either above the smart chat box or in the left-side navigation pane.
Click the selected skill in the smart chat box to switch to another skill.
The features are described as follows:
Feature |
Description |
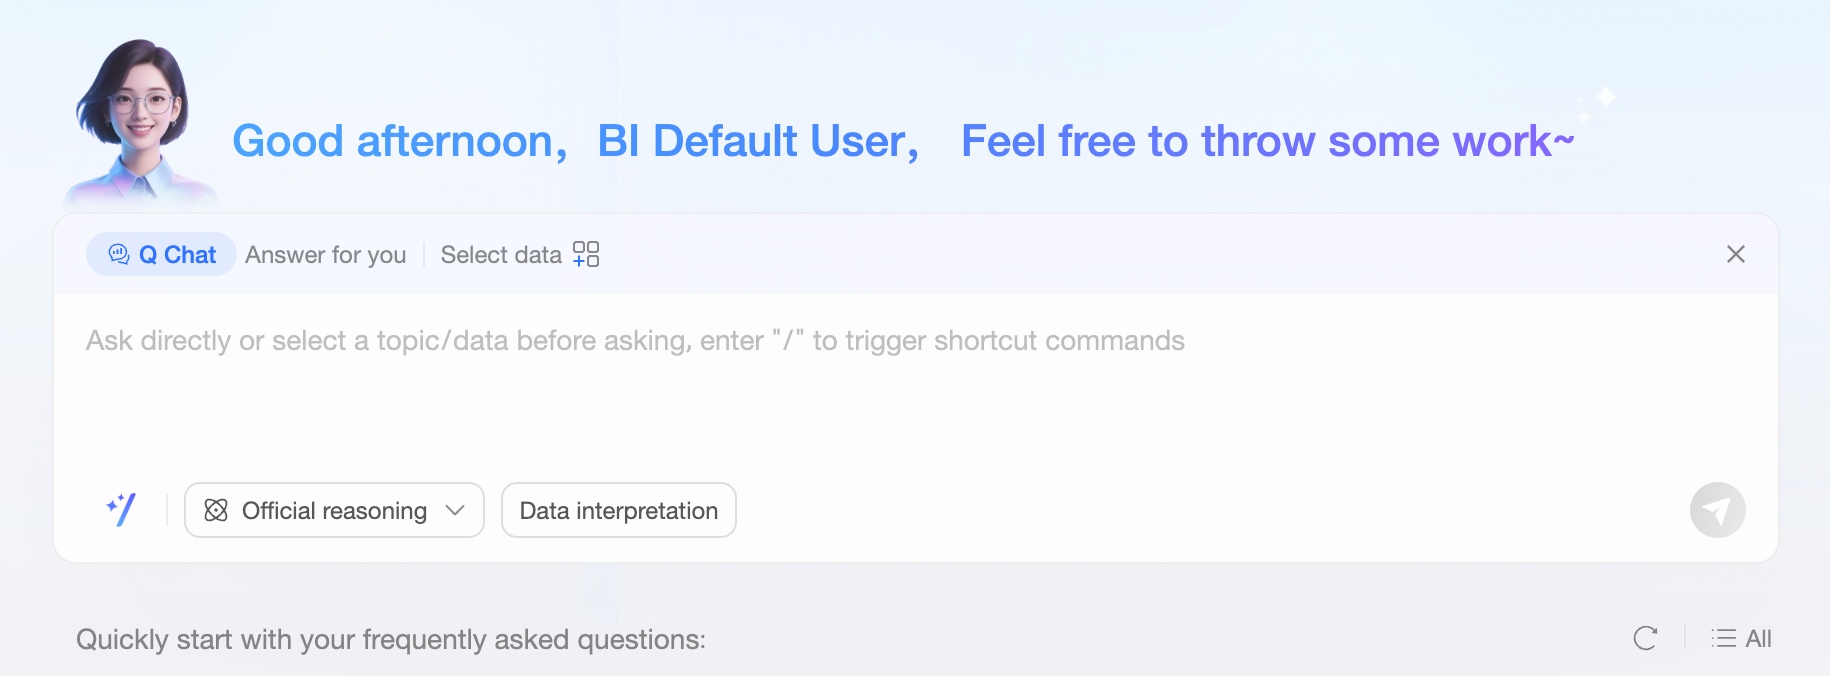
Q-DataQuery |
After you open Q-DataQuery, you can select data and start a query. For more information, see Start a data query. Smart chat box view:
Navigation pane view: |
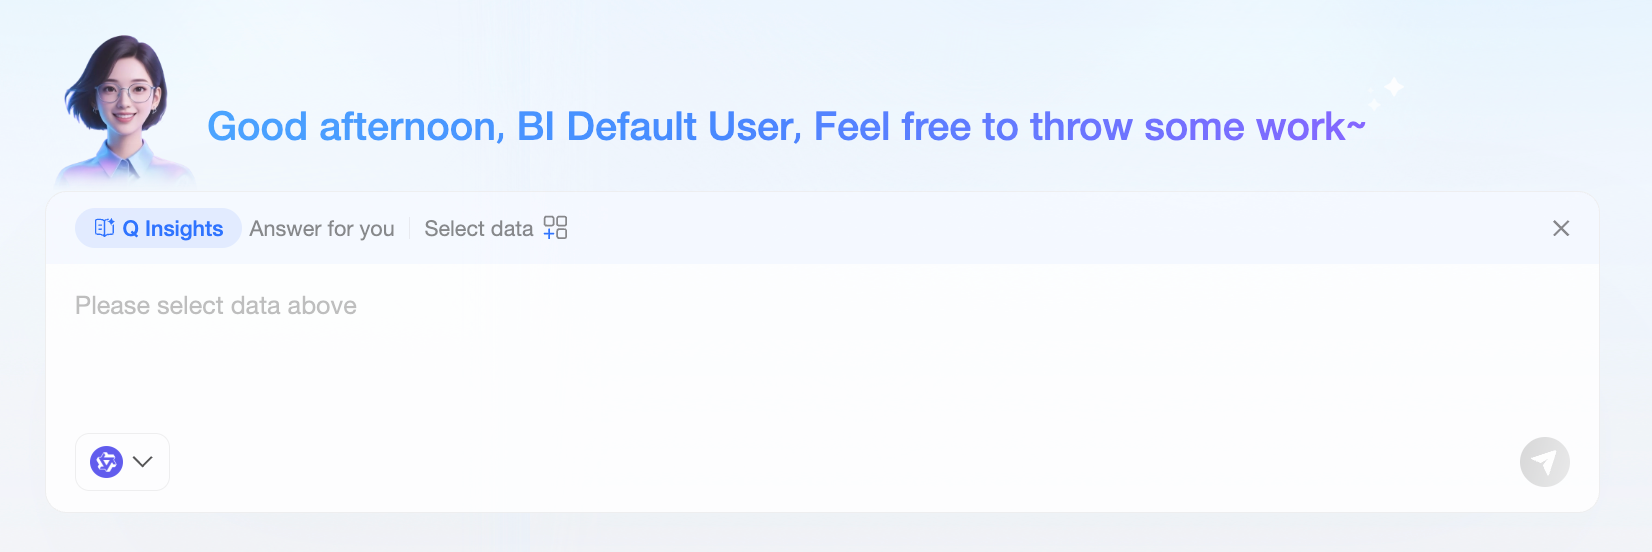
Q-Insight |
After you open Q-Insight, you can select dashboard data for interpretation. For more information, see Use Q-Insight on a dashboard. Smart chat box view:
Navigation pane view: |
Q-Report |
After you open Q-Report, you can generate a report based on your business needs. For more information, see Create a Q-Report. Smart chat box view: Navigation pane view: |
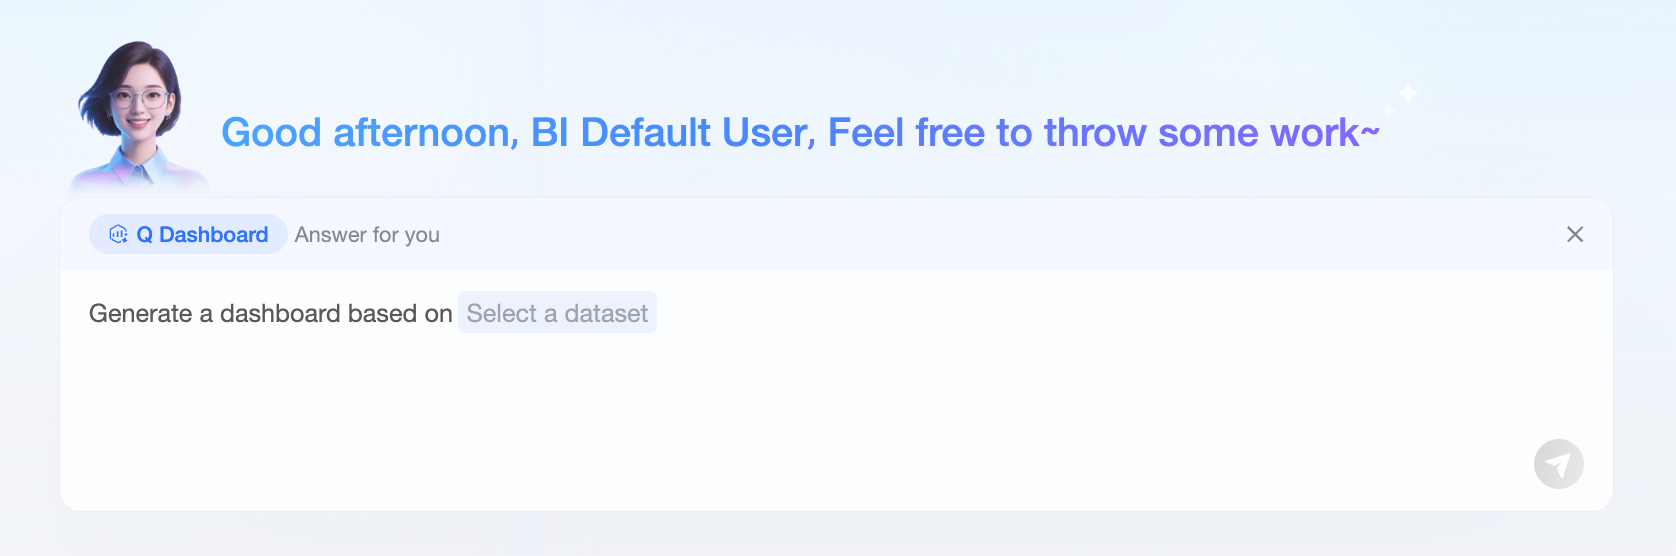
Q-Build |
After you open Q-Build, you can generate a dashboard from a dataset. For more information, see Q-Build instructions. Smart chat box view:
|
Q-Search |
After you open Q-Search, you can use keywords in your questions to get accurate search results. For more information, see Intelligent search.
Note
Q-Search is available only in the smart chat box and does not have an entry in the left-side navigation pane. You can also access this feature by clicking Global Search in the upper-right corner of the home page. |
custom agent |
For more information, see Chat with an agent. |
 Navigation pane view:
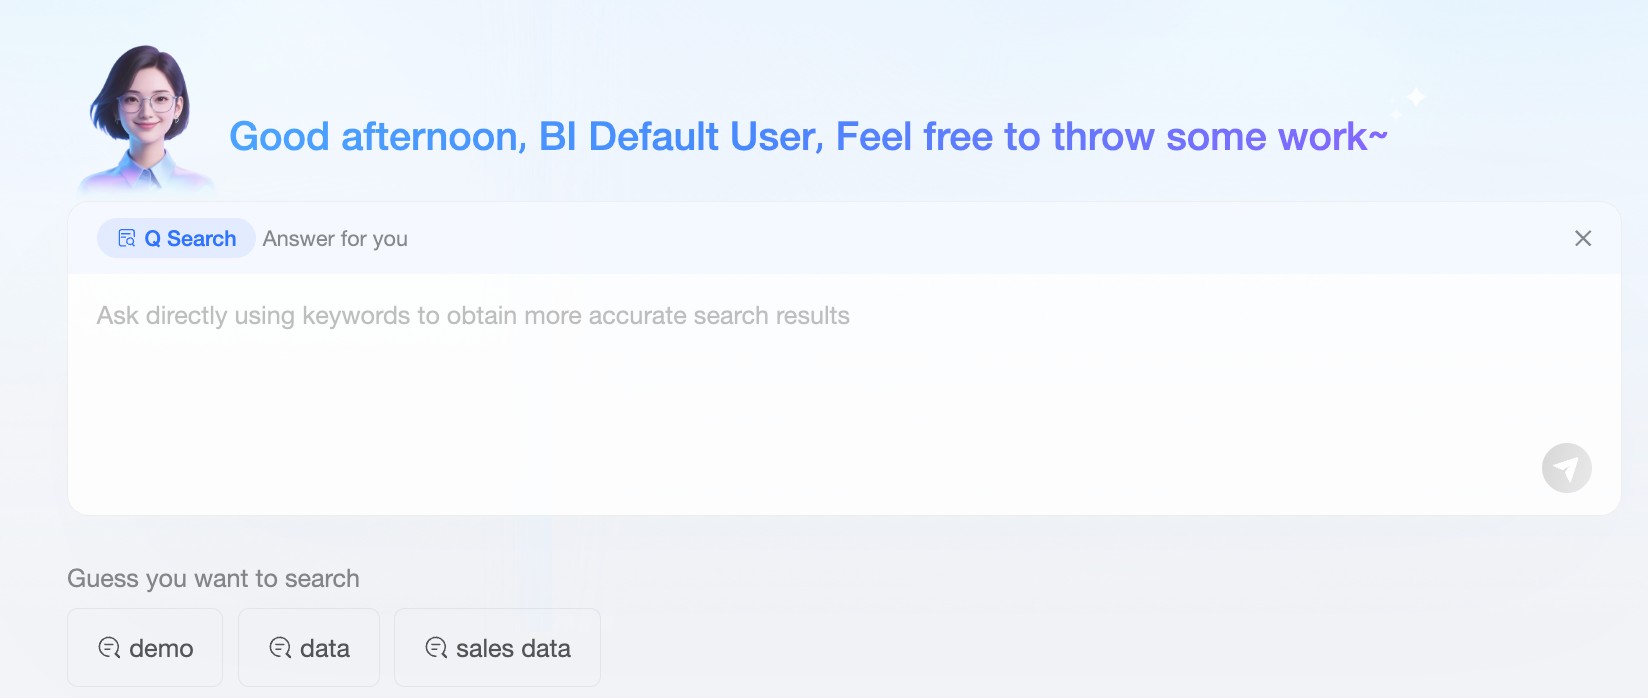
Preference settings
Hover over the left-side navigation pane and select your preferred interactive avatar in Preference Settings.
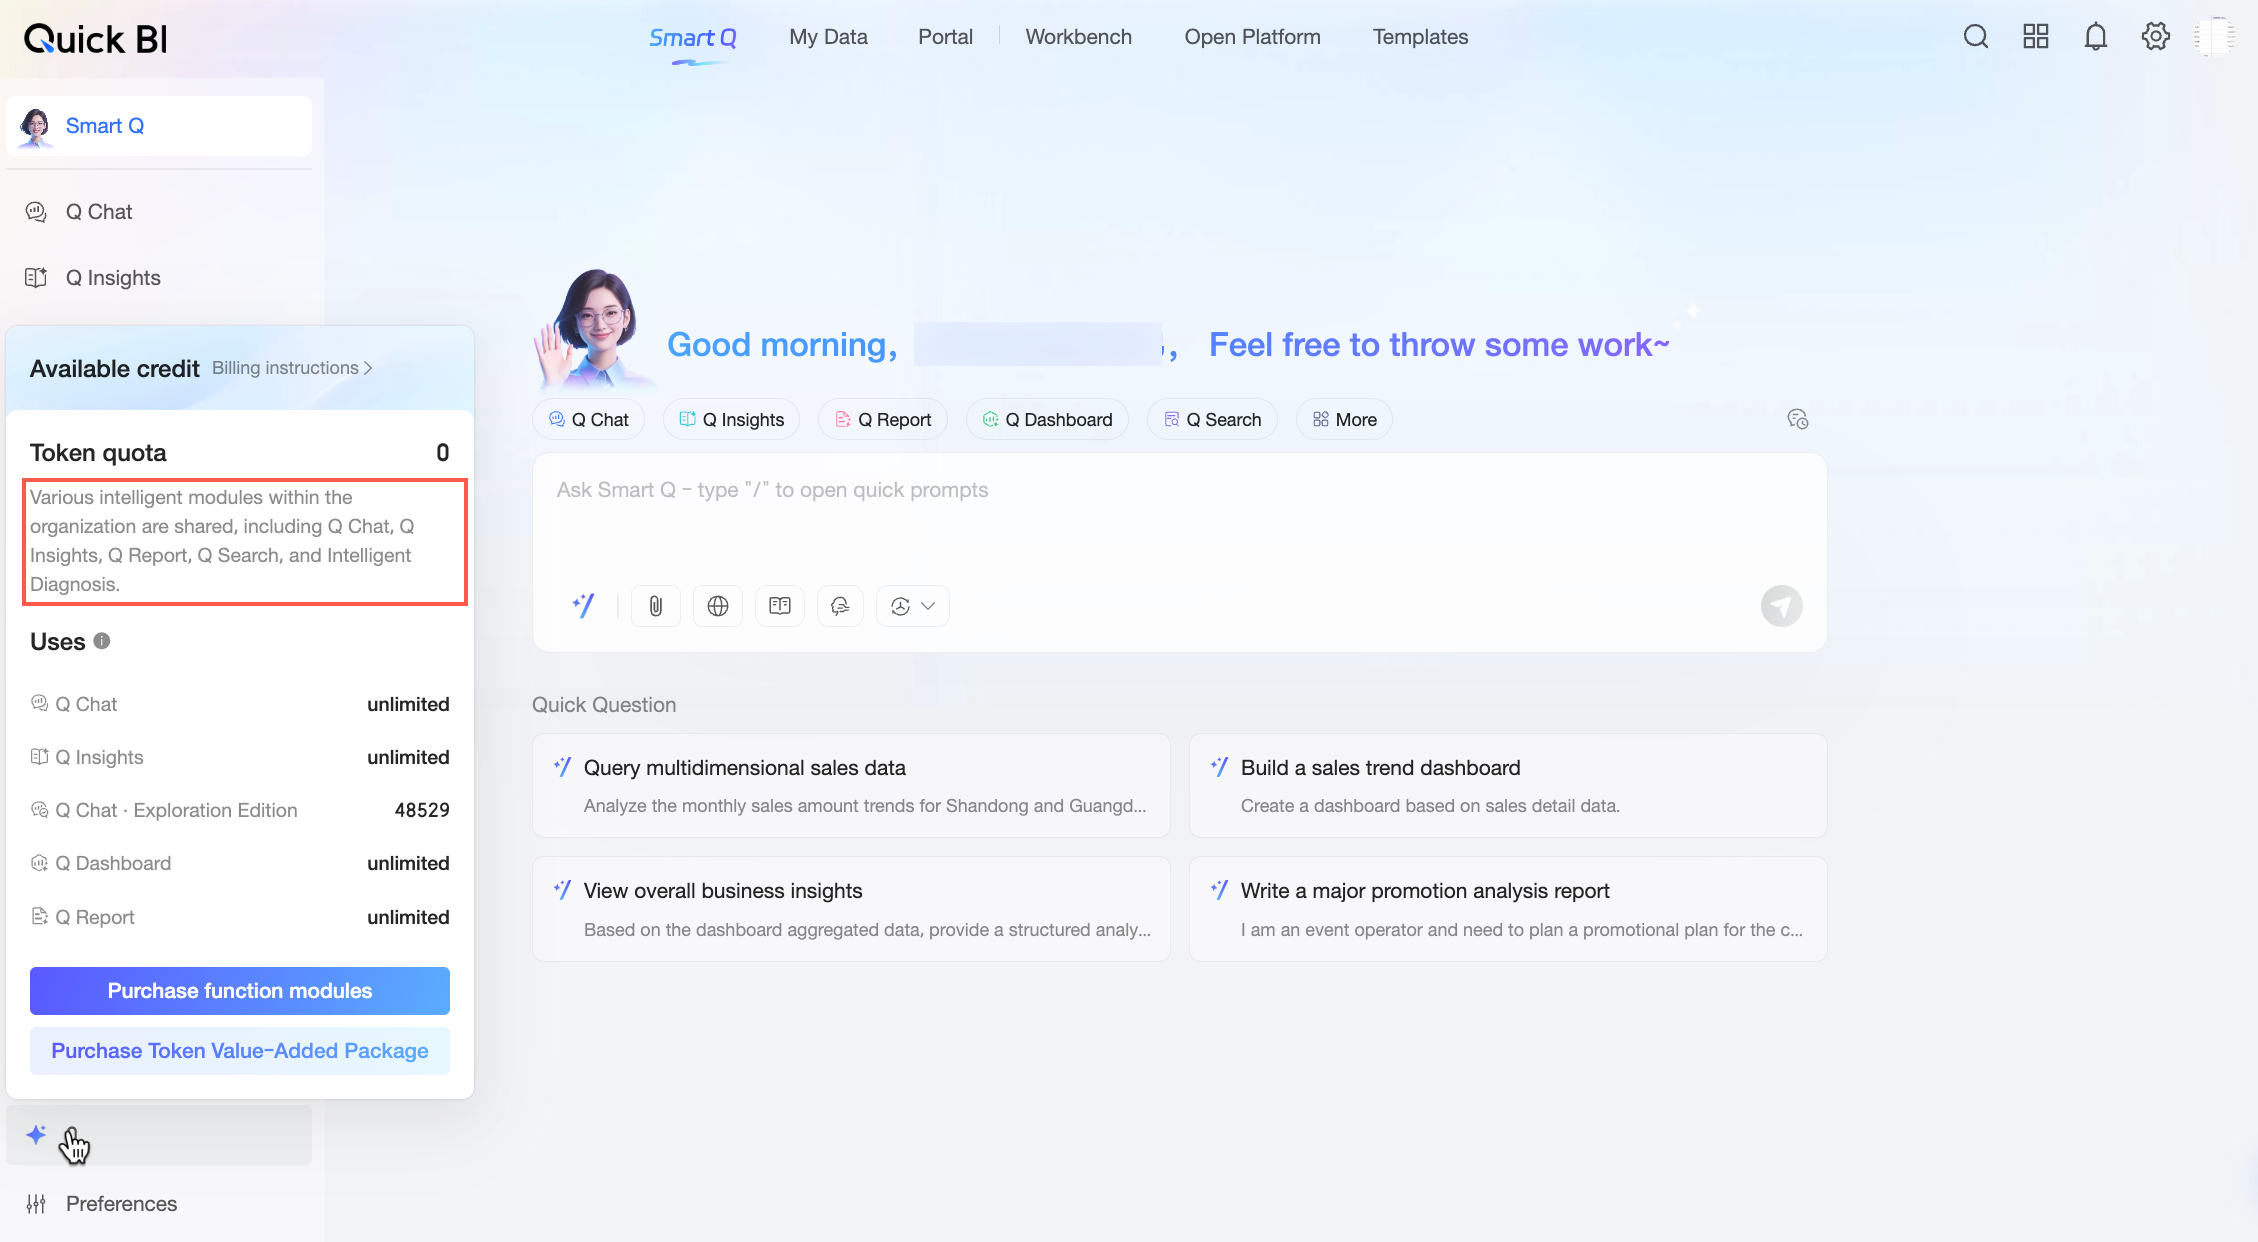
Available quota
The left-side navigation pane displays the available quota. Click it to view your organization's token quota and usage count for Quick BI Intelligent Q.
Token quota: Shared across all intelligent modules in your organization, including Q-DataQuery, Q-Insight, Q-Report, Q-Search, intelligent diagnostics, and more.
Usage count: Shows the number of times Q-DataQuery, Q-Insight, and Q-Report have been used.
You receive a free quota by default. If it runs out, you can purchase a token add-on pack. For more information, see Quick BI billing methods - China site.
Scenario examples
This section presents an end-to-end scenario, showing how Quick BI Intelligent Q supports a typical business workflow.
1. Generate a weekly report with Q-Report
In the morning, before the weekly business meeting, use Q-Report to create an operations analysis report for review. The report covers core goal alignment, key achievements, identified issues and solutions, and the plan for the upcoming week. Follow these steps:
Click Intelligent Q in the top navigation bar of the Quick BI console.
Upload the file, enter a prompt, and then click Send.
The system returns an execution plan. Click OK to proceed.
The system returns the analysis results. Click Generate and Edit Report Document.
Make any necessary adjustments, and then save the report.
2. Use Q-Insight to interpret a dashboard
From the report, you see significant losses in the Central and North China regions. You need to review key metrics and interpret the related dashboards. Follow these steps:
Select the relevant dashboard and perform a one-click interpretation.
Add the interpreted content to the Q-Report.

After saving, you can share the adjusted Q-Report with department leaders through your office automation (OA) system.
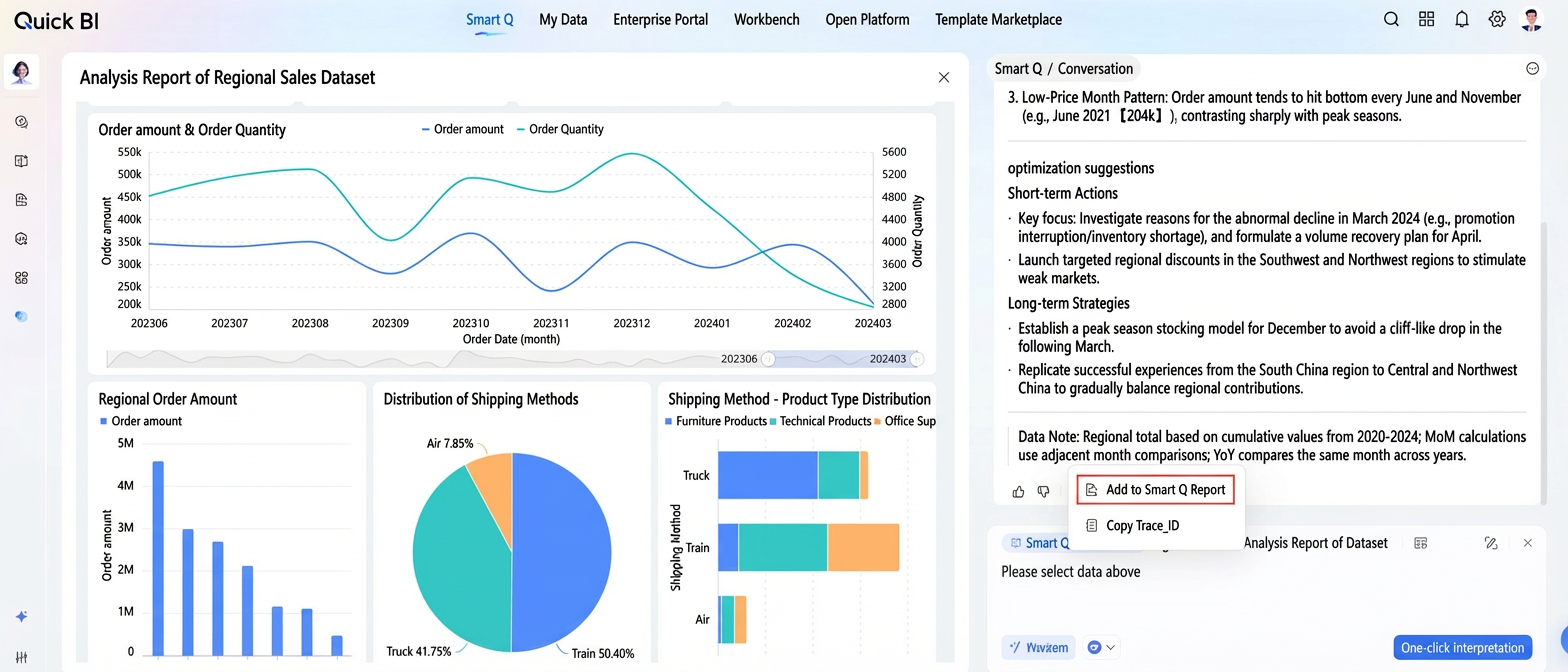
3. Use Q-DataQuery to analyze ad-hoc data
During the meeting, a department leader sends you an Excel file named "Regional Sales Data" and asks you to find the fastest-growing and worst-performing regions. You can use Q-DataQuery to perform this analysis quickly.
Follow these steps:
Click Intelligent Q in the top navigation bar of the Quick BI console.
Upload the Excel data for analysis.
Enter the prompt "Help me analyze this sales data and find the fastest-growing and worst-performing regions," and then click Send.
The system returns the analysis results.
Add the analysis results to the Q-Report and share it with the department leader.
4. Find a historical report with Q-Search
A business team needs help finding a sales-related dashboard. You can use Q-Search to locate it quickly. Follow these steps:
Click Intelligent Q in the top navigation bar of the Quick BI console.
Enter the prompt "Help me find sales-related dashboards" and send it. The system automatically returns the search results.
Use filters to narrow down the results and locate the dashboard you need.
Share the dashboard with the relevant business users.
This workflow demonstrates how Quick BI Intelligent Q can serve as your data analyst throughout the workday.