Display on Tablet Terminal
Tablet-side capabilities are provided. One-side configurations and multiple-side views can meet your daily needs for previewing reports and viewing reports on separate screens. This topic describes the Tablet-side interface and basic operations.
Benefits
After the PC-side configuration is completed, the layout can be flexibly switched automatically according to the size of different tablet devices, and the layout customization capability is also provided.
A variety of gesture capabilities are introduced on the tablet end to better fit the user's usage habits of the touch screen end.
This feature allows you to view reports in multiple scenarios, such as data and comments.
Tablet Report View
Open a report in a browser
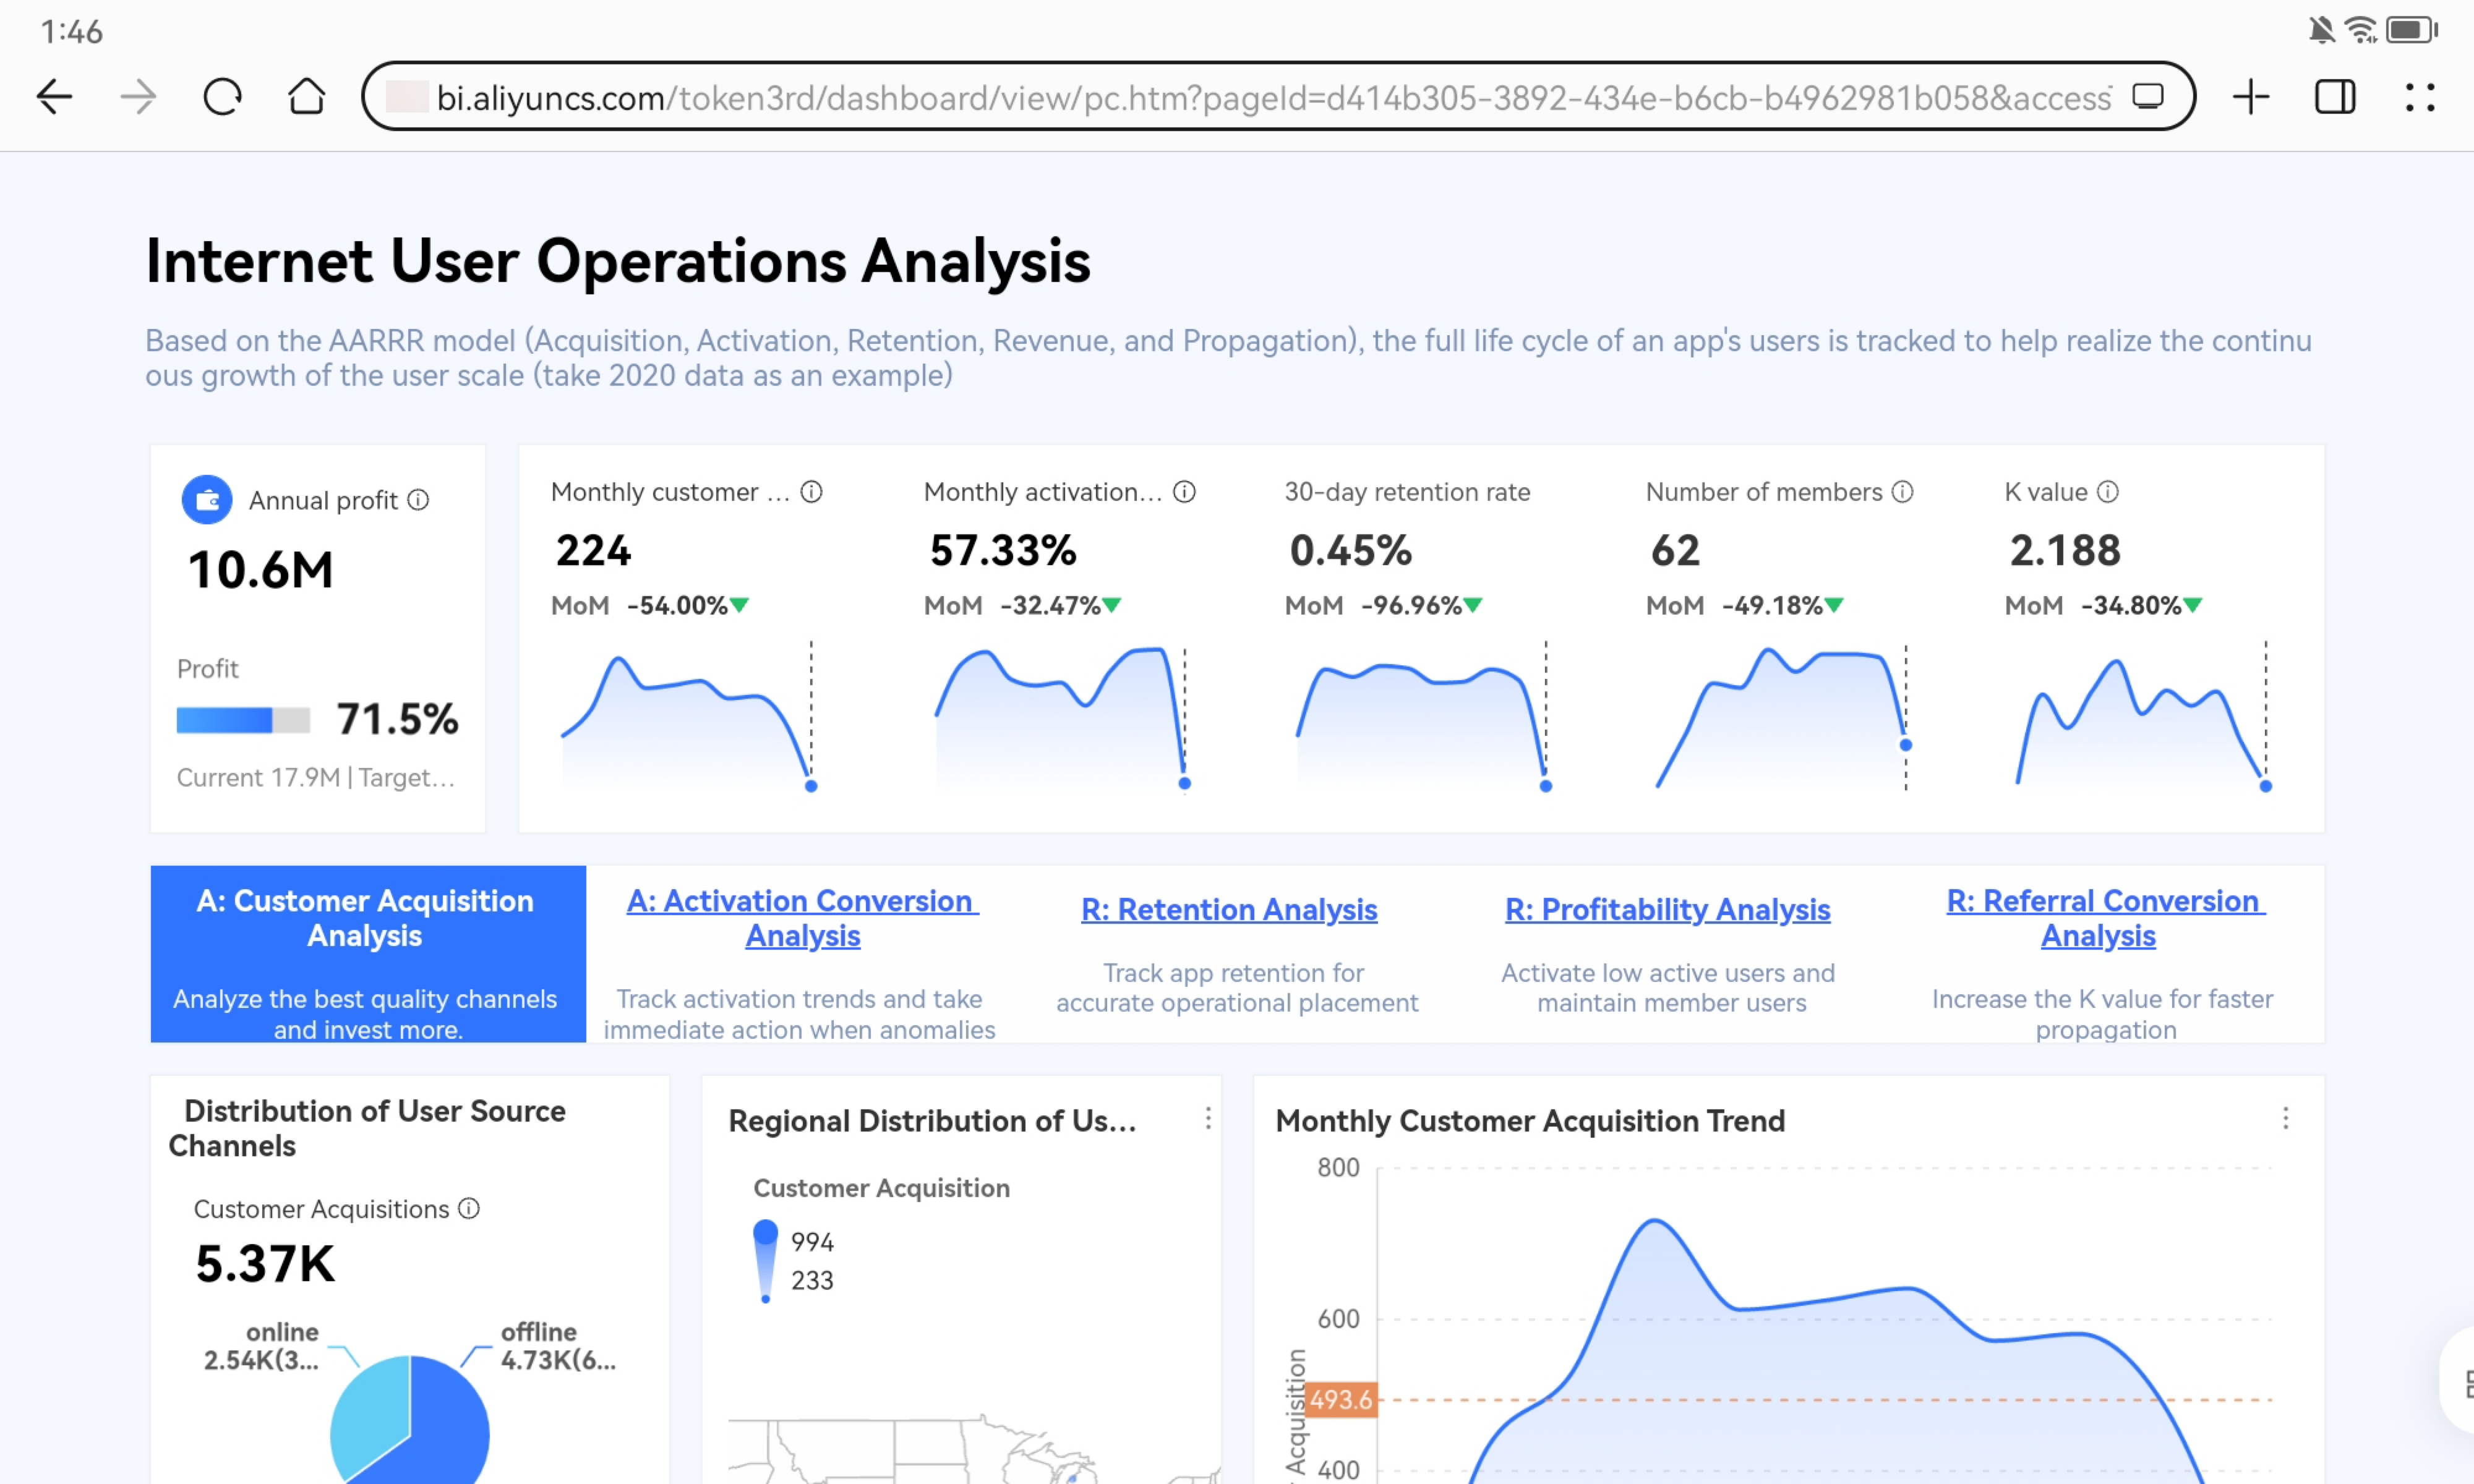
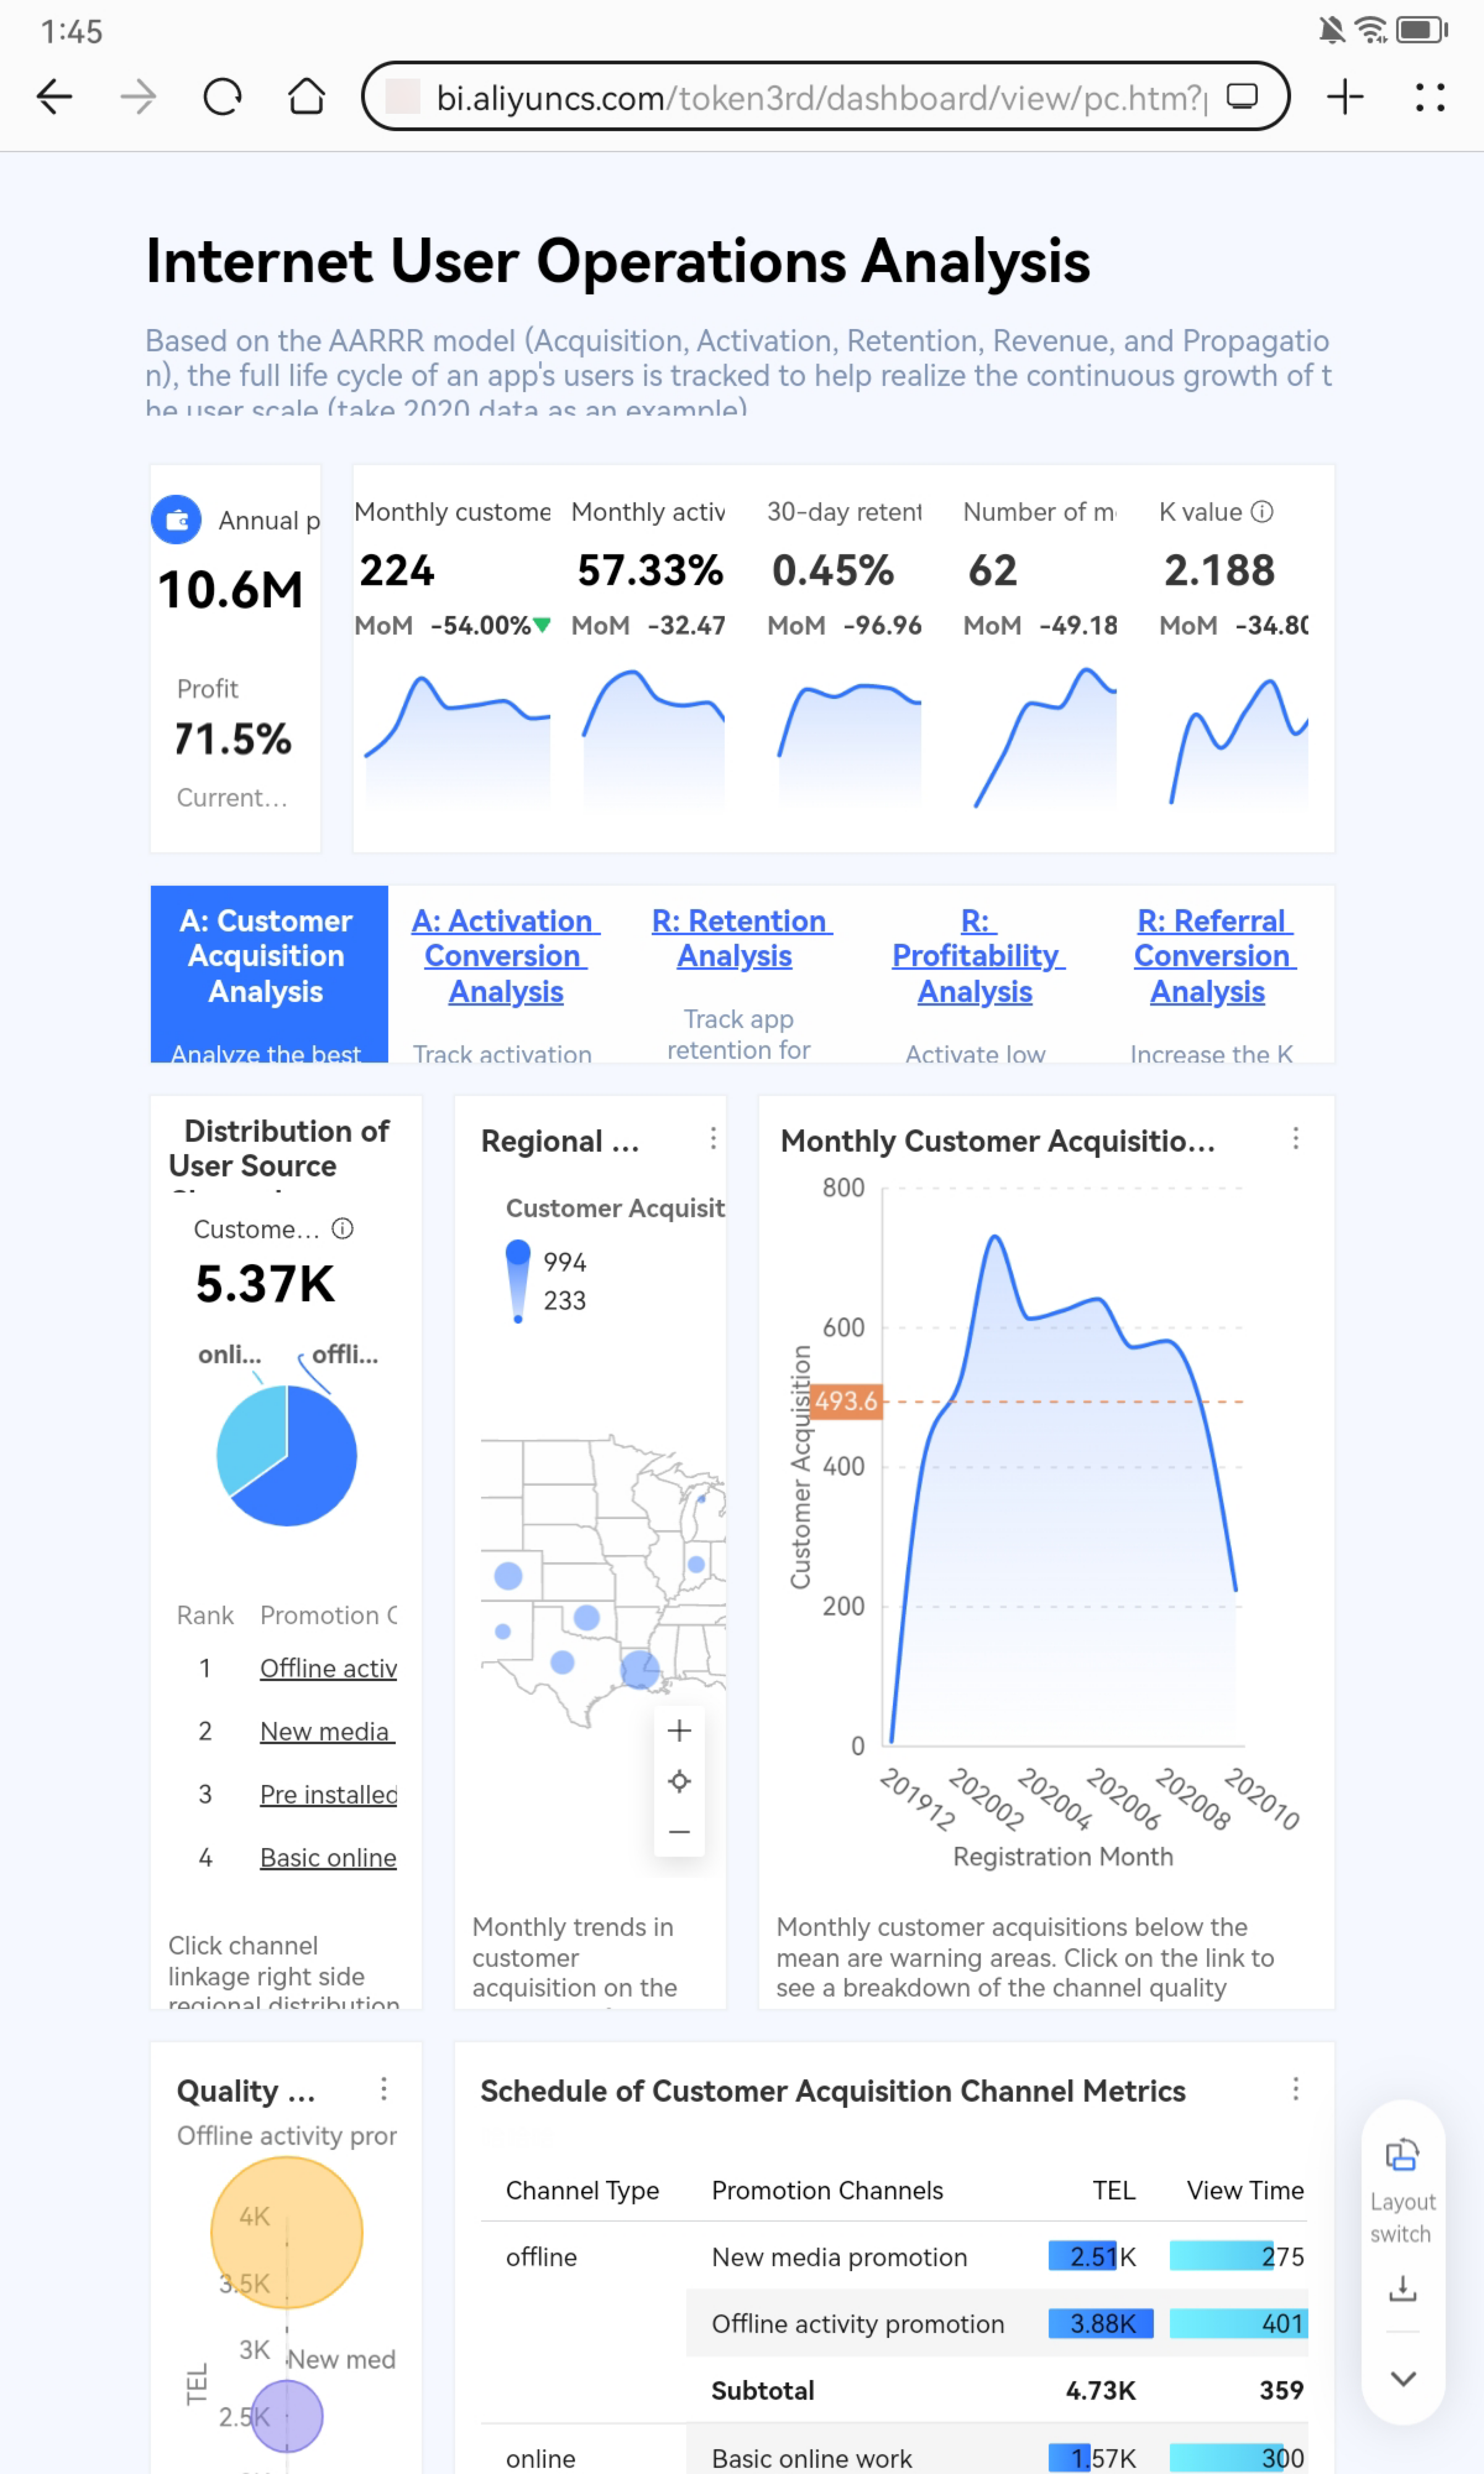
You can copy the report link shared by others and open it in the browser of the tablet. The effect is as follows.
Horizontal scree effect
Vertical screen effect
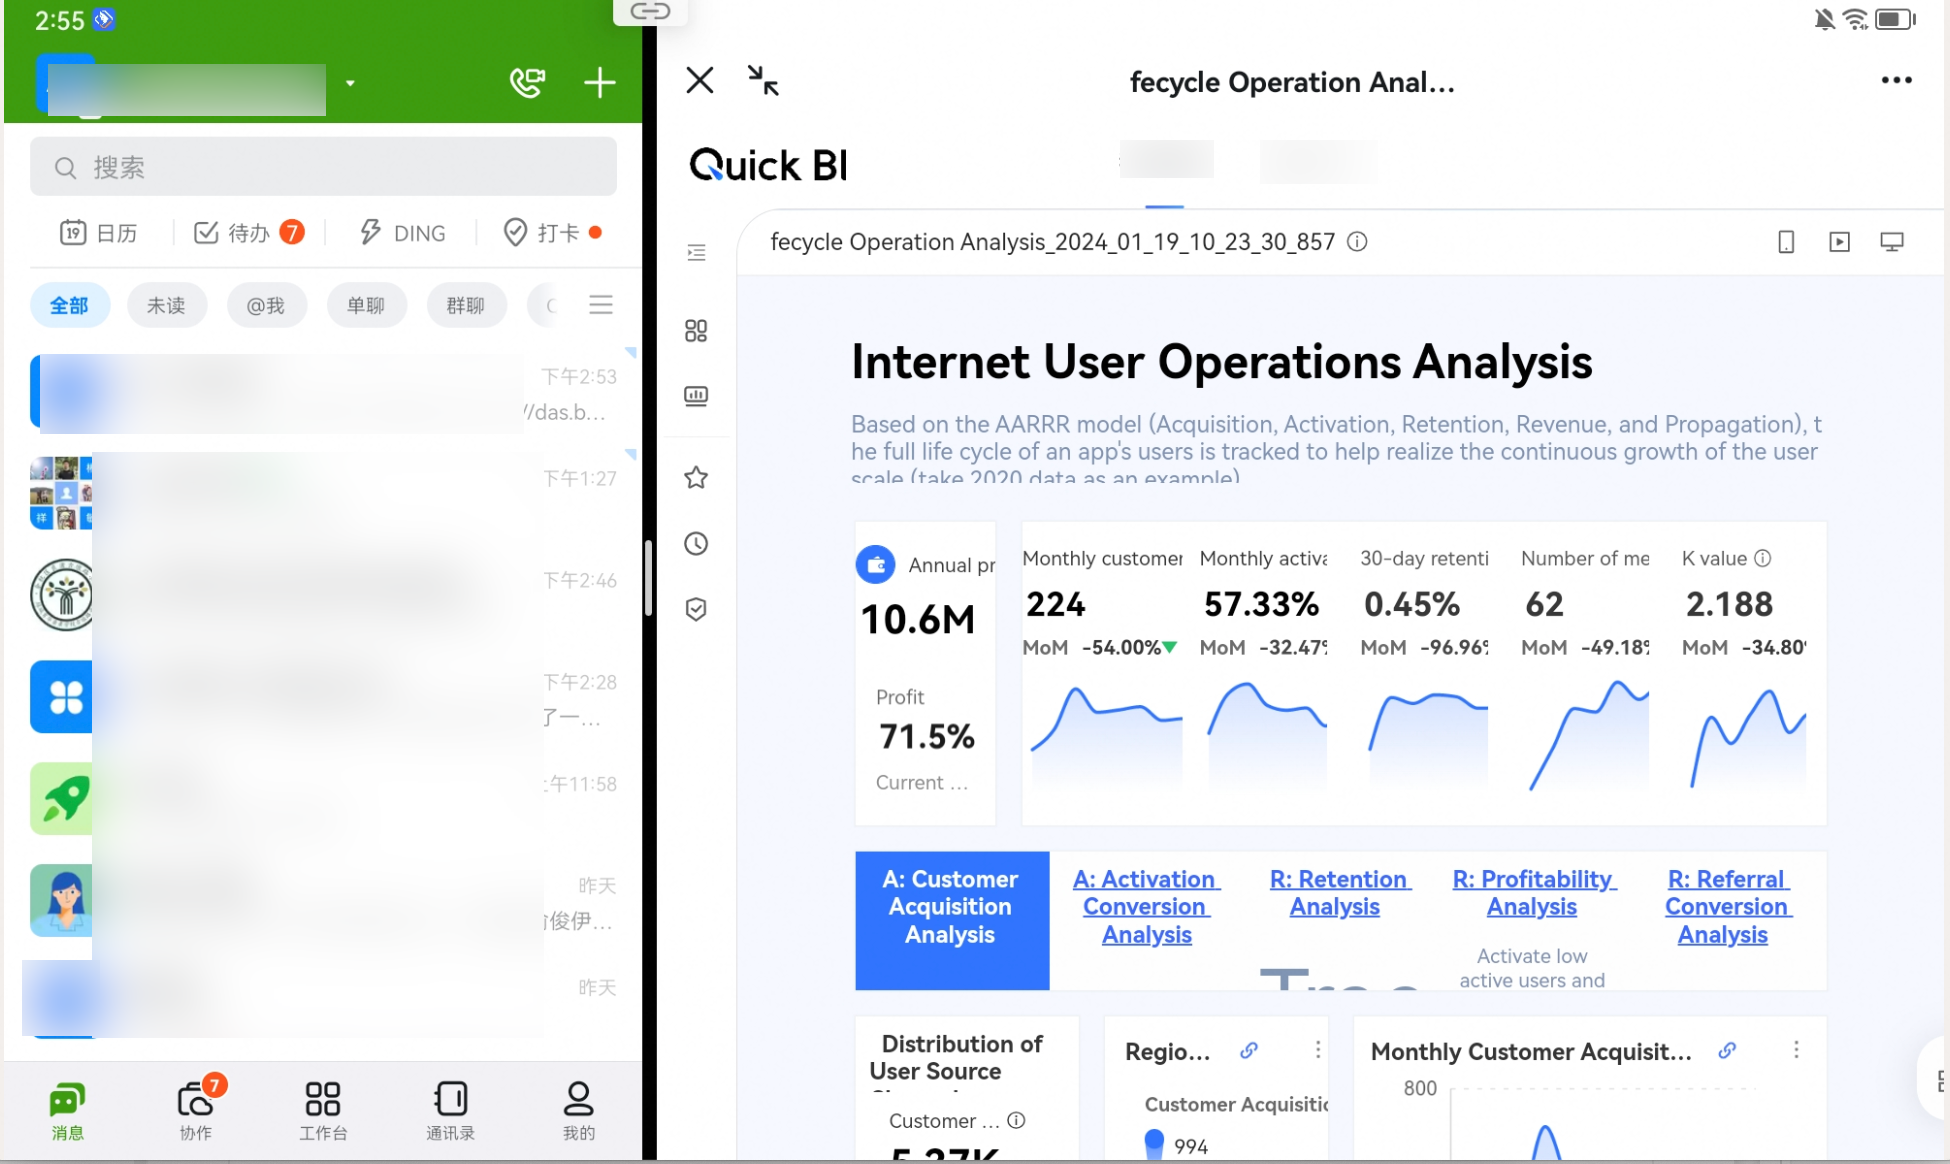
Open Report on WeCom/DingTalk/Lark/Micro App
Open the report link directly in the micro /DingTalk /flying book, or click on your target report in the micro application, and it will be displayed in the form of a side drawer. The following is an example of opening the report link in the DingTalk:
Click icon in the upper left corner
 to display the report in full screen.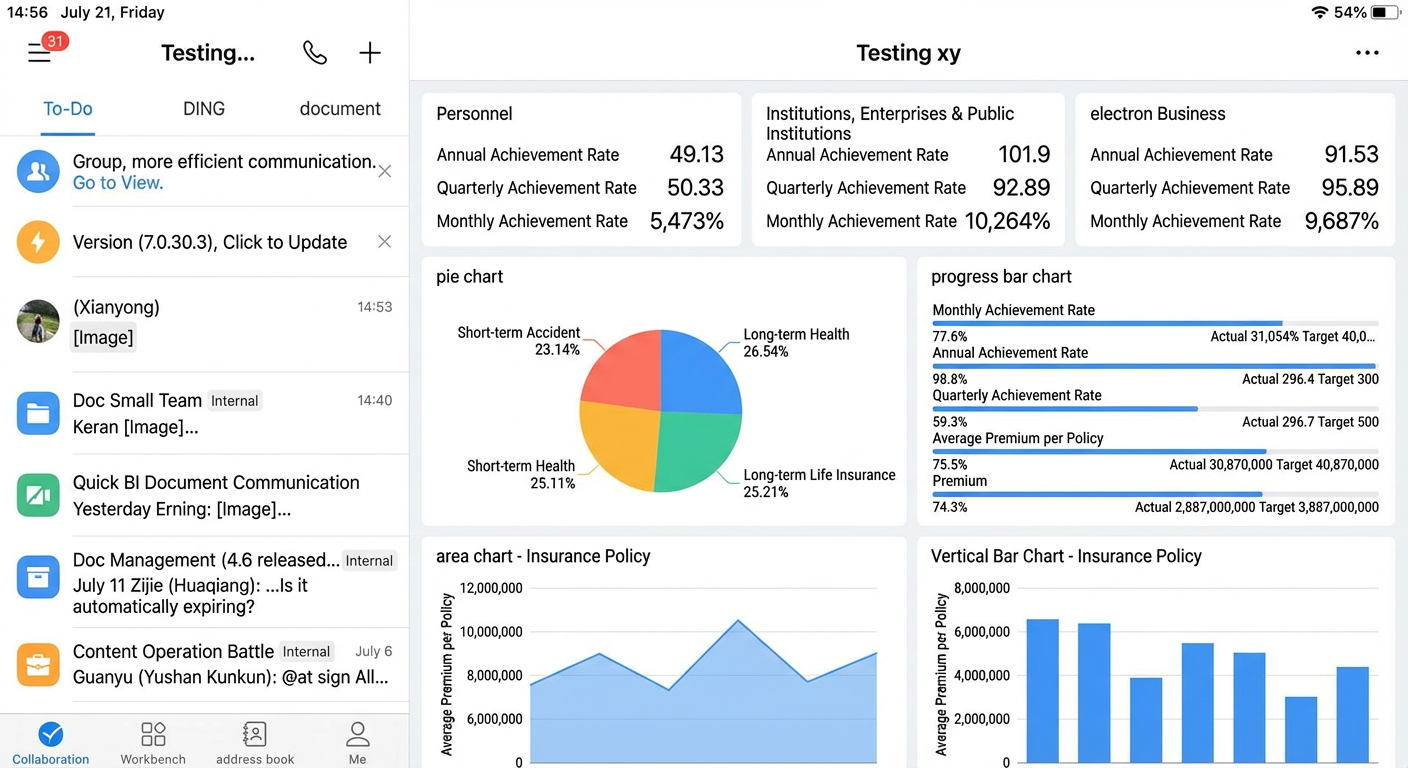
For more information about how to enable a microapp on a tablet, see Configure microapp navigation on a mobile device.
Tablet-side interactive operation
Tablet tooltip
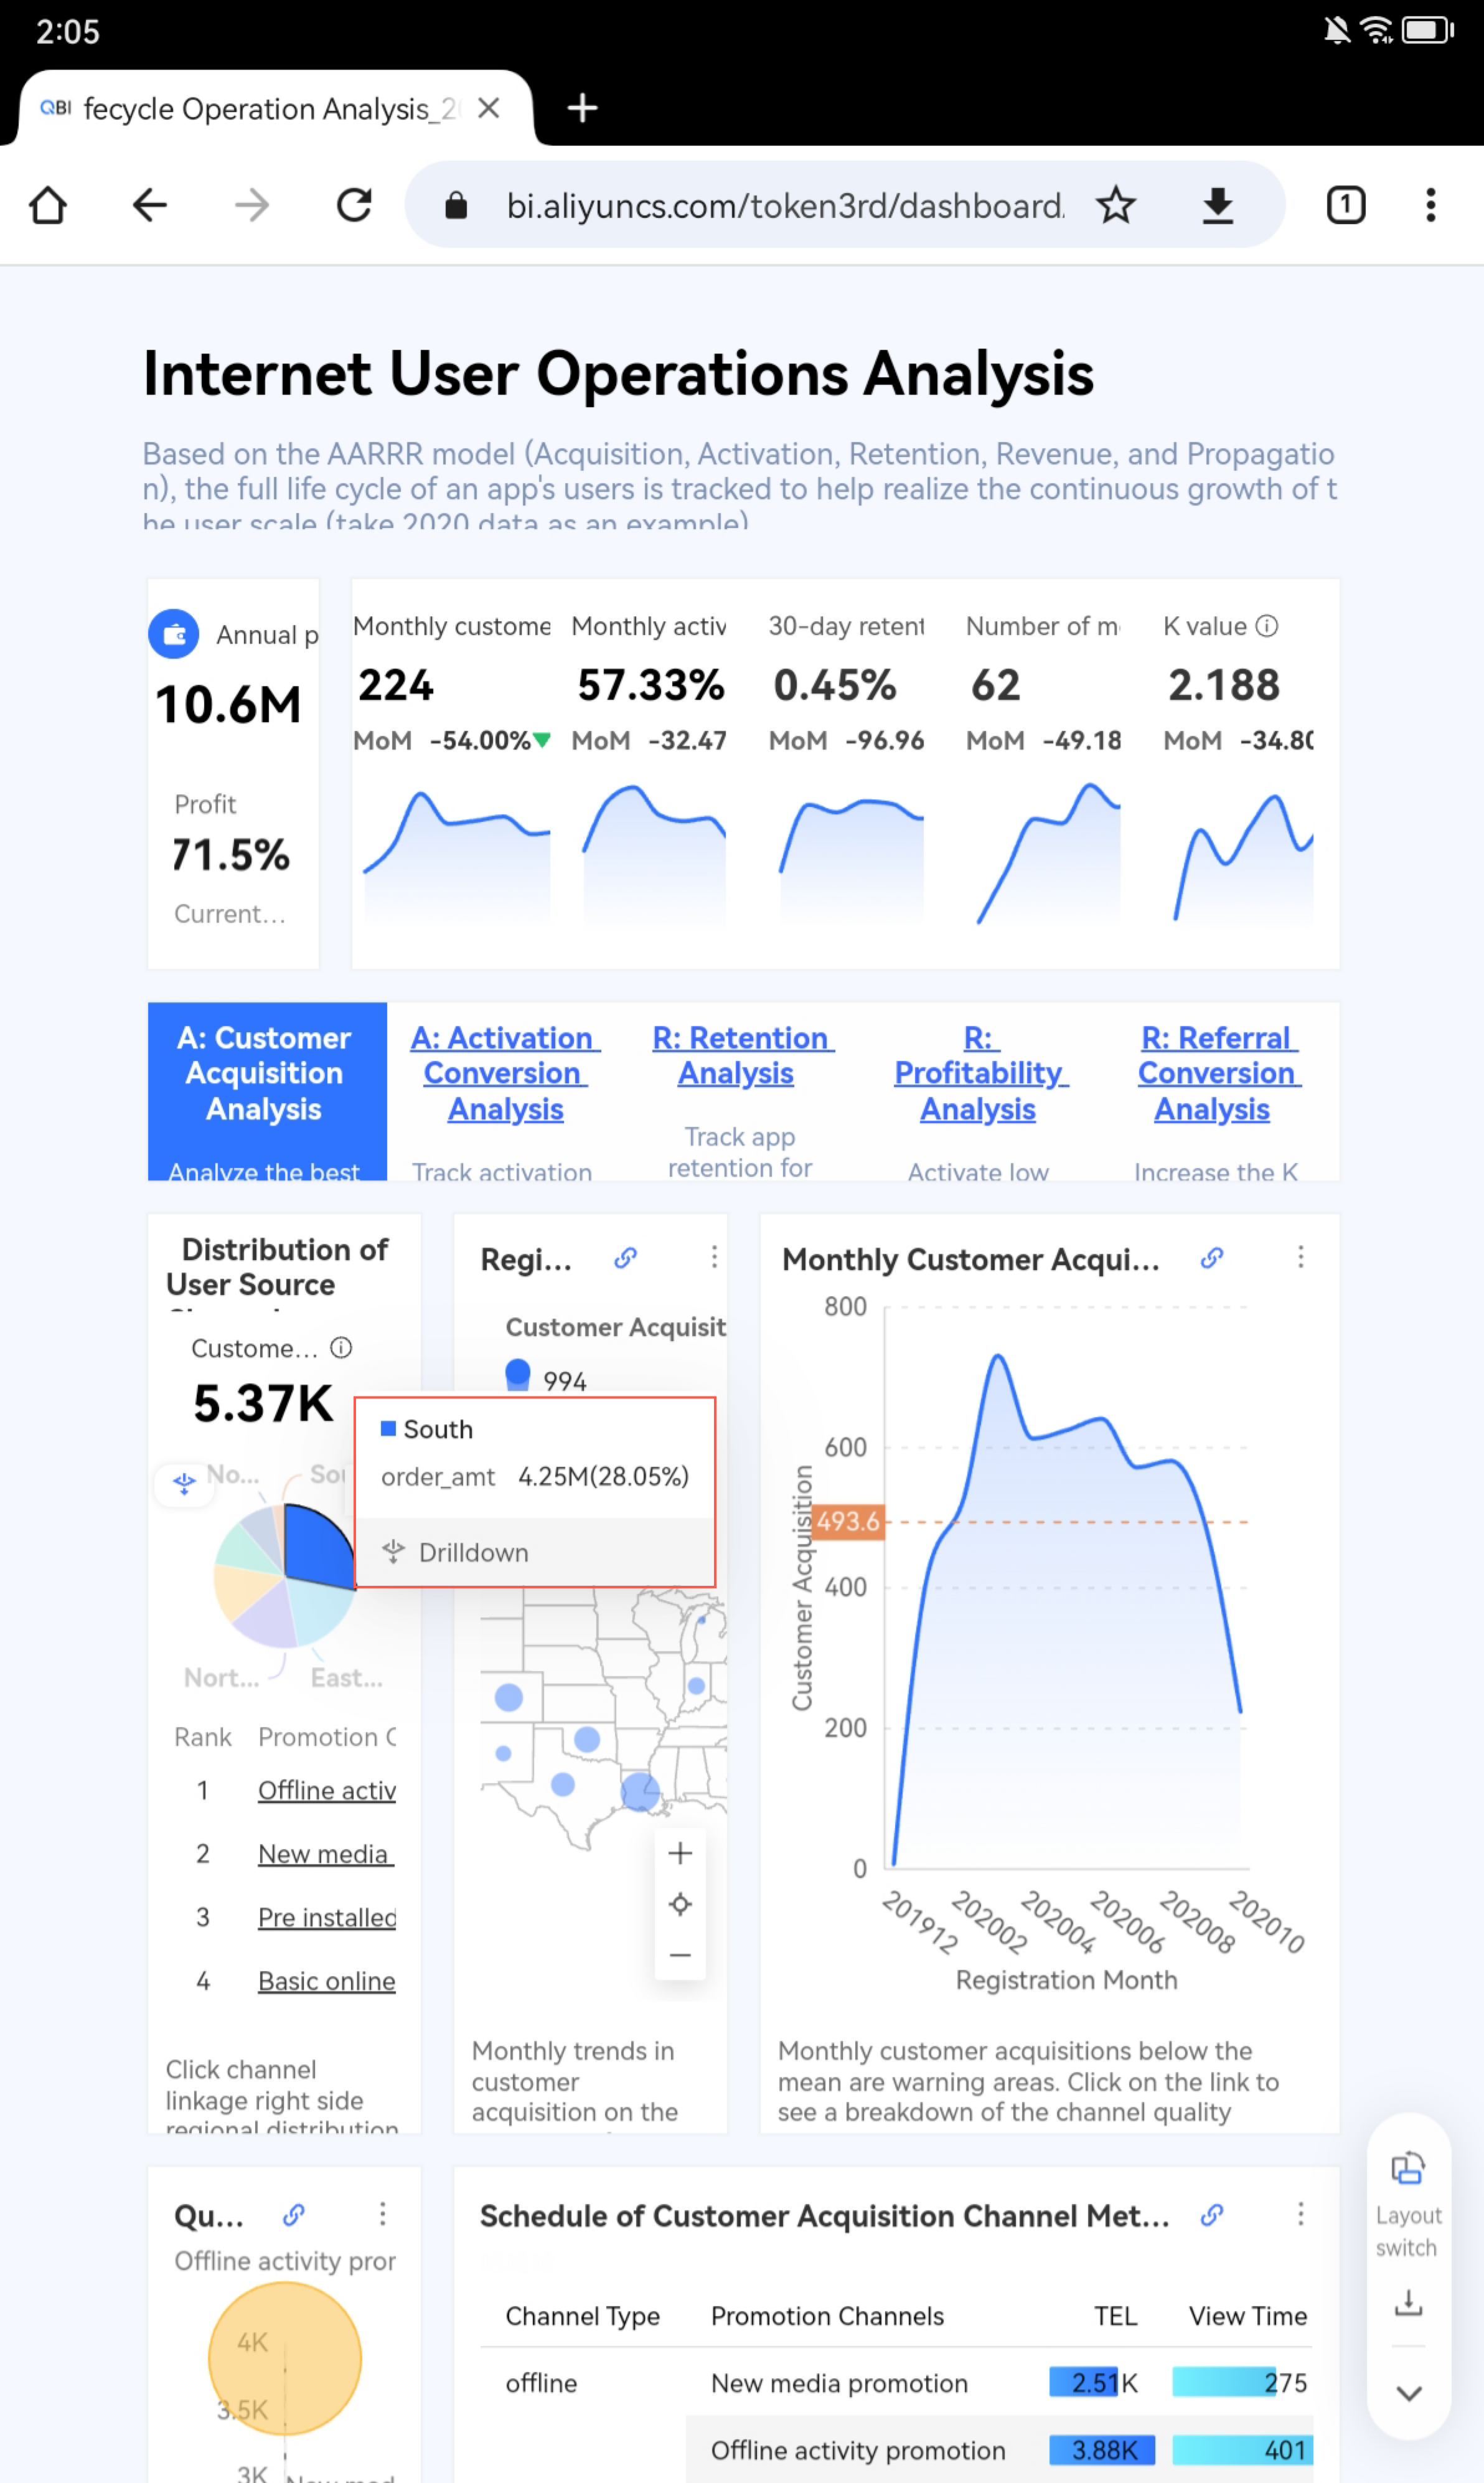
When you display a chart with a large amount of data in multiple dimensions on a tablet, it is difficult to quickly and clearly locate data in a dimension. To view data in a more efficient manner, the tooltip tablet feature can display the corresponding data in the tooltip based on the dimensions you select in the chart.
After you select a dimension value in the corresponding chart, the entire data area is highlighted and the tooltip box appears.

The default sequence of buttons is: drill down, linkage, and jump. You can manually configure the buttons in the background on the PC.
For more information, see Drillthrough, Linkage, and Jump.
Toolbar
Click icon in the lower-right corner  of the report. The Layout Switch, Export, and More features are displayed.
Layout switching
By default, the tablet-side report adopts the PC-side view. When the report is opened in the WeCom/DingTalk/Lark, it will be displayed in the form of a side drawer. At this time, the PC /mobile layout will be displayed according to the resolution width of the device drawer.
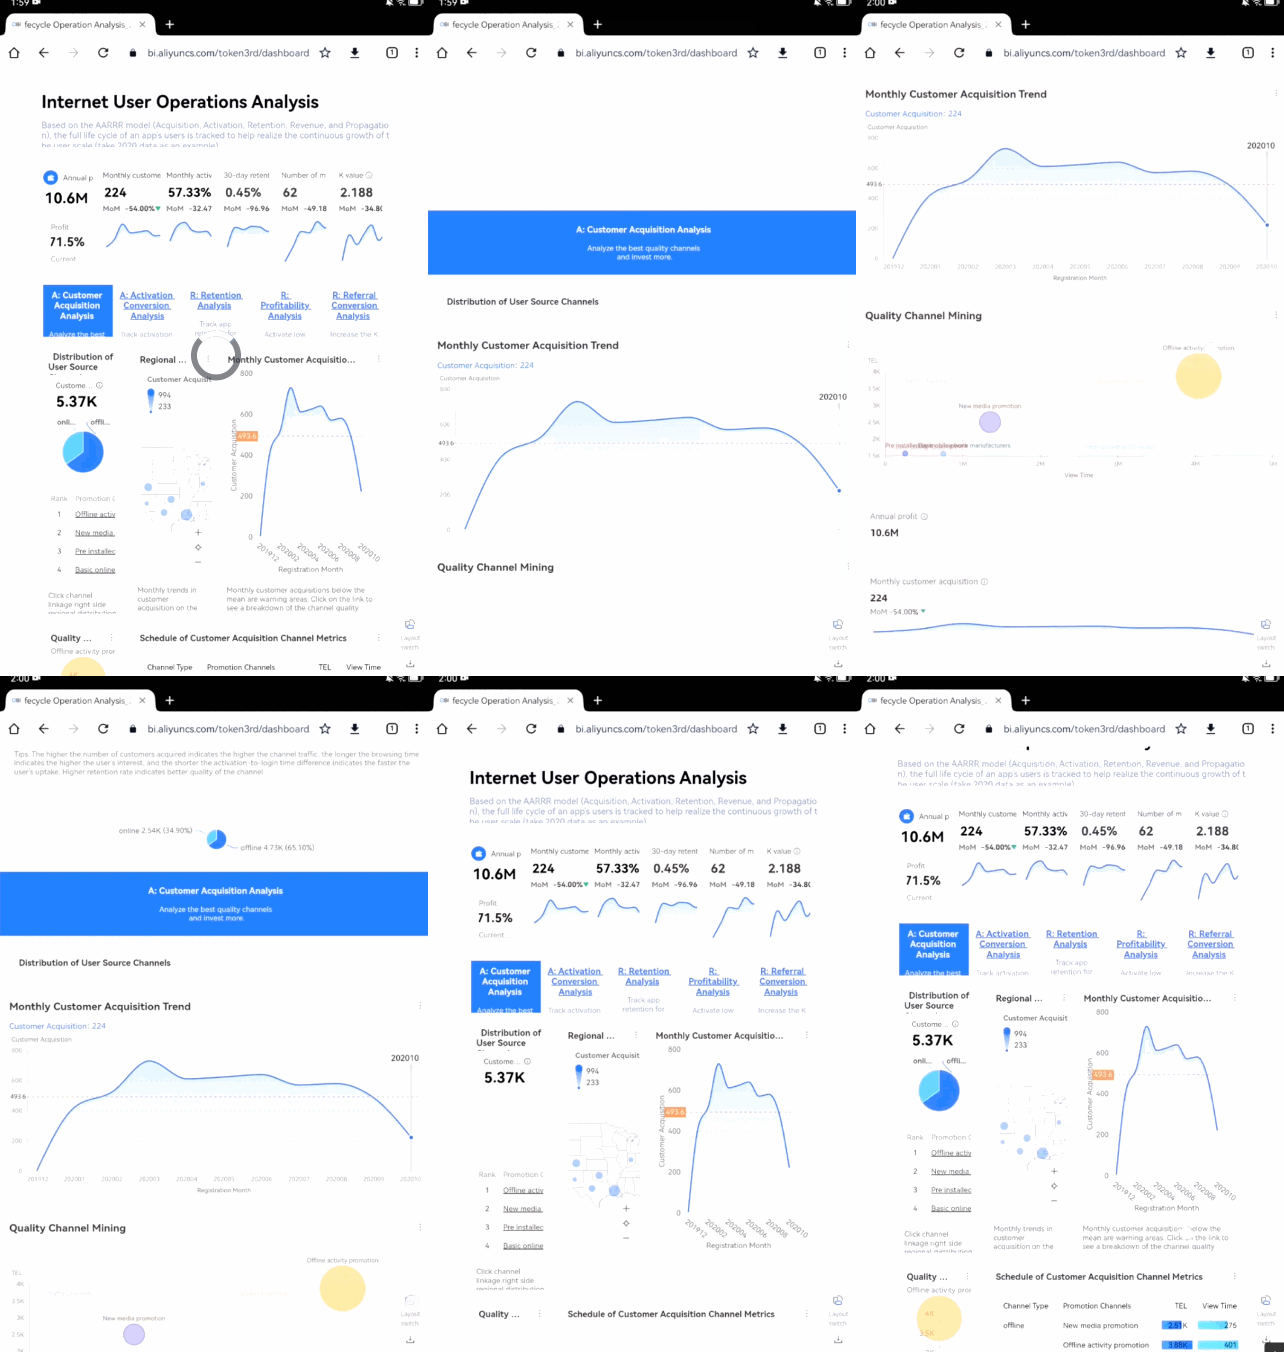
In addition, the layout and content display position are frequently changed due to different device resolutions and the switch between horizontal and vertical screen modes. If the default layout of the chart does not meet the requirements, you can click Switch Layout to switch between horizontal and vertical screen modes.
Split-screen mode
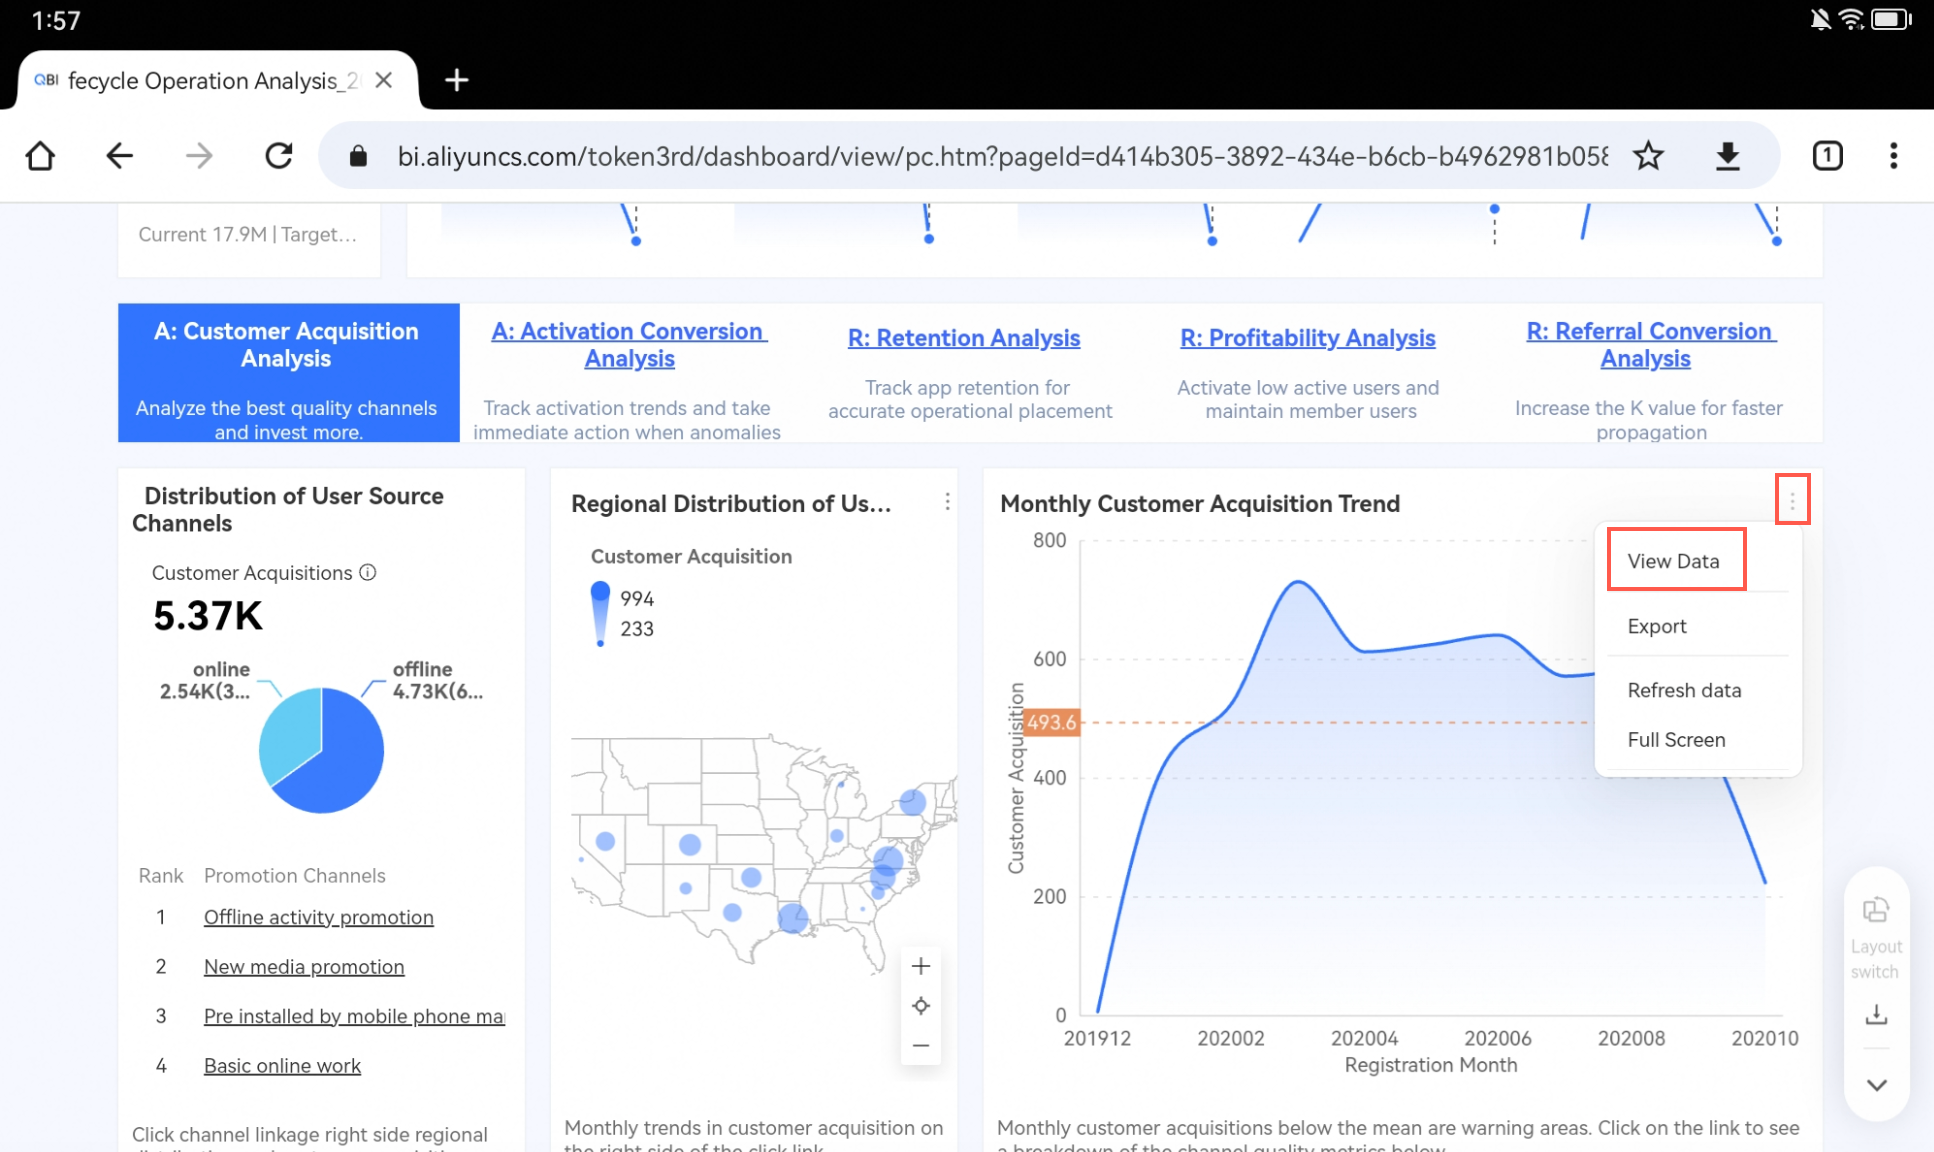
Select a chart and click View Data to enter the split-screen mode.
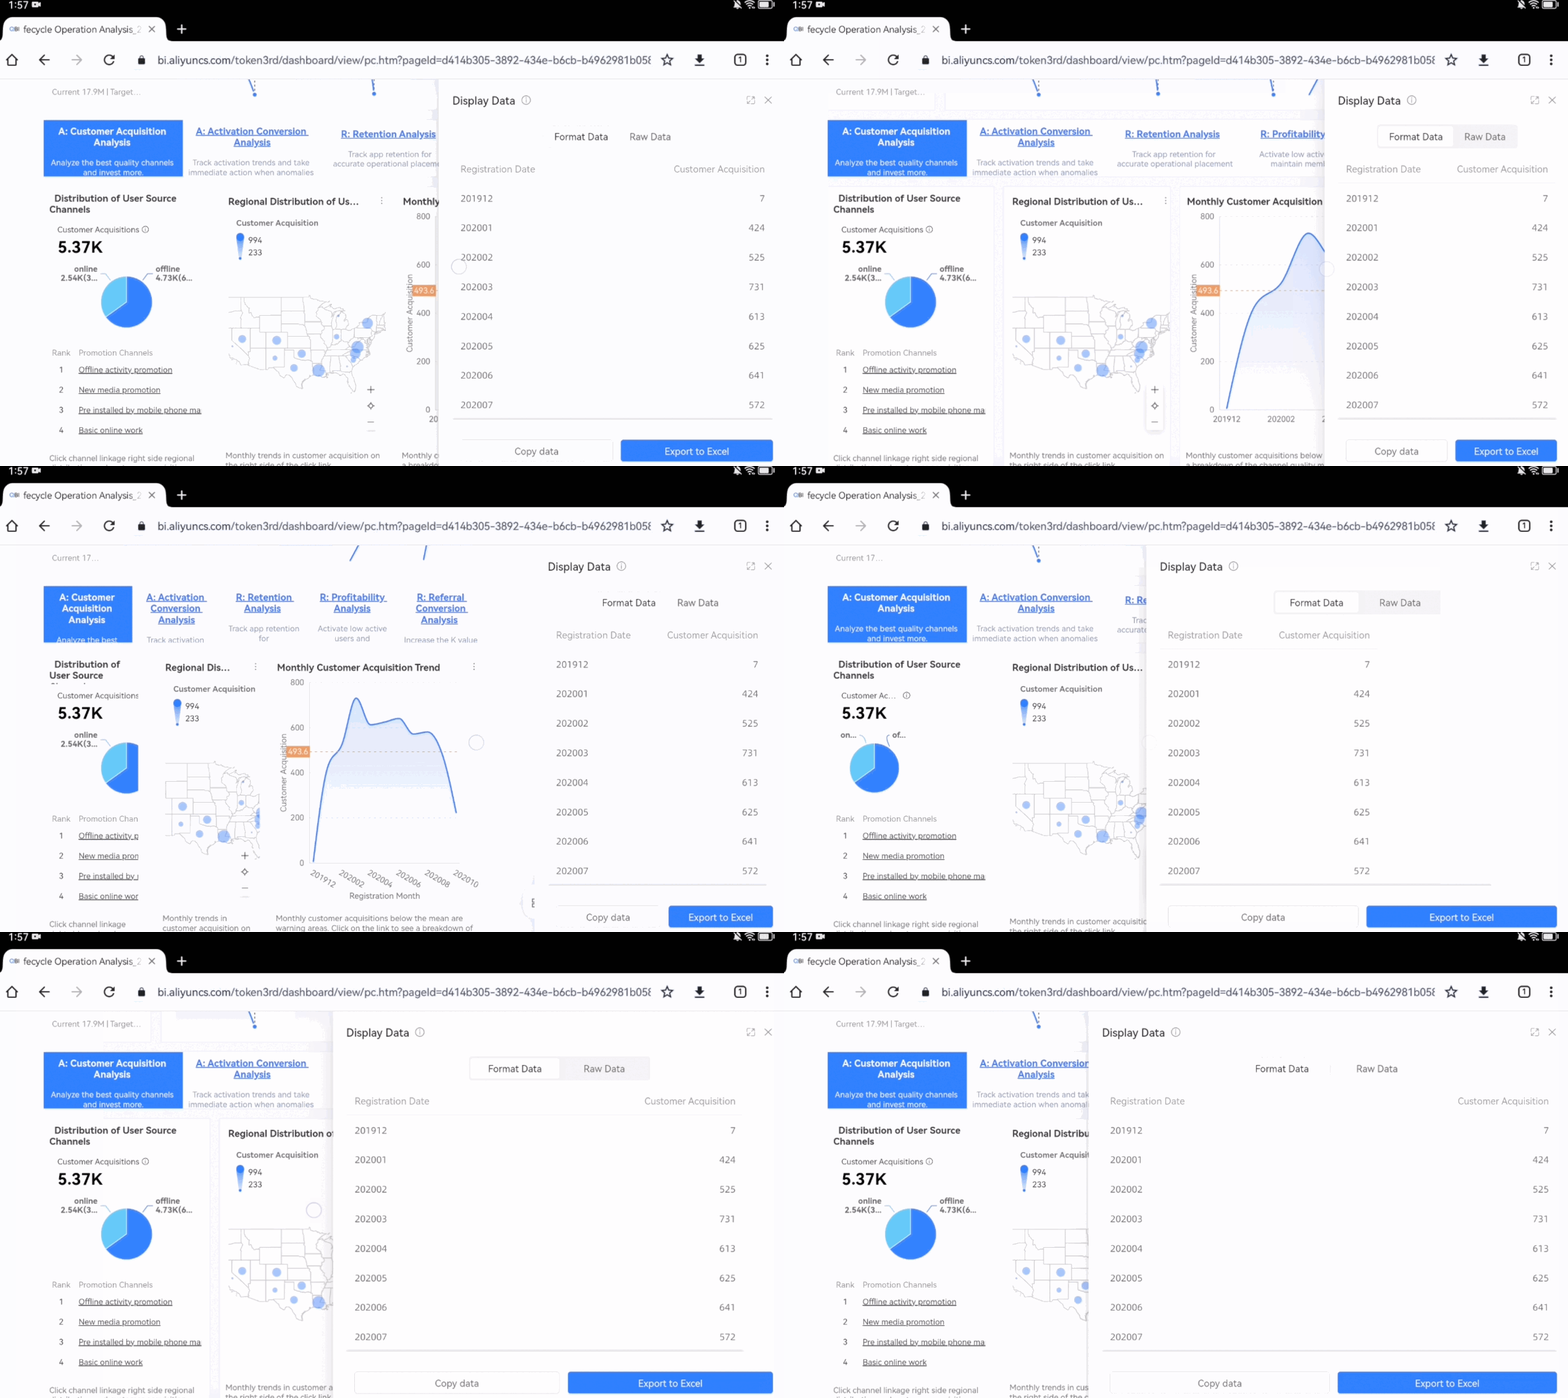
Long press the left side of the border to drag the window width.
Limits
By default, the tablet-side chart has the same capabilities as the PC-side chart in the PC view. If you switch to the mobile-side view, the supported features are as follows:
Feature | Chart name |
Gesture Zoom |
|
Drilling, linkage and redirection |
Note
|
Metric filtering |
|