Pie chart
This topic describes the style and configuration of the Pie Chart widget.
When you add a BI analysis widget in the canvas editor, an analyzer is automatically created above the BI widget in the layer bar. You must create a dataset before using the BI analysis widget. For more information, see Add a dataset and BI analyzer interactions.
Chart style
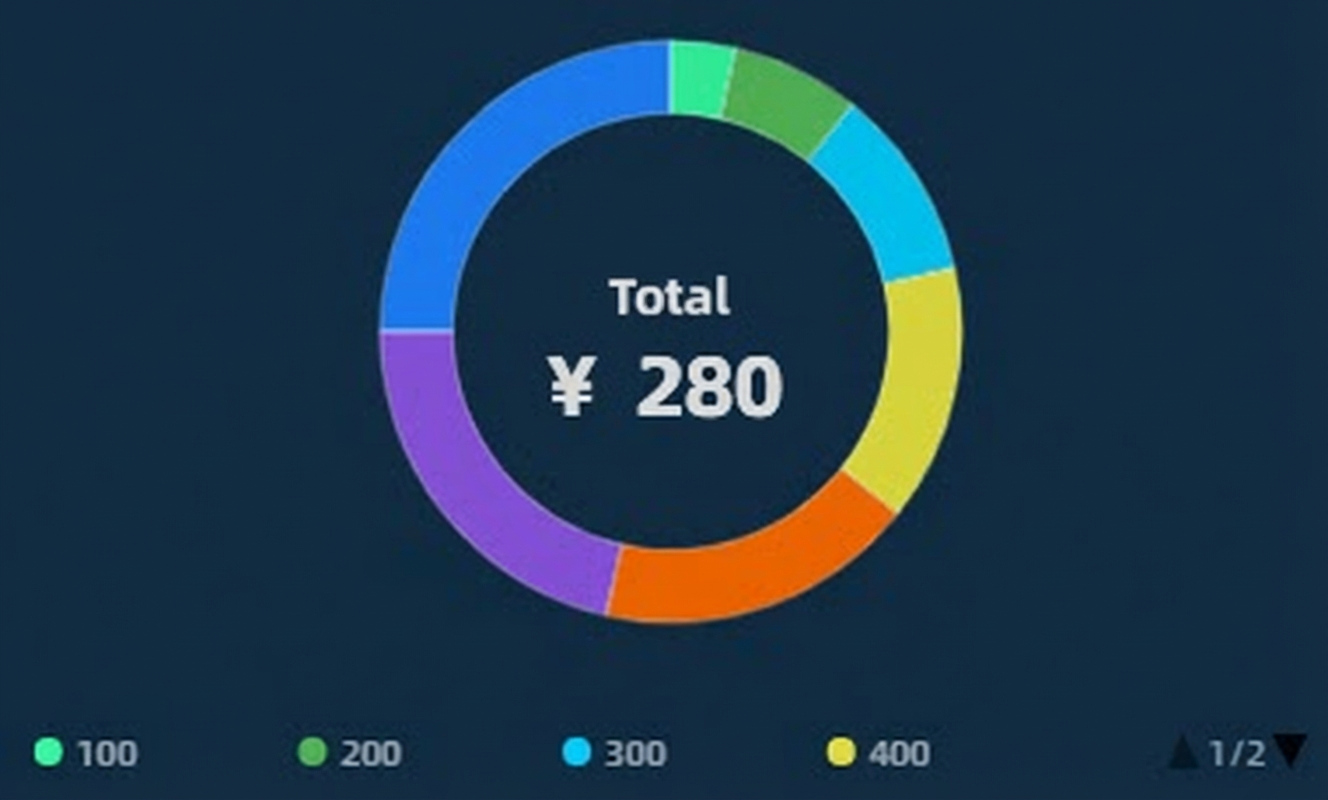
A pie chart divides a circle into segments to represent the proportion of different categories. The entire circle represents the total value of the data. Pie charts are widely used to show the percentage distribution of different categories. The arc length of each segment allows users to quickly compare and understand the data distribution.
Configuration panel
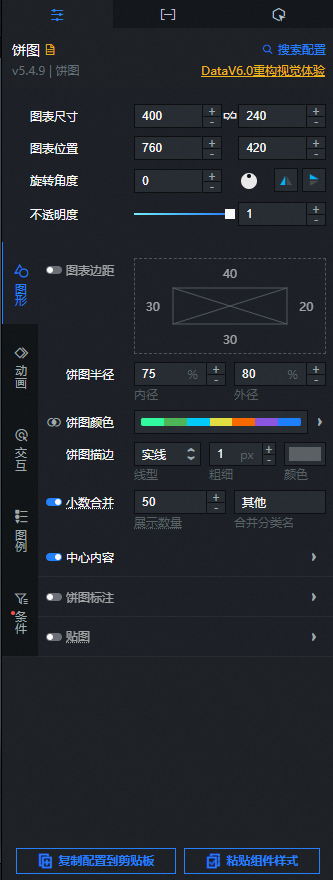
- Search for Configurations: In the right-side panel of Canvas Editor, click the Settings tab, and click Search for Configurations in the upper-right corner. Enter the required configuration item in the search box, and click the search icon to quickly locate the configuration item. Fuzzy match is supported. For more information, see Search for Configurations.
- Size: indicates the size of a widget, including its pixel width and height. You can click the
 icon to proportionally adjust the width and height of a widget. After you click this icon again, you can adjust the width and height as needed.
 - Position: the position of a widget, which is indicated by pixel X and Y coordinates. X-coordinate indicates the pixel distance between the upper-left corner of the widget and the left border of the canvas. Y-coordinate indicates the pixel distance between the upper-left corner of the widget and the upper border of the canvas.
- Rotation Angle: the angle of a rotation that uses the center point of a widget as the rotation point. The unit is degrees (°). You can use one of the following methods to control the rotation angle of a widget:
- Directly enter the degrees in the Rotation Angle spin box or click the plus sign (+) or minus sign (-) to increase or decrease the value in the Rotation Angle spin box.
- Drag the black dot in the
 icon.
icon. - Click the
 icon to horizontally flip a widget.
 - Click the
 icon to vertically flip a widget.
- Opacity: the opacity of a widget. Valid values: 0 and 1. If this parameter is set to 0, the widget is hidden. If this parameter is set to 1, the widget is completely displayed. Default value: 1.
Graphics
Parameter
Description
Chart Margin
Click the
icon to show or hide the chart margin settings. When enabled, you can set the distance between the pie chart area and the top, bottom, left, and right borders of the widget. The default unit is px.Pie Chart Radius
Sets the inner and outer radius of the pie chart as a percentage.
Pie Chart Color
Sets the color of the pie chart slices. For more information about how to configure mapping colors for different slices, see Use the color mapper.
Pie Chart Outline
Sets the outline style for the pie chart slices, including the line type, width, and color.
NoteIf you set the line type to Dashed or Dotted, you can also configure the dash length and the gap between dashes.
Decimal Merge
Limits the number of slices shown and merges the remaining slices into a single "other" slice. You can also set a custom category name for the merged slice. Click the
icon to enable or disable this feature.Center Text
Sets the text displayed in the center of the pie chart. This field is available only when the inner radius is greater than 0. Click the
icon to enable or disable the center text.Title: Sets the title of the center text.
Title Text: Sets the font family, weight, size, and color of the title.
Title Offset: Sets the horizontal and vertical offset of the title in pixels.
Value Format: Sets the display format for the numeric value in the center text.
Content Prefix and Suffix: Sets the prefix and suffix for the center text.
Content Text: Sets the font family, weight, size, and color of the content.
Content Offset: Sets the horizontal and vertical offset of the content in pixels.
Pie Chart Annotation
Sets the style of the pie chart annotations (labels). Click the
icon to show or hide the annotation settings.Annotation Format: Sets the format of the annotation content.
Format: Set to Default or Percentage.
Annotation Field: Sets the position of the annotation field. Options include Internal, External, and Spider.
Data Format: Sets the format for numeric values in annotations. Options include Default, 11 (Integer), 11.1 (Floating-point number), 11.11 (Floating-point number), 11% (Percentage), 11.1% (Percentage), 1,111 (Thousands separator), and 1,111.1 (Thousands separator). For more information about data display formats, see Data display formats. This option is available only when Default is selected for the annotation field.
Prefix and Suffix: Sets the prefix and suffix for the annotation content.
Annotation Leader Line: Sets the style of the leader lines for annotations. Click the
icon to show or hide the leader line settings.Width: Sets the width of the leader line. This is configurable only when Annotation Field is set to Spider or External.
Length: Sets the length of the leader line in pixels. This is configurable only when Annotation Field is set to Spider.
Text Style: Sets the font family, weight, size, and color of the annotation text.
Text Outline: Sets the outline style for the annotation text, including the outline width and color.
Pattern
Sets the pattern style for the pie slices. Click the
icon to show or hide the pattern settings.Type: Sets the pattern type. Options include Dot, Line, and Square.
Fill Style: Sets the fill style of the pattern. For more information, see Color picker to configure the pattern color.
Outline Style: Sets the outline style of the pattern. For more information, see Color picker to configure the pattern color. This option is available when the type is set to Dot or Square.
Extra Style: Sets other pattern styles, including Pattern Size, Pattern Spacing, Line Spacing, Rotation Angle, and an Is Interlaced switch.
Animation: Sets the animation effect for the pie chart.
Parameter
Description
Animation Switch
Turn on the switch to configure animation effects for the pie chart.
Animation Effect
Sets the animation effect type. The system provides several common animation effects, including Horizontal Grow, Vertical Grow, Slide In, Scale In, and Fade In. This is configurable only when animation is enabled.
Animation Duration
Sets the duration of the animation in milliseconds (ms). This is configurable only when animation is enabled.
Interaction: Sets the interaction effects for the pie chart widget.
Center Text: This option is available only when the inner radius in the Graphics section is greater than 0. Turn on the switch to enable interaction with the center text. Turn the switch off to disable it.
NoteWhen center text interaction is enabled, the tooltip is disabled.
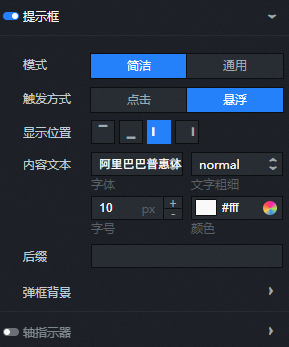
Tooltip: Configure the style of the tooltip that appears when you hover over or click a slice in Preview or Published mode. Click the
icon to enable or disable the tooltip.Parameter
Description
Mode
Sets the tooltip mode. Options include Simple and General.
Trigger Method
Sets how the tooltip is triggered. Options include Hover and Click.
Display Position
Sets the position where the tooltip appears. Options include Top, Bottom, Left, and Right.
Title Spacing
Sets the spacing between titles in the tooltip, in pixels.
Title Text
Sets the style of the title text in the tooltip, including font family, weight, size, and color.
Content Display
Click the
or icon on the right to add or delete a content series for the tooltip. Click the or icon to arrange multiple content series. Click the icon to copy the current content series configuration and add a new one with the same settings.Field Name: The field name for the tooltip content. This must match a field in the data panel.
Display Name: The display name for the tooltip content.
Suffix: The suffix for the tooltip content.
Content Spacing
Sets the spacing between content text items in the tooltip, in pixels.
Content Text
Sets the style of the content text in the tooltip, including font family, weight, size, and color.
Pop-up background
Sets the background style of the tooltip.
Background Margin: Sets the horizontal and vertical margin values for the tooltip background.
Background Color: Sets the background color of the tooltip.
Border Style: Sets the border style of the tooltip, including the line type, border radius, line width, and border color.
Axis Pointer
Sets the style of the axis pointer line in the tooltip, including the line type, width, and color.
NoteIf you set the line type to Dashed or Dotted, you can also configure the dash length and the gap between dashes.
Selected State: Configure the style for a slice when it is selected. Click the
icon to enable or disable the selected state style.Parameter
Description
Trigger Method
Sets how a slice is selected. Options include Hover and Click.
Selection Method
Sets the selection method for slices. Options include Single and Multiple.
Slice Color
Sets the color of a slice in its selected state.
Slice Outline
Sets the outline style for a slice, including the line type, width, and color.
NoteIf you set the line type to Dashed or Dotted, you can also configure the dash length and the gap between dashes.
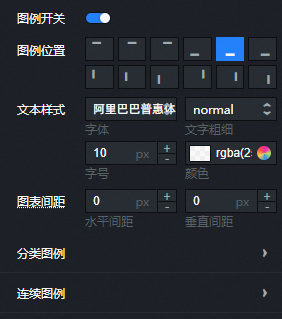
Legend: Sets the style of the pie chart legend.
Parameter
Description
Enable Legend
You can configure the legend style only if the switch is turned on.
Legend Position
Sets the position of the legend relative to the widget's coordinates. Options include Top Left, Top Center, Top Right, Bottom Left, Bottom Center, Bottom Right, Left Top, Left Center, Left Bottom, Right Top, Right Center, and Right Bottom.
Text Style
Sets the font family, weight, size, and color of the legend text.
Chart Spacing
Sets the horizontal and vertical spacing between the legend and the chart.
Categorical Legend
Sets the style for a categorical legend. The legend is displayed as a categorical legend only when the Graphics > Pie Chart Color > Mapping Type is set to Categorical.
Legend Marker: Sets the shape and size of the legend markers.
Legend Spacing: Sets the horizontal and vertical distance between different legend items.
Max Width: Sets the maximum width of the legend in pixels.
Allow Pagination: Turn on the switch to enable pagination for the legend. You can configure the page number and arrow styles for when the legend has too many items to display on one page. Turn off the switch to display all legend items on a single page.
Max Rows: Sets the maximum number of rows to display. If the number of items exceeds the maximum, the legend becomes paginated.
Page Number Style: Sets the style of the page numbers, including font, weight, size, and color.
Arrow Style: Sets the size and color of the pagination arrows for both default and disabled states.
Continuous Legend
Sets the style for a continuous legend. The legend is displayed as a continuous legend only when the Graphics > Pie Chart Color > Mapping Type is set to Continuous or Partitioned.
Slider Style
Type: Sets the type of the legend slider track. Options include Rectangle and Triangle.
Length: Sets the length of the legend slider track.
Height: Sets the height of the legend slider track.
Background Color: Sets the background color of the legend slider track.
Handle Style: Sets the style of the handles on the legend slider.
Minimum: Sets the minimum value for the slider. You can enter a custom value or select Auto to use the minimum value from the data.
Maximum: Sets the maximum value for the slider. You can enter a custom value or select Auto to use the maximum value from the data.
Size: Sets the size of the slider handles.
Color: Sets the color of the slider handles.
Annotation Style: Sets the style of the text labels on the legend.
Alignment: Sets the alignment of the legend text labels relative to the slider track. Options include Top, Center, and Bottom.
Spacing: Sets the distance between the legend text labels and the slider track.
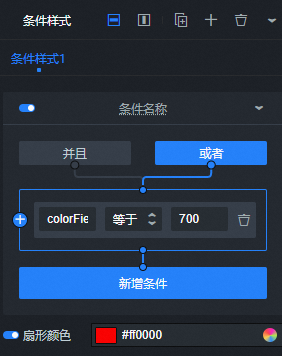
Condition: Sets conditional styles.
Conditional Style: Click the
icon to add a conditional style or the icon to delete one. You can click the or icon to arrange multiple conditional styles. To copy the current conditional style configuration and add a new one with the same settings, click the icon. For more information, see Use the condition tree.Slice Color: Turn on the switch to configure the color of pie slices for the conditional style. Turn it off to disable the configuration.
 icon to vertically flip a widget.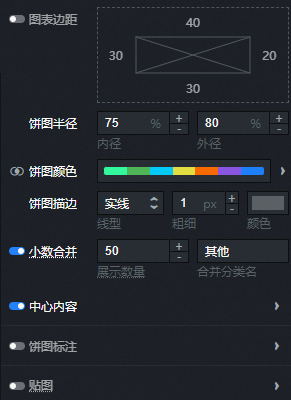
 icon to show or hide the chart margin settings. When enabled, you can set the distance between the pie chart area and the top, bottom, left, and right borders of the widget. The default unit is px.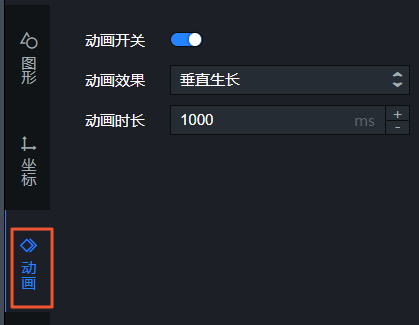
 or
or  icon on the right to add or delete a content series for the tooltip. Click the
  or
or  icon to arrange multiple content series. Click the
  icon to copy the current content series configuration and add a new one with the same settings.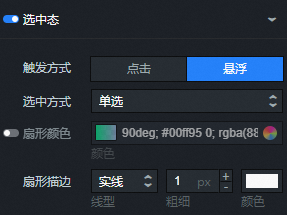
Data panel (Default mode)
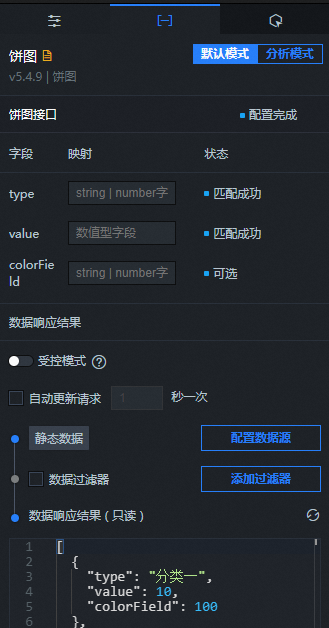
Field configuration
Field |
Description |
|
Configures the category for each slice in the pie chart. |
|
Configures the numeric value for each slice in the pie chart. |
|
(Optional) The color mapping field. Used to set the color mapping styles for the slices. |
Table 1. Parameters
| Parameter | Description |
| Controlled Mode | If you turn on the switch, data is not requested when a widget is initialized. Data requests are triggered only based on callback IDs or the method configured in Blueprint Editor. If you turn off the switch, data requests are automatically triggered. By default, the switch is turned off. |
| Auto Data Request | After you select the Auto Data Request check box, you can enable dynamic polling, and manually specify the polling interval. If you do not select this check box, data is not automatically requested. You must manually refresh the page to request data or use Blueprint Editor or callback ID events to trigger data requests. |
| Data Source | In the right-side panel of Canvas Editor, click the Data tab. Click Set next to Static Data. In the Configure Datasource panel, select a data source from the Data Source Type drop-down list. Enter code for data query in the code editor, click Preview Data Response to preview the response of the data source, and then view the response. For more information, see Configure asset data. |
| Data Filter | If you select the Data Filter check box, you can convert the data structure, filter data, and perform simple calculations. If you click the plus sign (+) next to Add Filter, you can configure the script for the data filter in the editor that appears. For more information, see Use the data filter. |
| Data Response Result | The response to a data request. If the data source changes, you can click the  icon next to Data Response Result to view the data response in real time. icon next to Data Response Result to view the data response in real time. |
Data panel (Analysis mode)
Before you can use the BI analysis feature with DataV datasets, the system makes the following changes to the pie chart:
The Pie Chart API data source is switched from static data to a DataV dataset.
The DataV dataset configuration is updated. This operation does not cause any loss of field configurations.
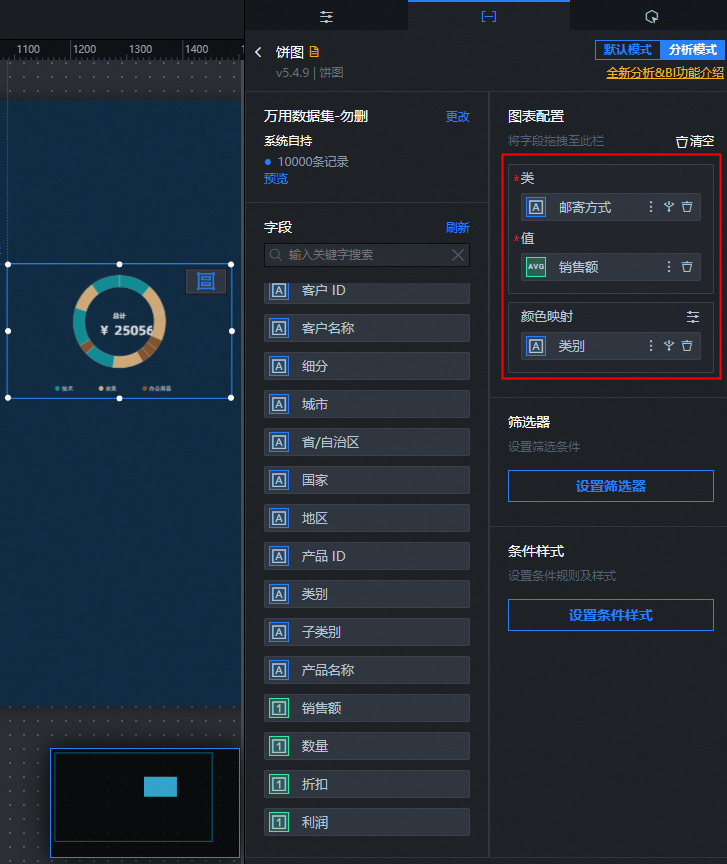
For more information about operations in the BI analysis data panel, see BI analysis mode data panel.
Field configuration
Field |
Description |
|
Configures the category for each slice in the pie chart. |
|
Configures the numeric value for each slice in the pie chart. |
|
(Optional) The color mapping field. Used to set the color mapping styles for the slices. |
For widgets added through the BI analysis module, the data panel defaults to Analysis mode. For v5.x widgets not under BI analysis, the data panel defaults to Default mode. If a widget is in Analysis mode, you can click Default Mode in the upper-left corner of the data panel. In the dialog box that appears, confirm the action to exit Analysis mode and delete the corresponding analyzer for the BI analysis widget. After you exit Analysis mode, the BI analysis widget is converted to a v5.x widget, and its data panel switches to Default mode.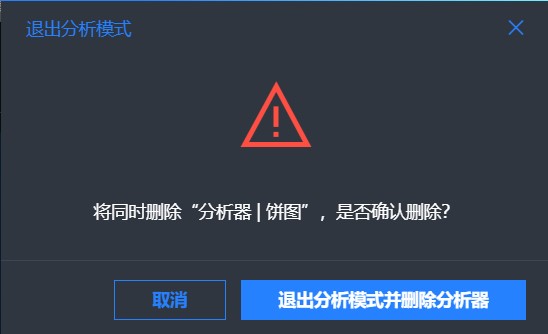
Interaction panel
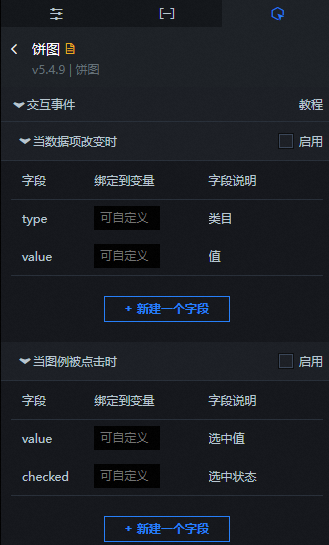
Interaction description
Interaction |
Description |
When a data item changes |
Select Enable to turn on the widget's interaction feature. The Pie Chart widget has an interaction configuration that throws a callback value when a data item changes. By default, it throws the `type` and `value` fields from the data. For more information, see Configure a callback ID for a ticker board widget. |
When a legend item is clicked |
Select Enable to turn on the widget's interaction feature. The Pie Chart widget has an interaction configuration that throws a callback value when a legend item is clicked. By default, it throws the `value` and `checked` fields from the data. For more information, see Configure a callback ID for a ticker board widget. |
Blueprint editor interaction configuration
You cannot configure blueprint editor interactions for a pie chart widget in Analysis mode. You can only configure blueprints in Default mode.
- In Canvas Editor, right-click a widget in the Layer panel and select Add to Blueprint Editor.
- Click the icon in the upper-left corner of the page.
On the blueprint editor configuration page, click the Pie Chart widget in the Imported Nodes pane. The configuration parameters for the pie chart are shown on the canvas.
Events
Event
Description
On Pie Chart API Request Completion
This event is triggered when the data API request is successfully returned and processed by the filter. This event provides the processed data in JSON format. For an example of the data structure, see the Data Response section on the Data tab of the widget's configuration panel in the canvas editor.
When the pie chart API request fails
This event is triggered when the data API request fails because of a network issue or an API error. This event provides the processed data in JSON format. For an example of the data structure, see the Data Response section on the Data tab of the widget's configuration panel in the canvas editor.
When a data item changes
This event is triggered when the data for a pie chart slice changes. This event provides the corresponding data item for that slice.
When a legend item is clicked
This event is triggered when a pie chart legend item is clicked. This event provides the corresponding data item for that slice.
Actions
Action
Description
Request pie chart API
Re-requests server-side data. Data thrown by upstream data processing nodes or layer nodes is used as parameters. For example, if the pie chart's API data source is set to
https://api.testand the data passed to the Request pie chart API action is{ id: '1'}, the final API request will behttps://api.test?id=1.Import pie chart API
Processes data according to the widget's drawing format and then imports it to redraw the widget. This does not require re-requesting server-side data. For a data example, see the Data Response section on the Data tab of the widget's configuration panel in the canvas editor.
Highlight
Highlights the element corresponding to a data item. The following code provides a data example.
return {
  "data": {
    "x": data.x, // The data item to highlight
    "colorField": data.colorField
  },
  "style": {
    "fillStyle": "#f00" // The fill color
  }
}
Reset selections
Clears and resets the widget's selected items. No parameters are required.
Update widget configuration
Dynamically updates the widget's style configuration. First, in the widget's Configuration panel, click Copy Configuration to Clipboard to get the widget's configuration data. Then, change the field values for the corresponding styles in a data processing node on the blueprint editor page as needed.
Show
Shows the widget. The following code provides a data example.
return{
  "animationType": "",
  "animationDuration": 1000,
  "animationEasing": "linear"
}
Hide
Hides the widget. The following code provides a data example.
return{
  "animationType": "",
  "animationDuration": 1000,
  "animationEasing": "linear"
}
Toggle visibility
Toggles the visibility of the widget. The following code provides a data example.
return {
  "animationIn": {
    "animationType": "",
    "animationDuration": 1000,
    "animationEasing": "linear"
  },
  "animationOut": {
    "animationType": "",
    "animationDuration": 1000,
    "animationEasing": "linear"
  }
}
Move
Moves the widget to a specified position. The following code provides a data example.
    return{
      // Movement type. Absolute positioning: to. Relative positioning: by. Default: to.
        "positionType": "to",
      // Specified position. x-coordinate, y-coordinate.
      "attr": {
        "x": 0,
        "y": 0
      },
      // Animation method.
      "animation": {
        "enable": false,
        // Animation duration.
        "animationDuration": 1000,
        // Animation curve. Options: linear|easeInOutQuad|easeInOutExpo.
        "animationEasing": "linear"
      }
    }
 icon in the upper-left corner of the page.