Create a workbook
This topic describes how to create a workbook. You can create workbooks only in group workspaces of Quick BI Pro and Quick BI Enterprise Standard.
Prerequisites
You have created a dataset. For more information, see Create a dataset.
Methods for creating a workbook
Log on to the Quick BI console. On the Workbench, you can create a workbook from one of the following entry points.
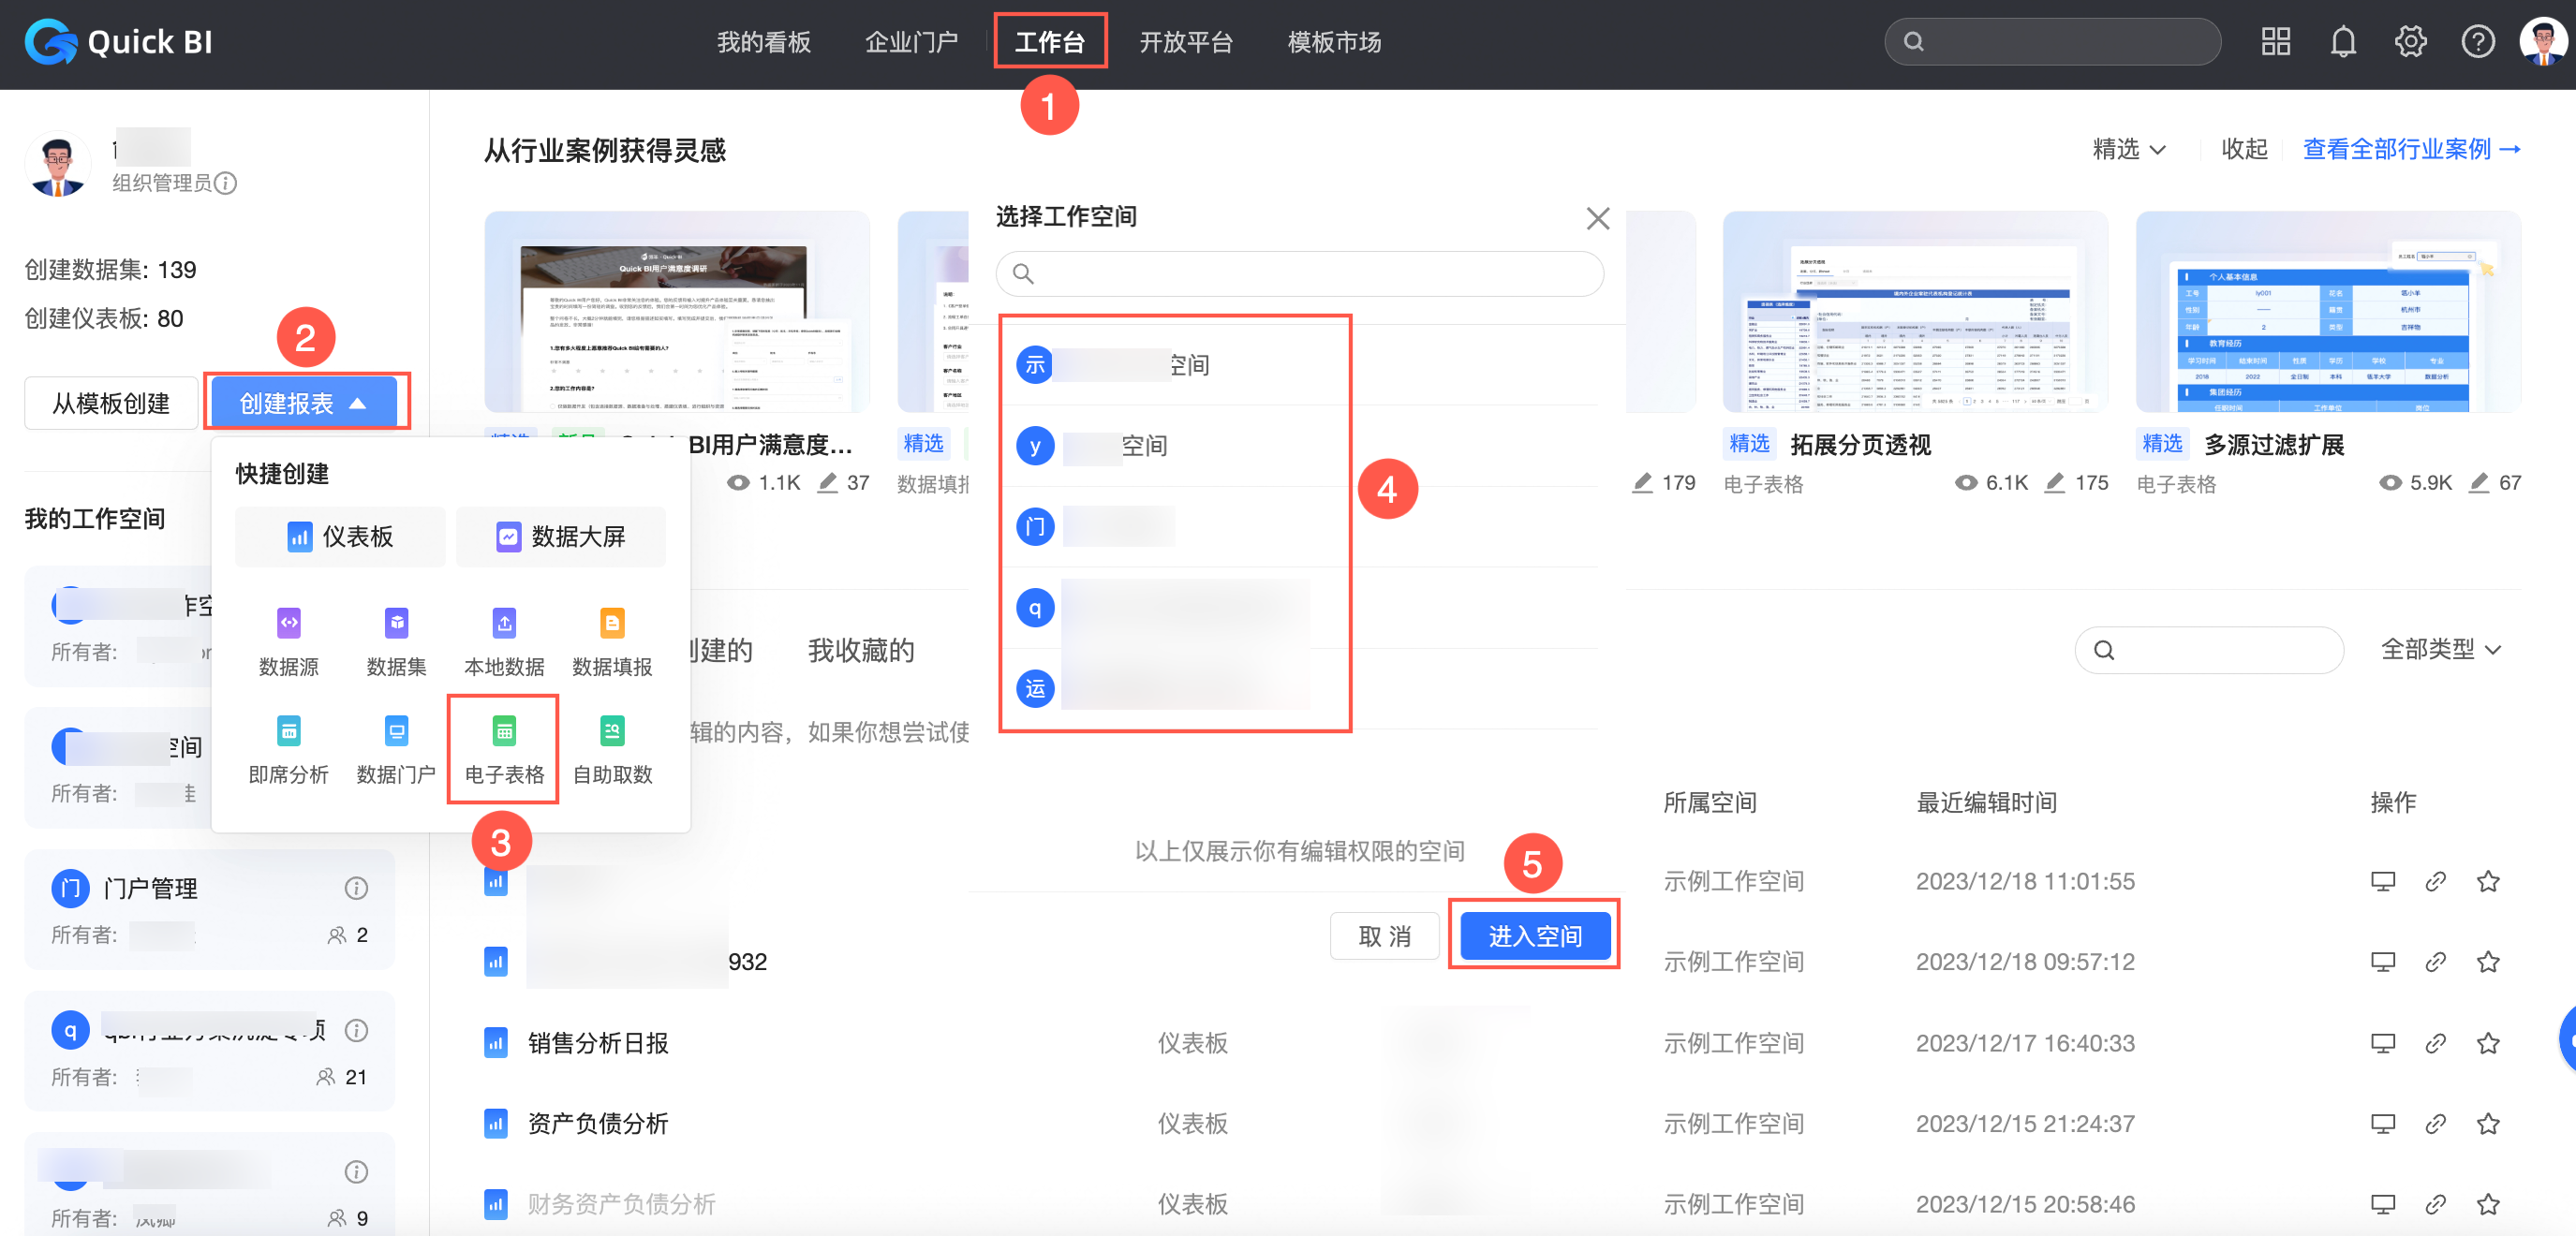
Method 1: Create a workbook from Quick Start on the Workbench tab out of a workspace.
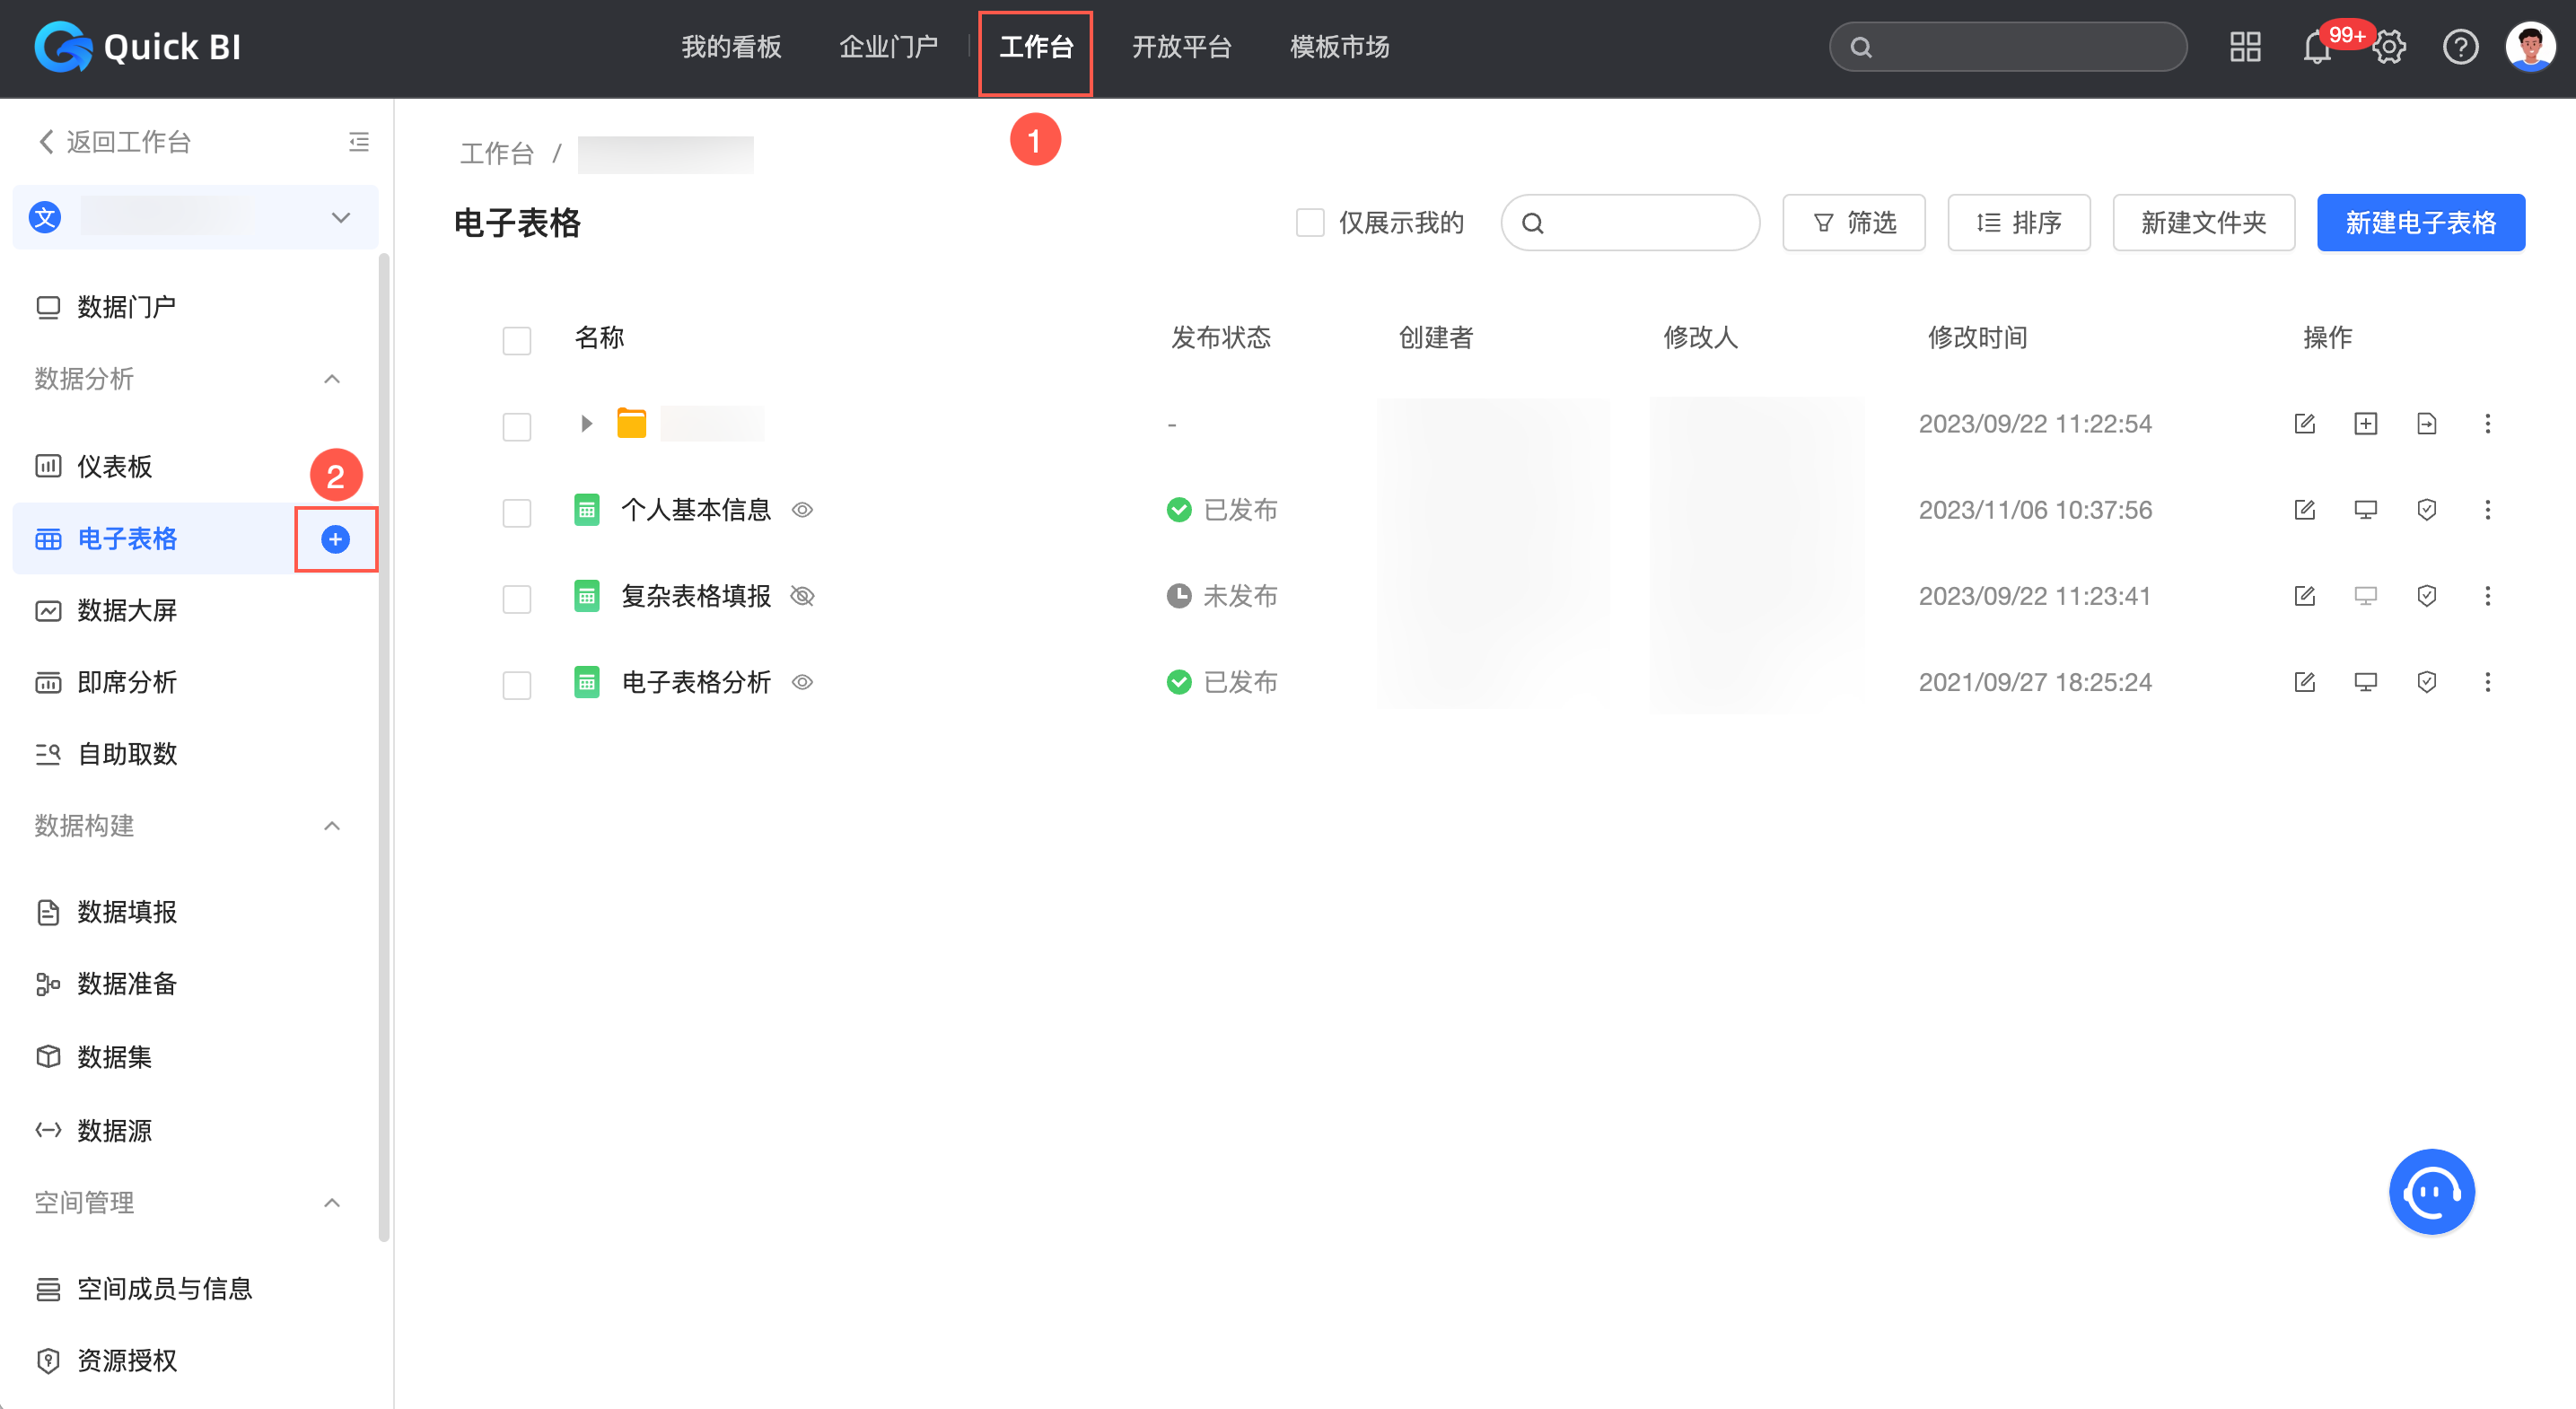
Method 2: Create a workbook in the left-side navigation pane of the Workbench tab in a workspace.
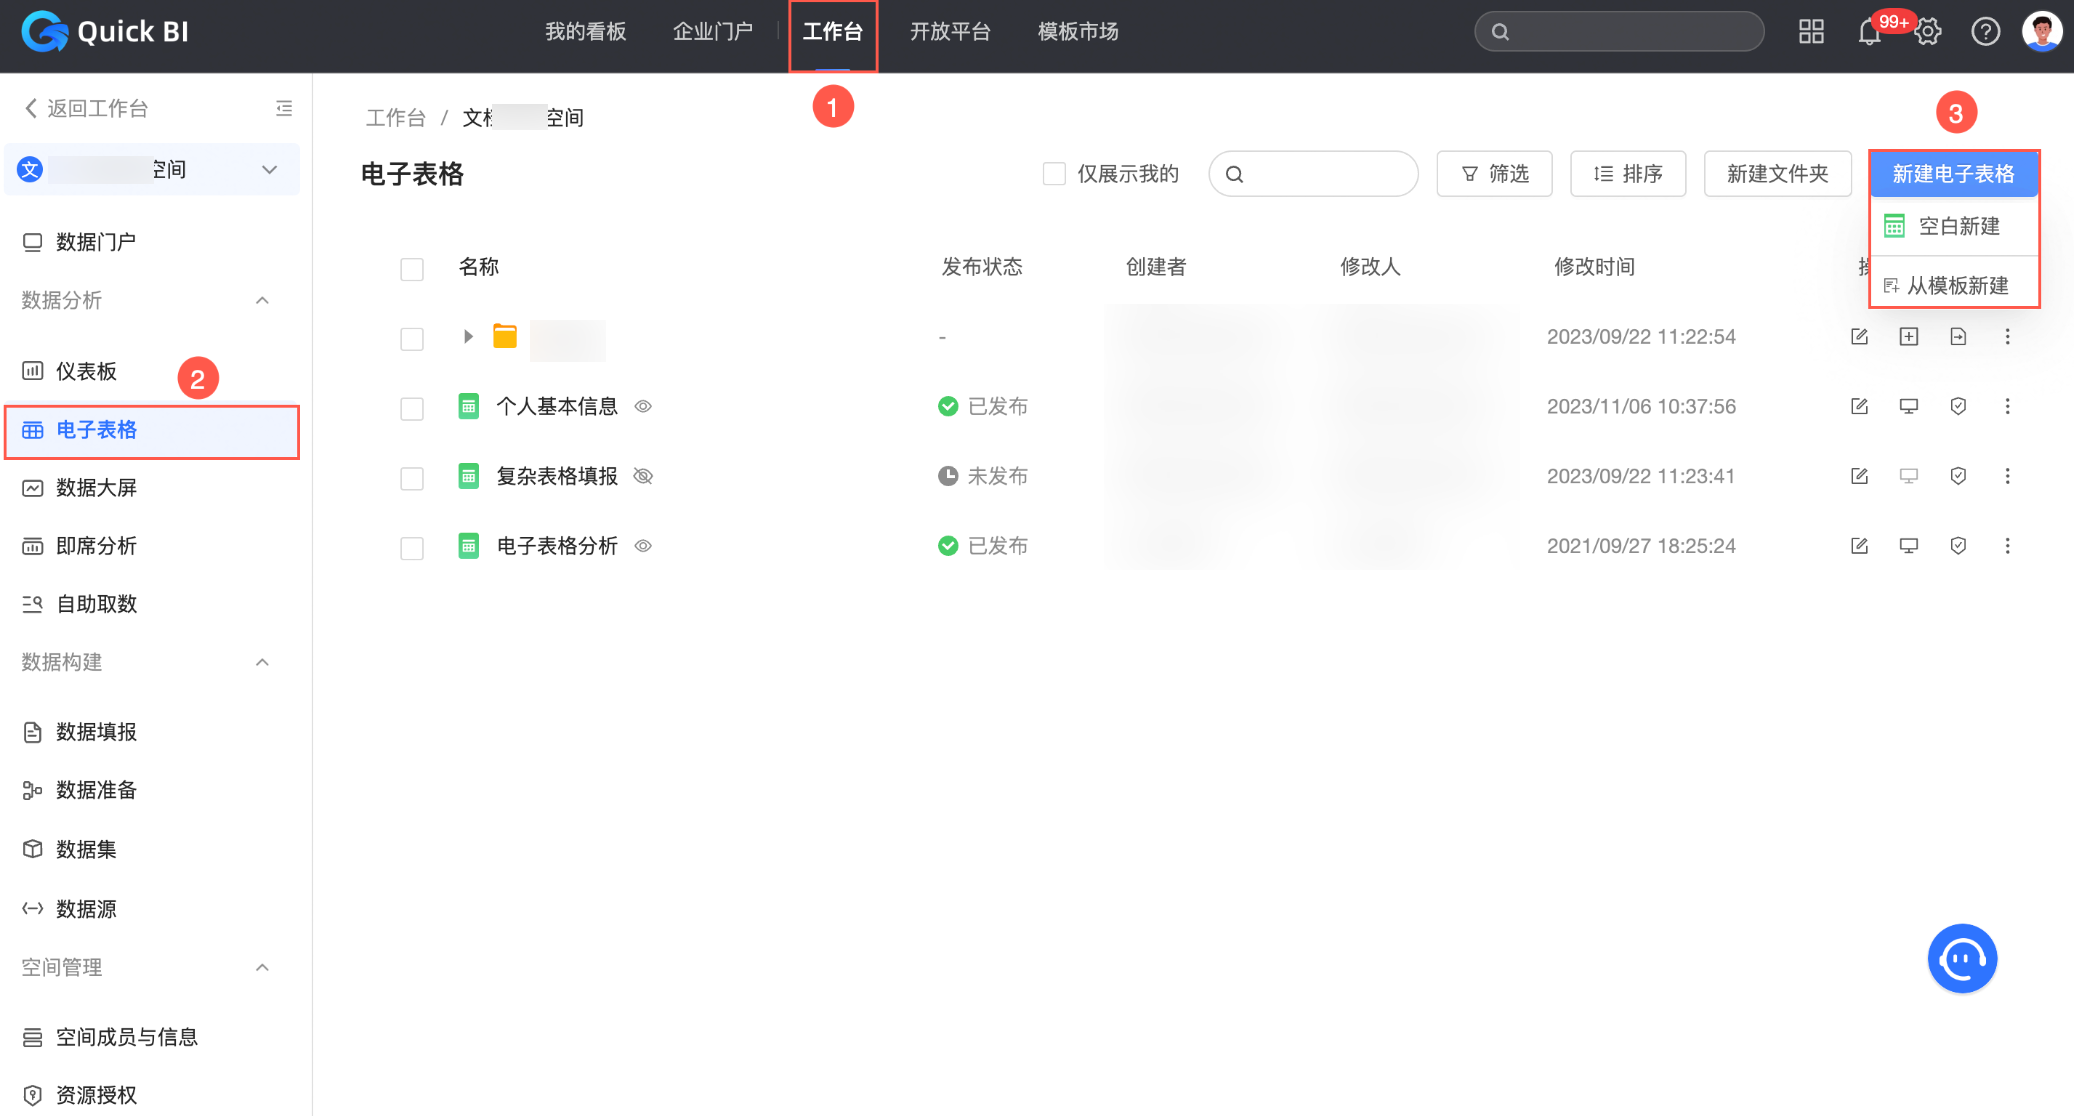
Method 3: Create a workbook on the Workbooks page of the Workbench tab in a workspace.
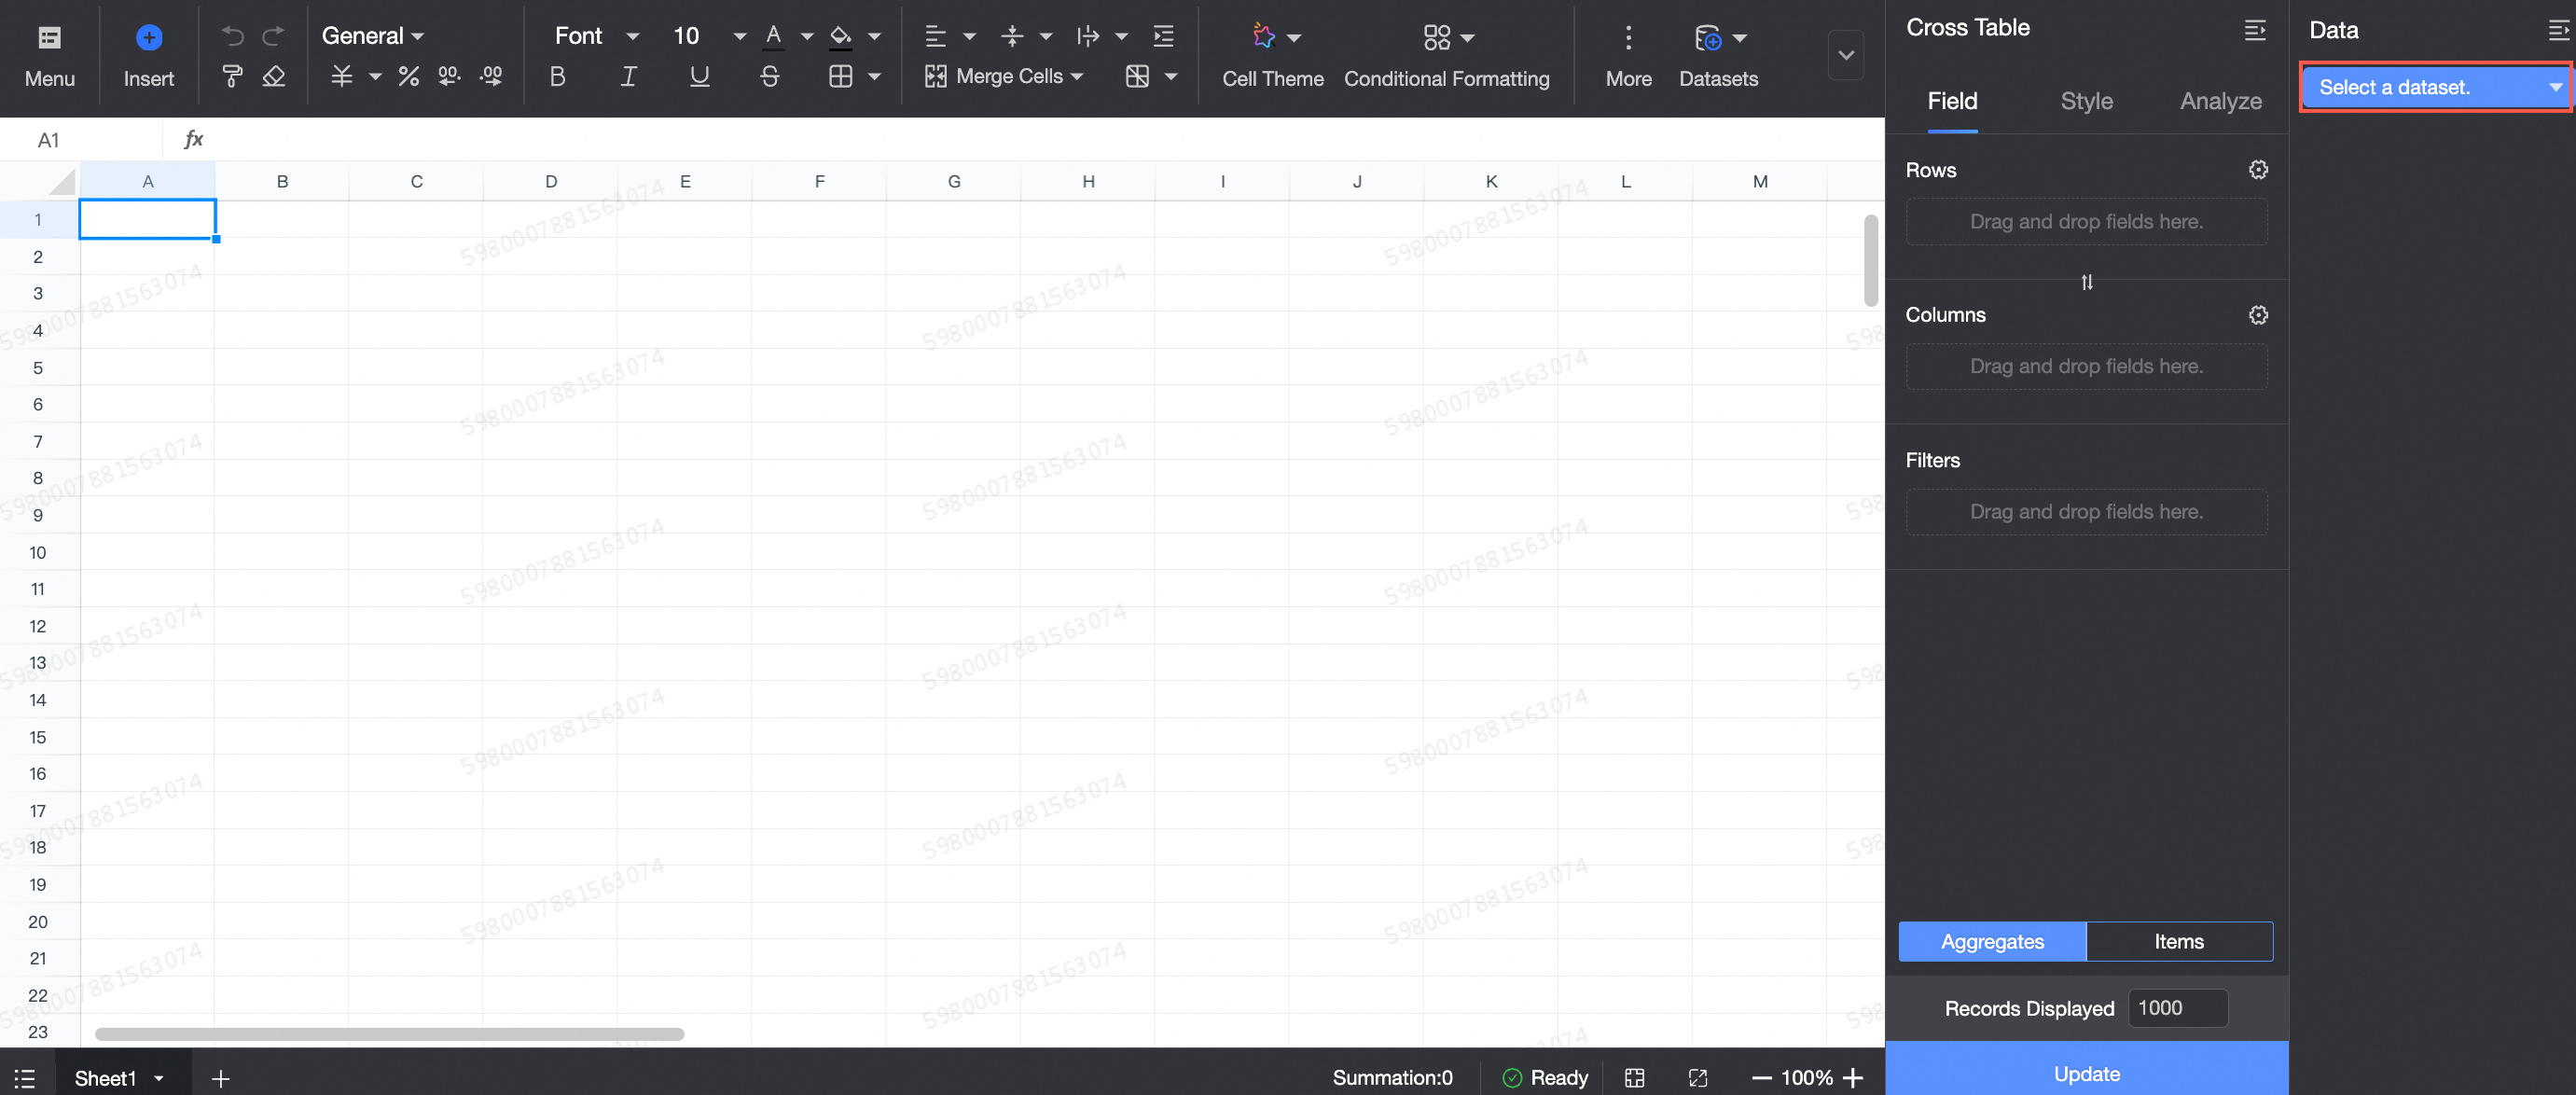
When you create a workbook by using one of the preceding three entry points, no dataset is selected by default. You must select a dataset on the editing page.
Method 4: Create a workbook on the Datasets page.
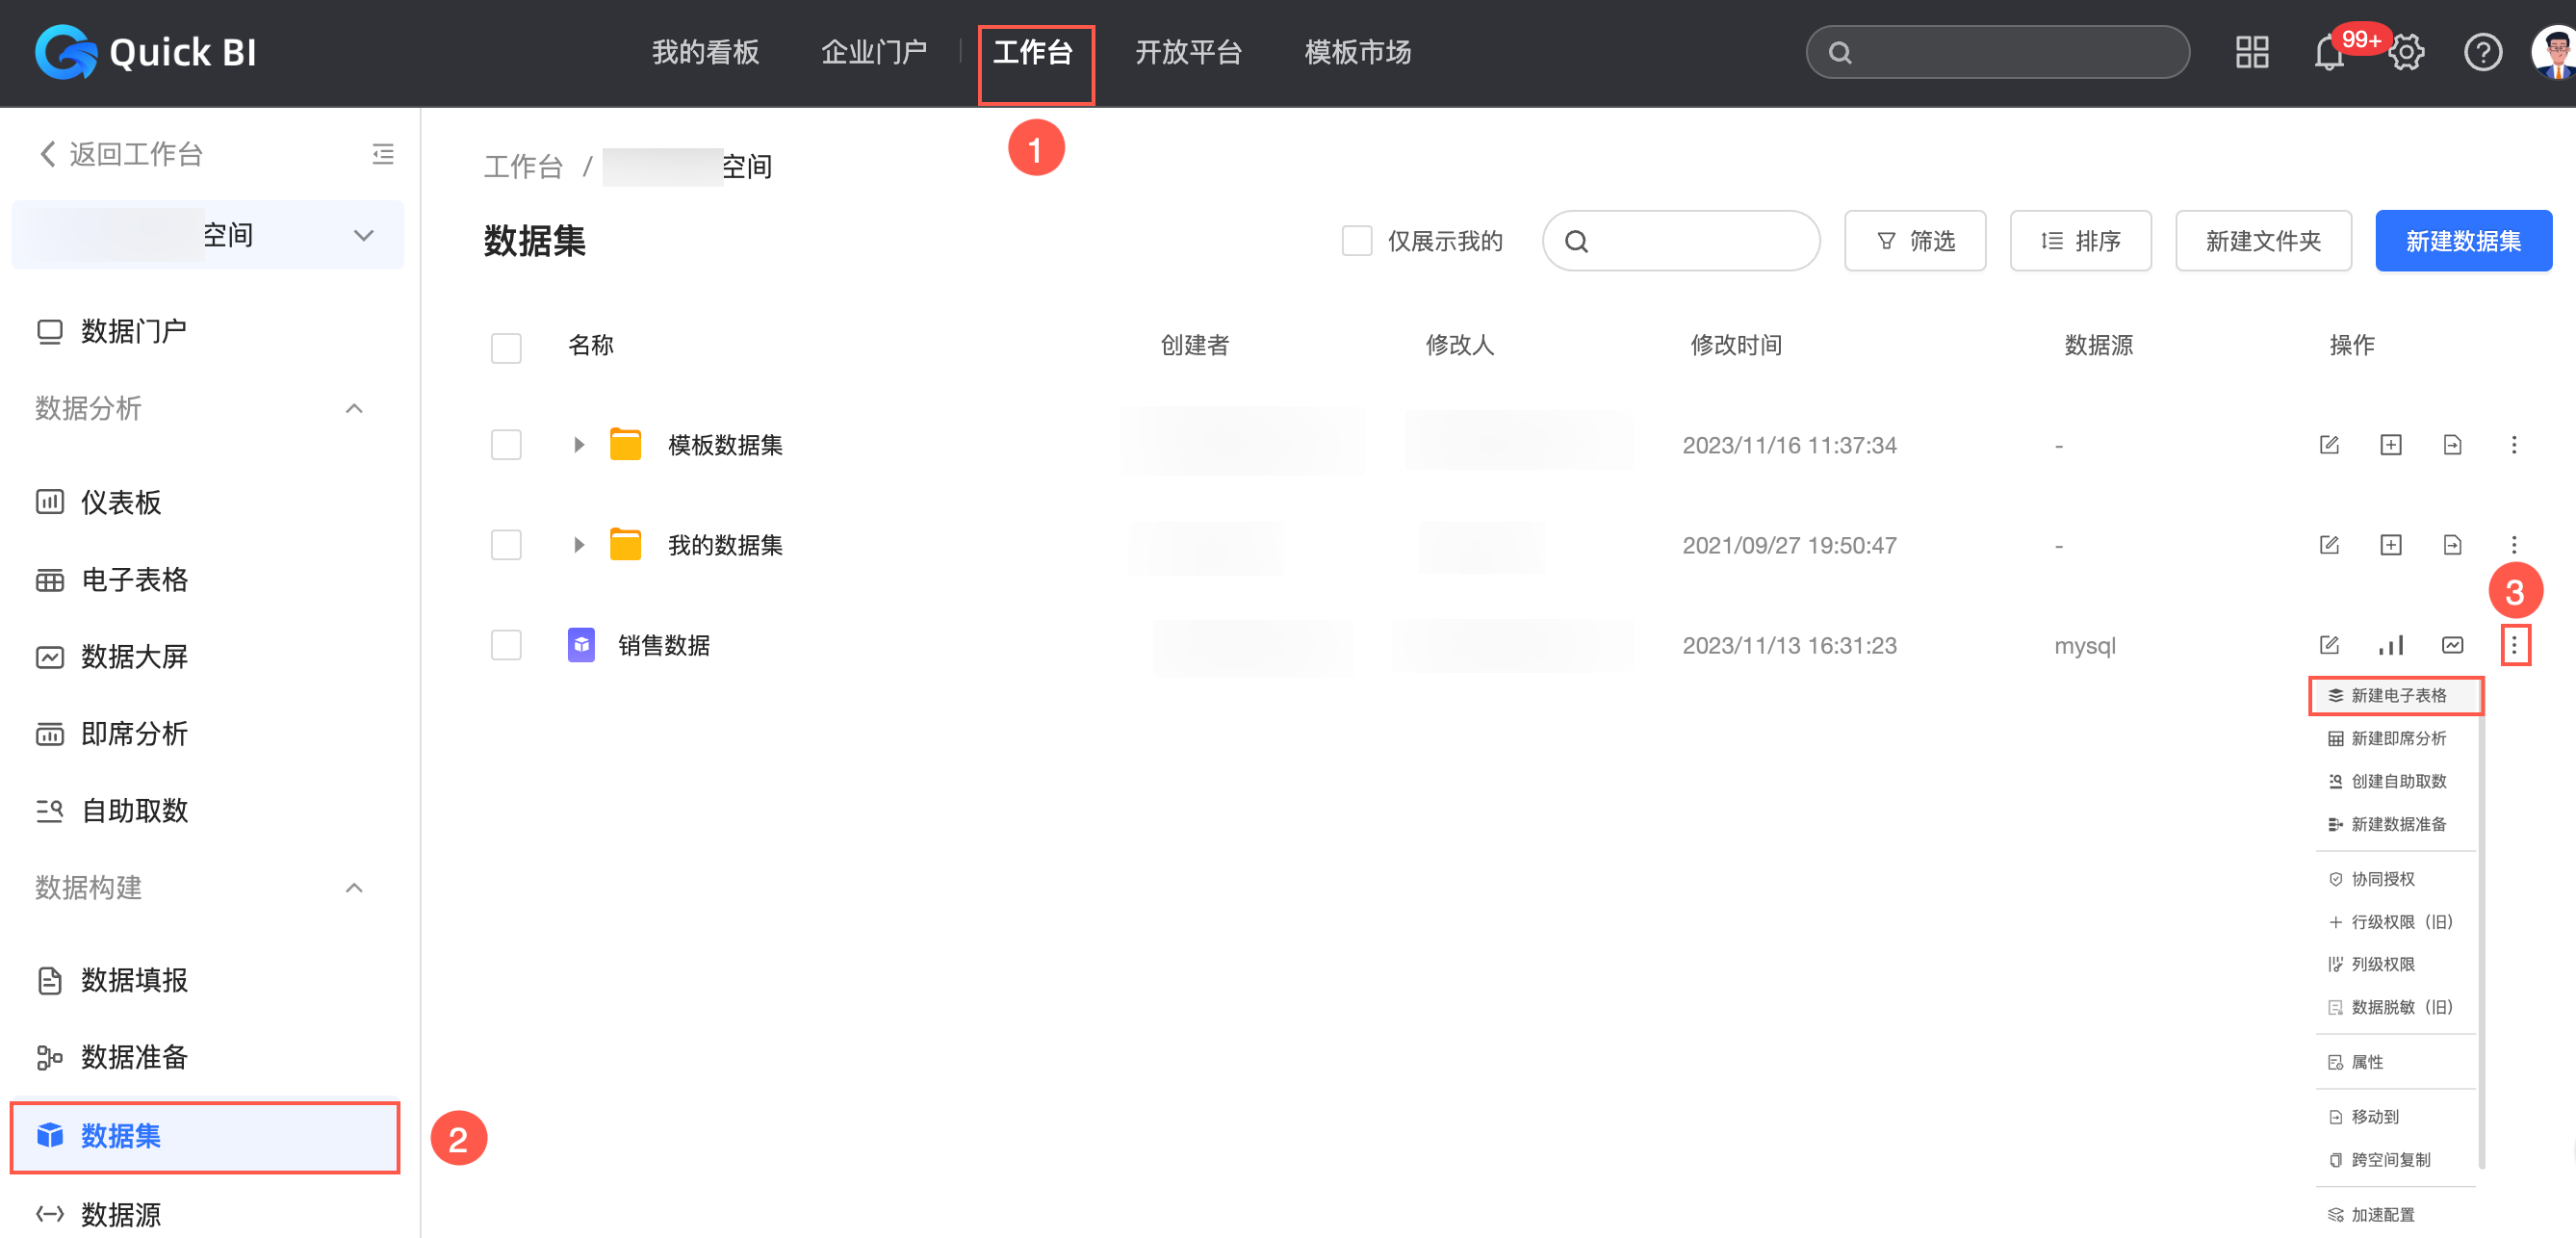
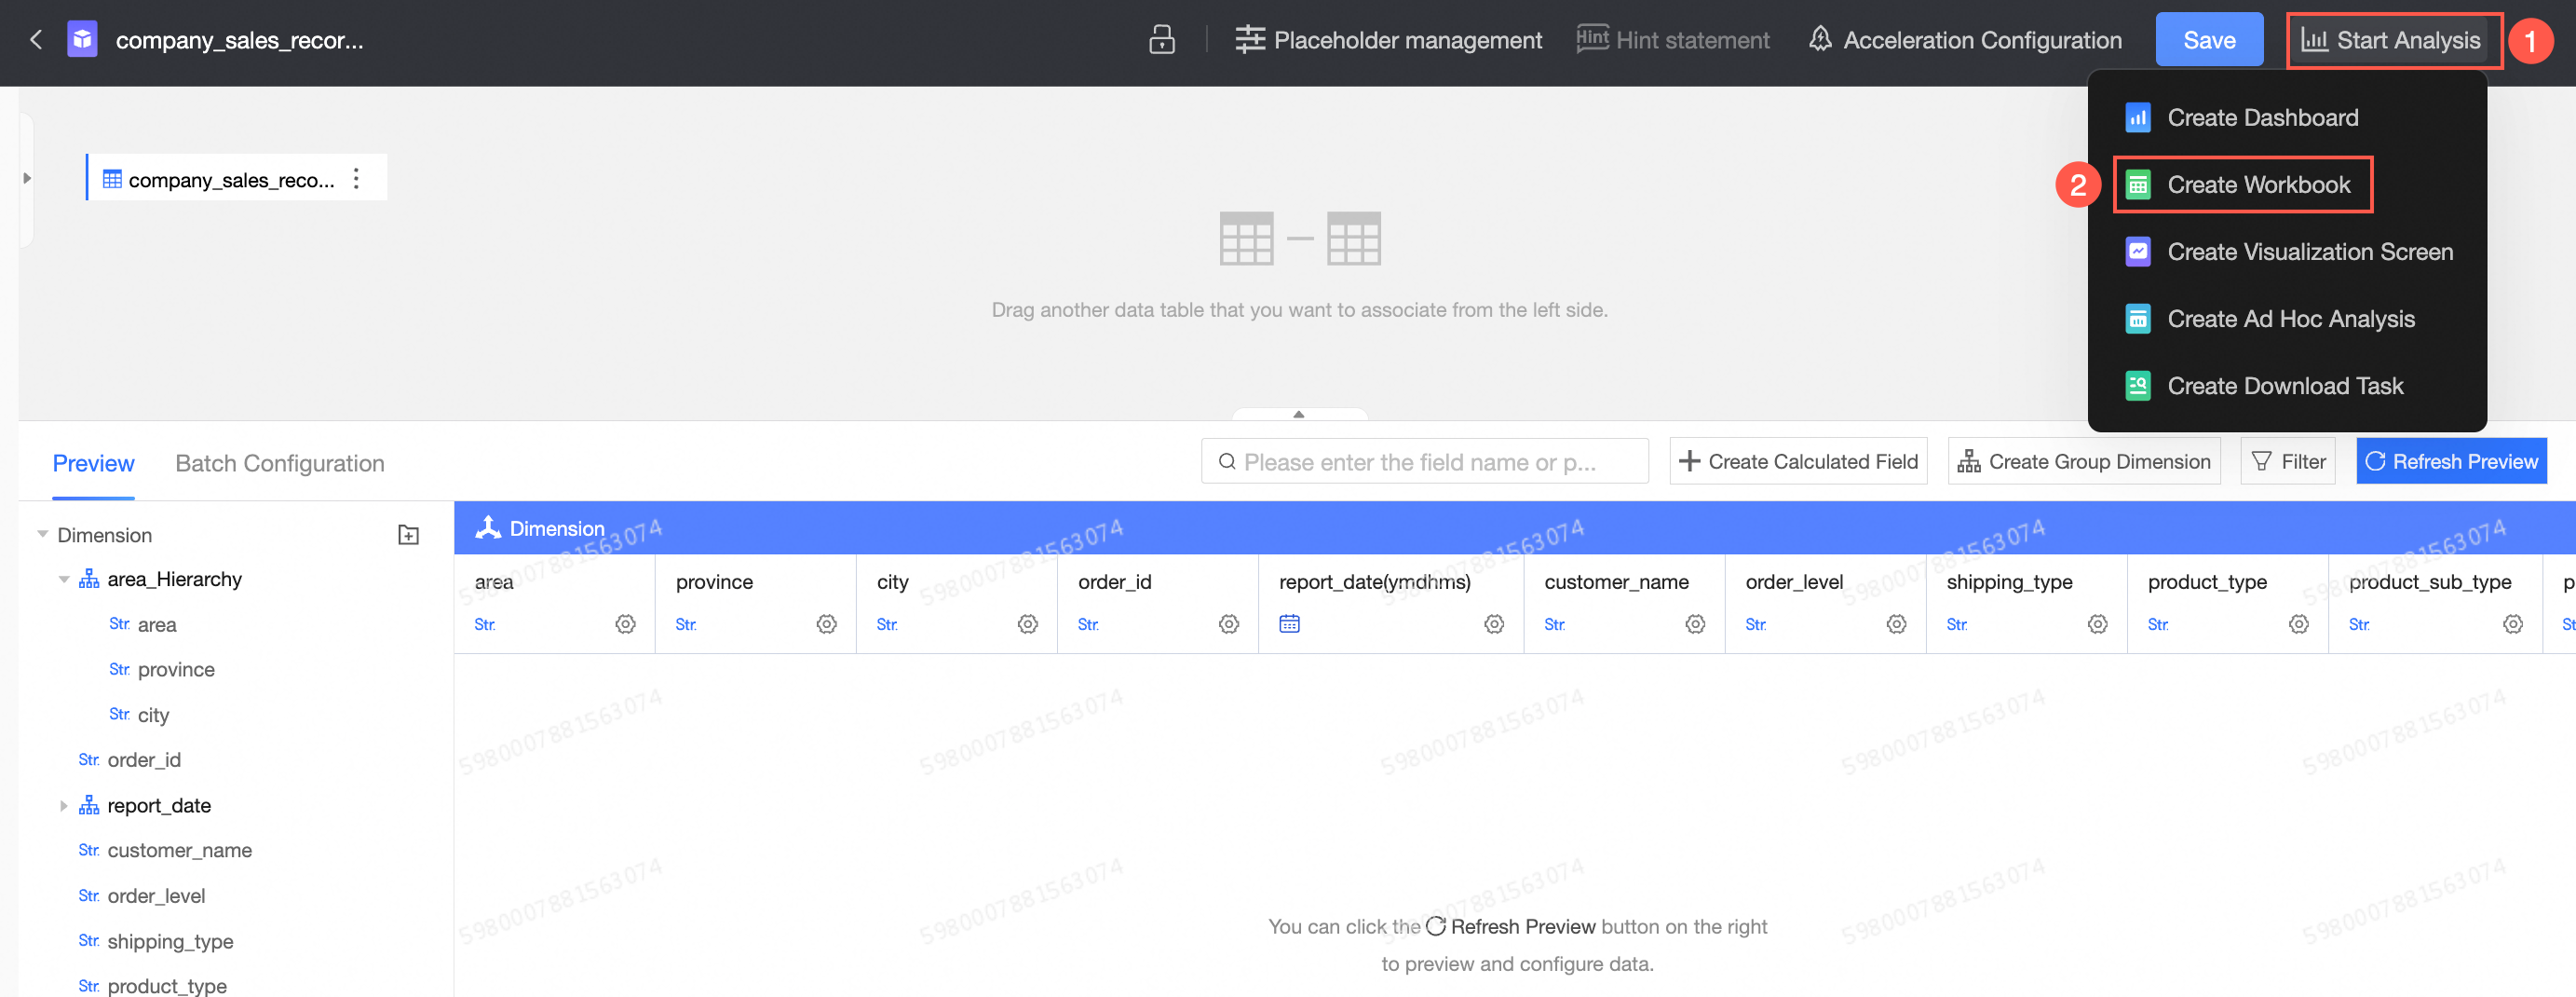
Method 5: Create a workbook on the editing page of a dataset.

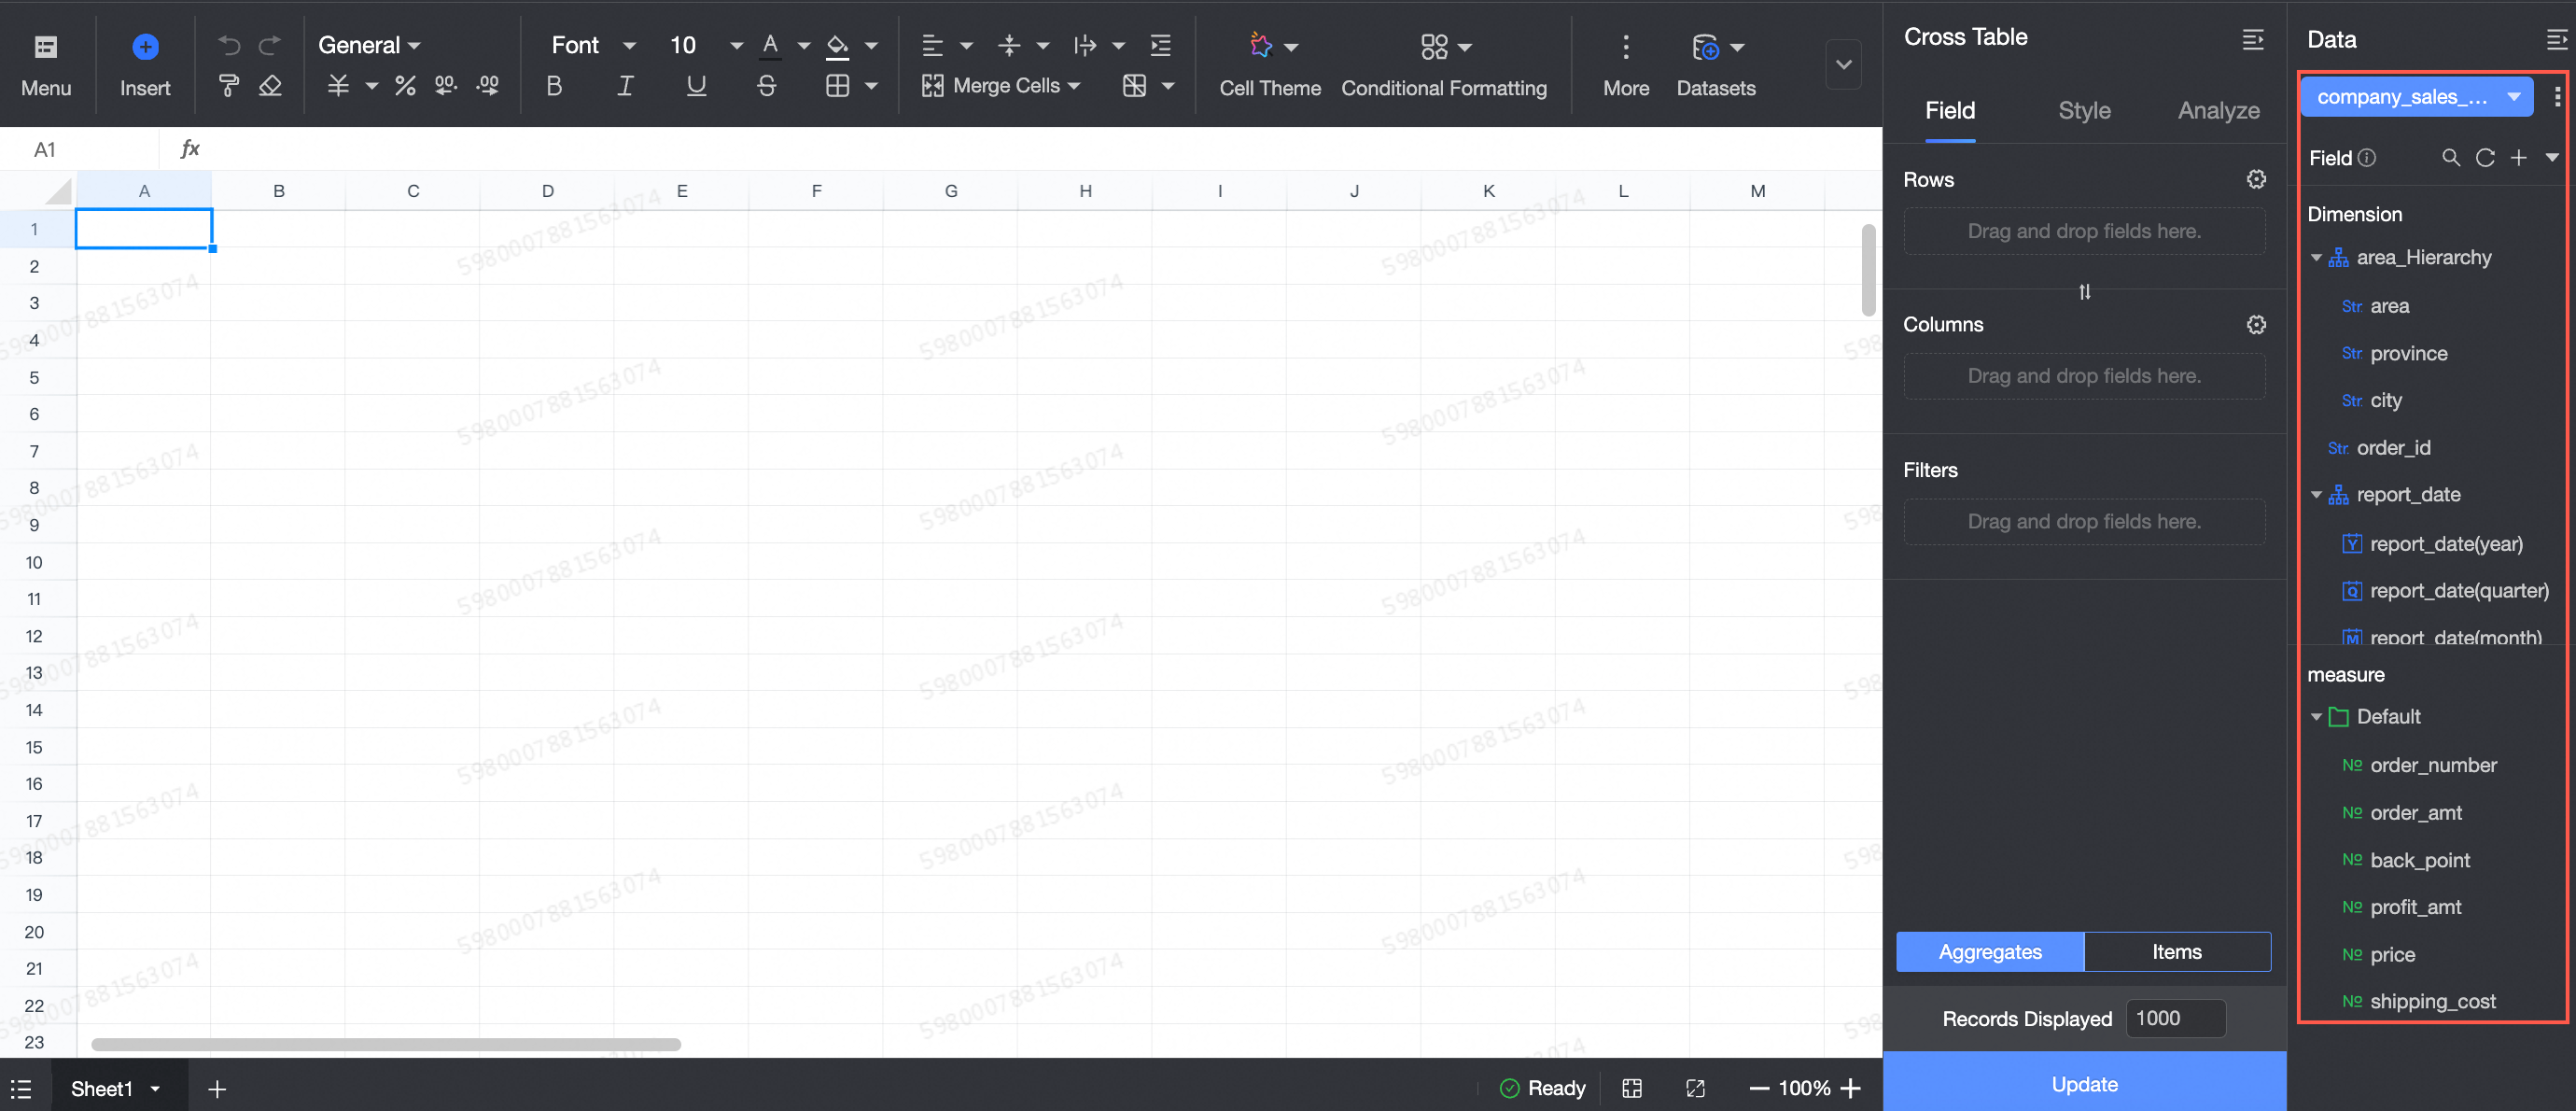
When you create a workbook from an existing dataset using Entry point 4 or 5, the dataset's dimensions and measures automatically load into the Data panel on the right. You can then drag the fields to the required areas.
If you use Method 3 to create a workbook, you can move the pointer over Create Workbooks and select Create Workbook (New Edition), Blank, or Create from Template. If you directly click Create Workbooks, a workbook of the new edition is created by default.
If you use other methods to create a workbook, a workbook of the new edition is created by default.
Data configuration
In this example, a workbook is created by using Method 1.
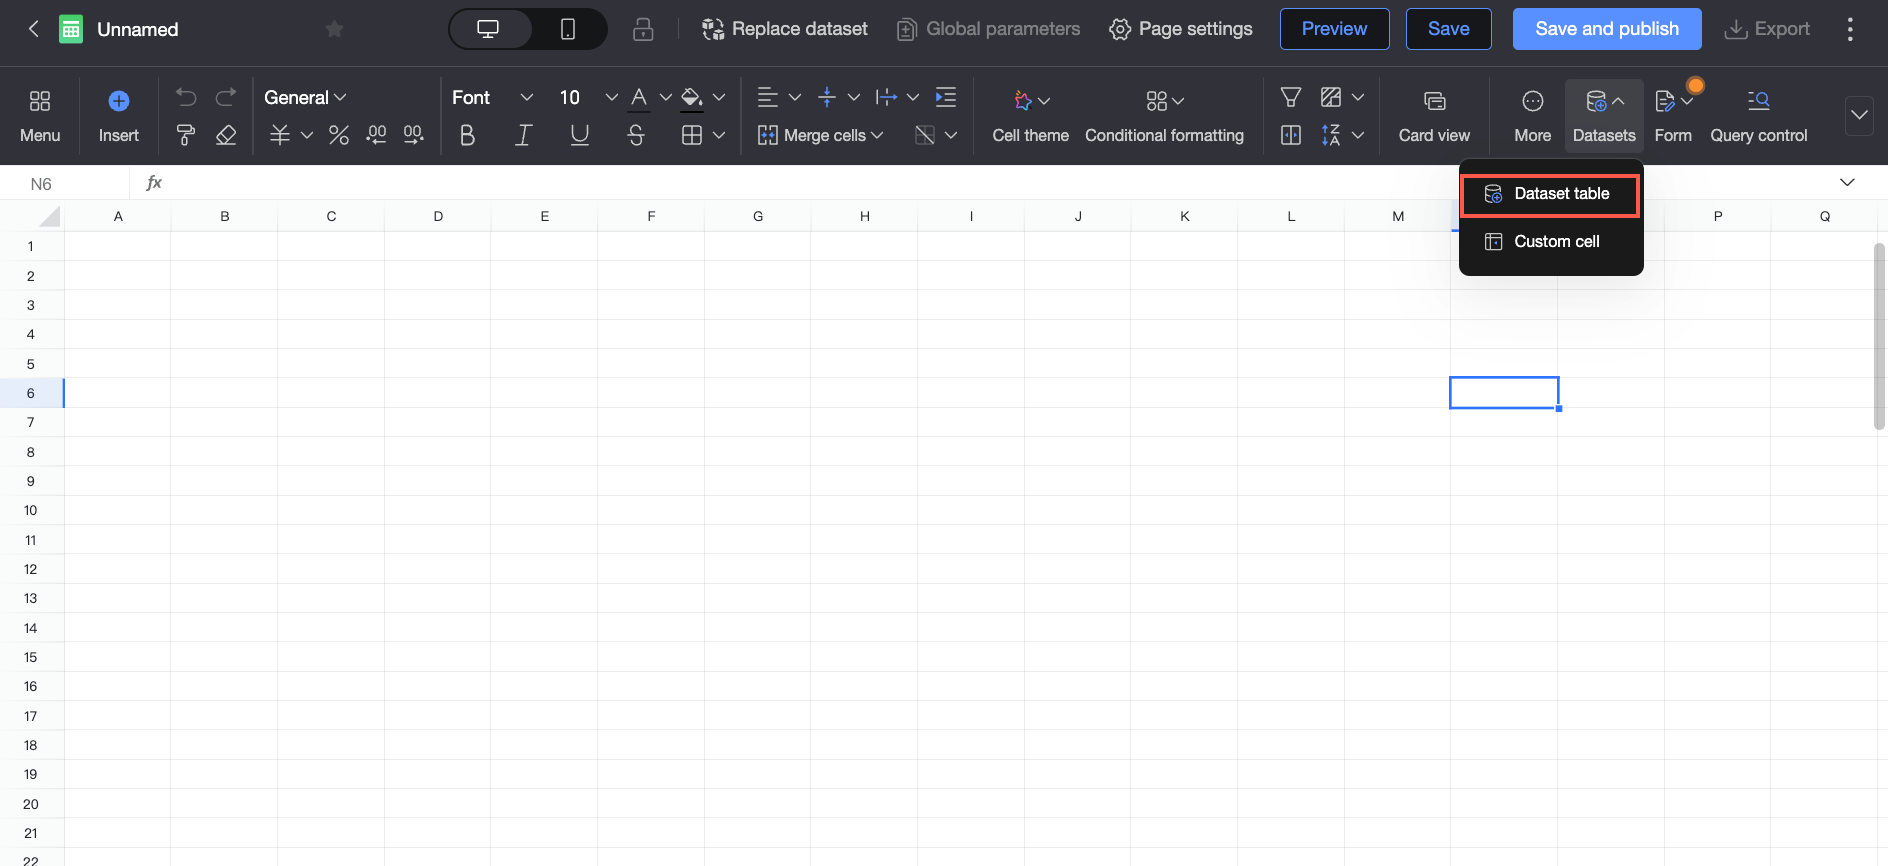
Insert a dataset table
On the workbook editing page, click Dataset > Dataset Table in the toolbar.
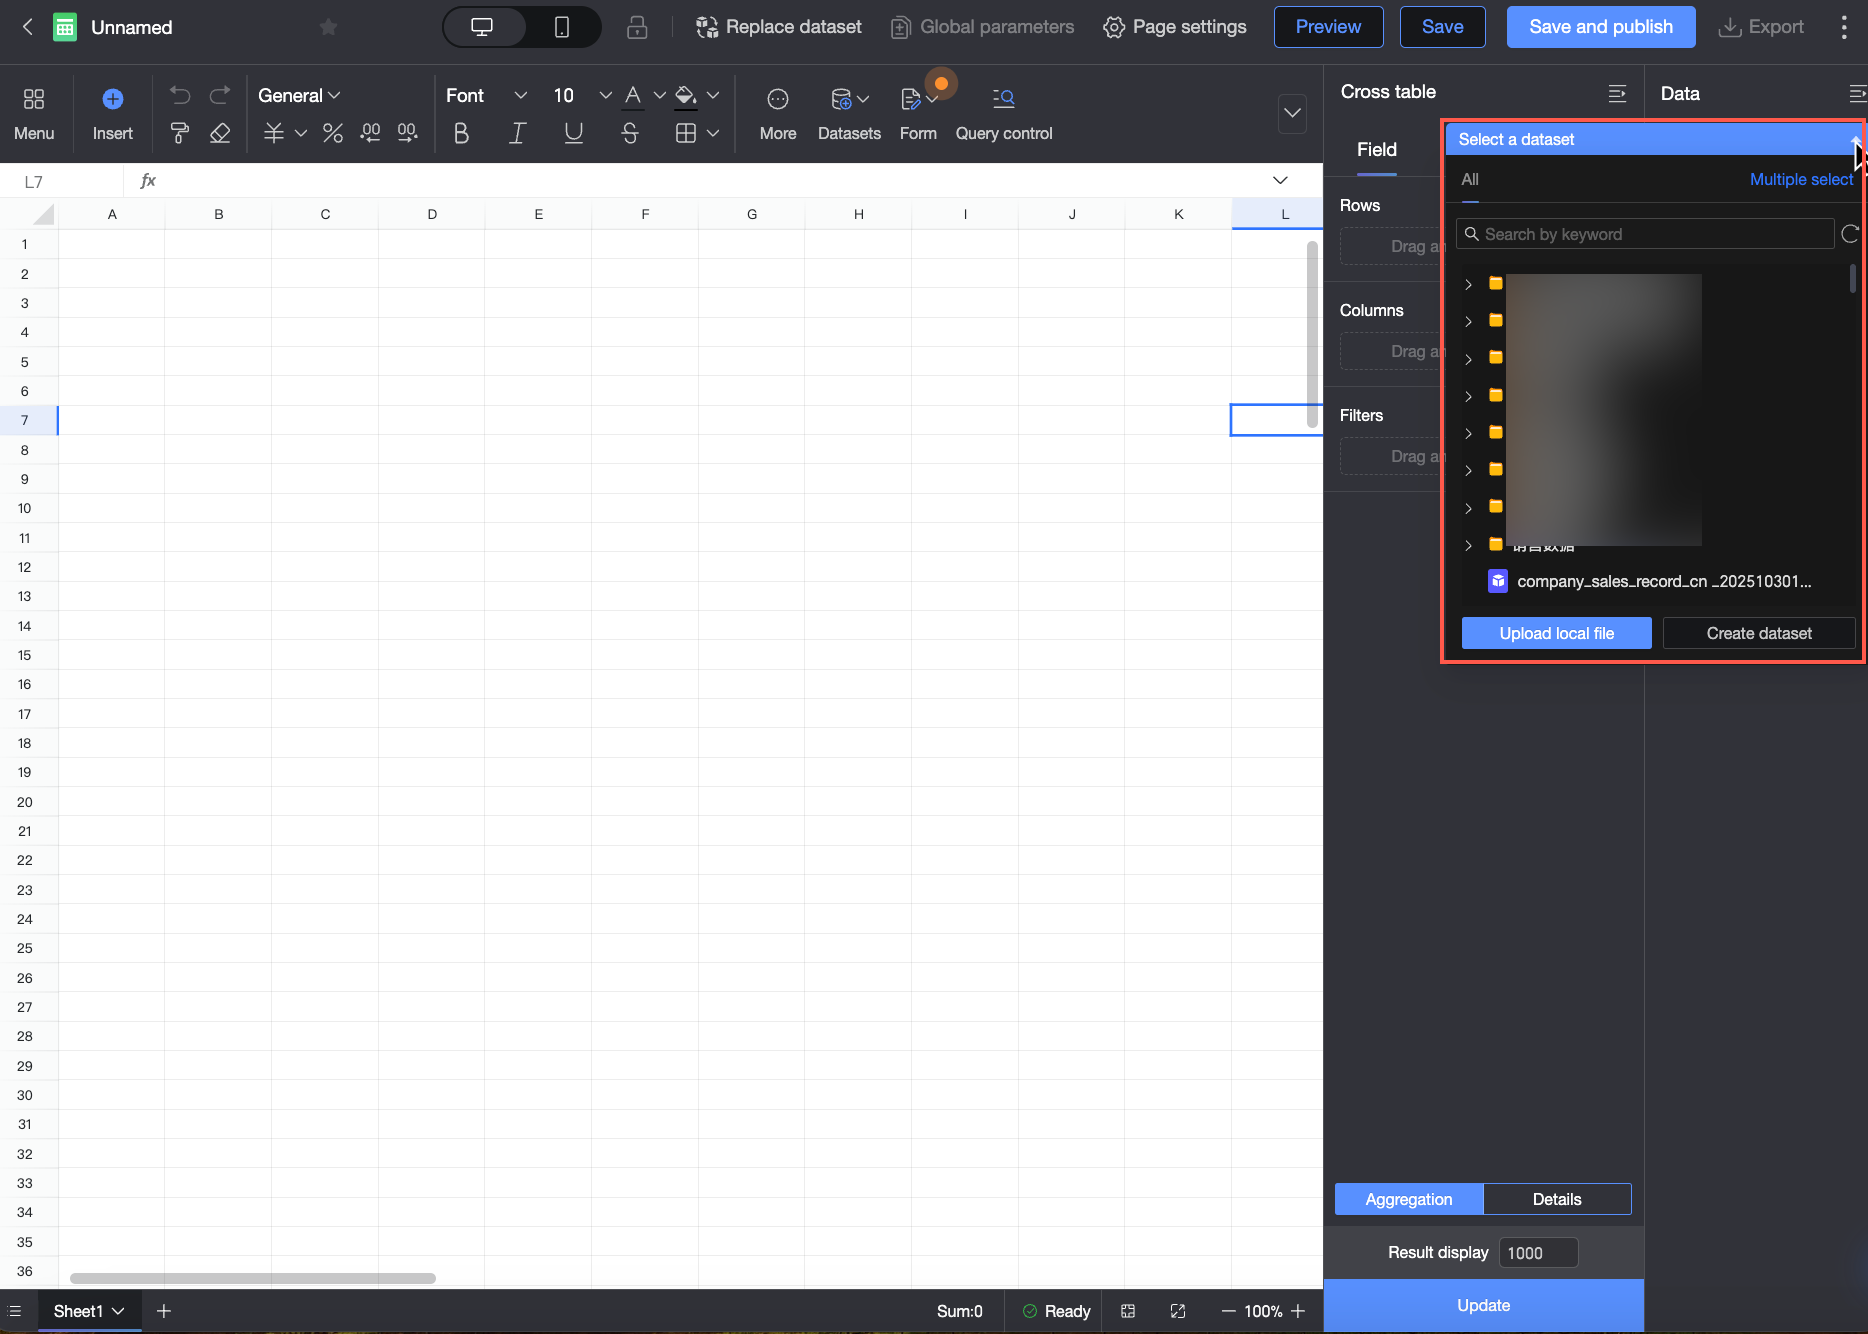
Click Select a dataset in the Data pane and select a dataset from the dropdown list. The fields of the selected dataset are then added to the Dimensions and Measures areas.
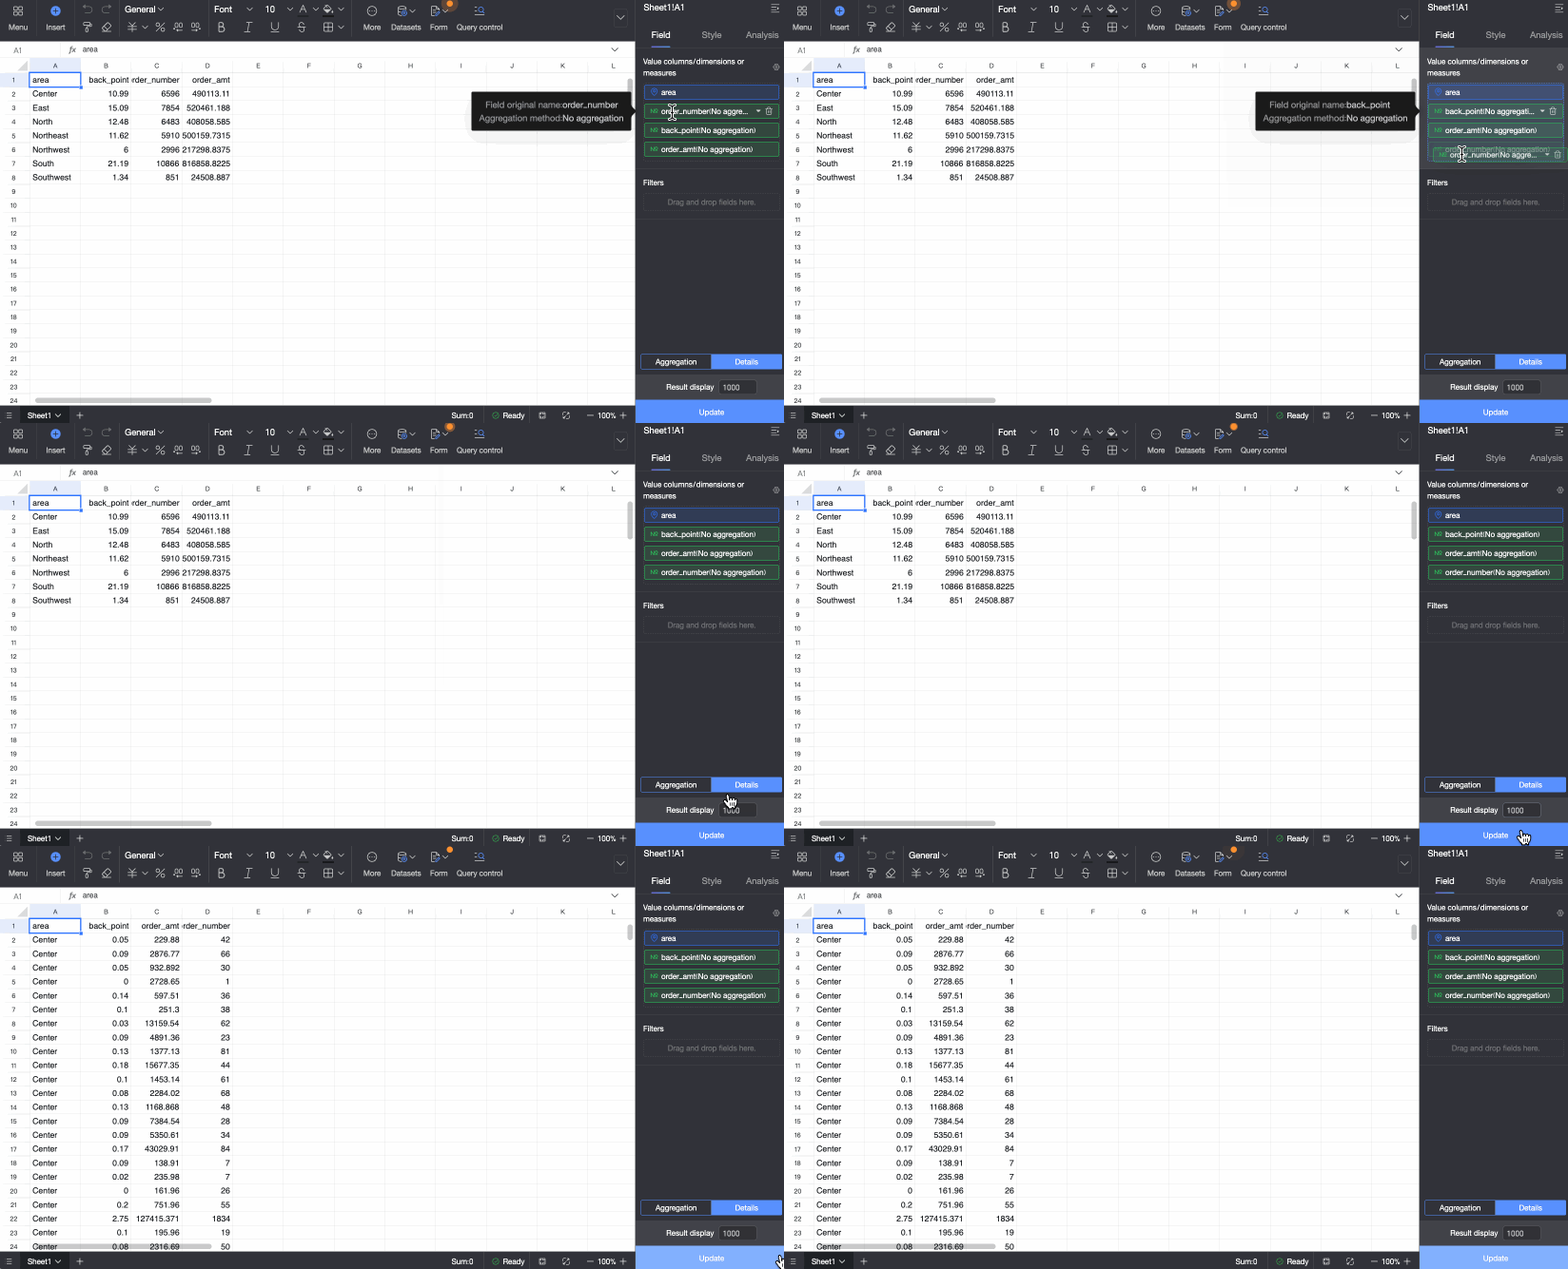
On the Fields tab, select the data display mode for the table of the current dataset. The available modes are Aggregation and Detail.
Aggregation: Aggregates the values of measures based on dimensions. For example, sum order amounts by region to display the total sales for each region.
Detail: Displays each row of the raw data without any aggregation. For example, display each individual order amount record for every region.
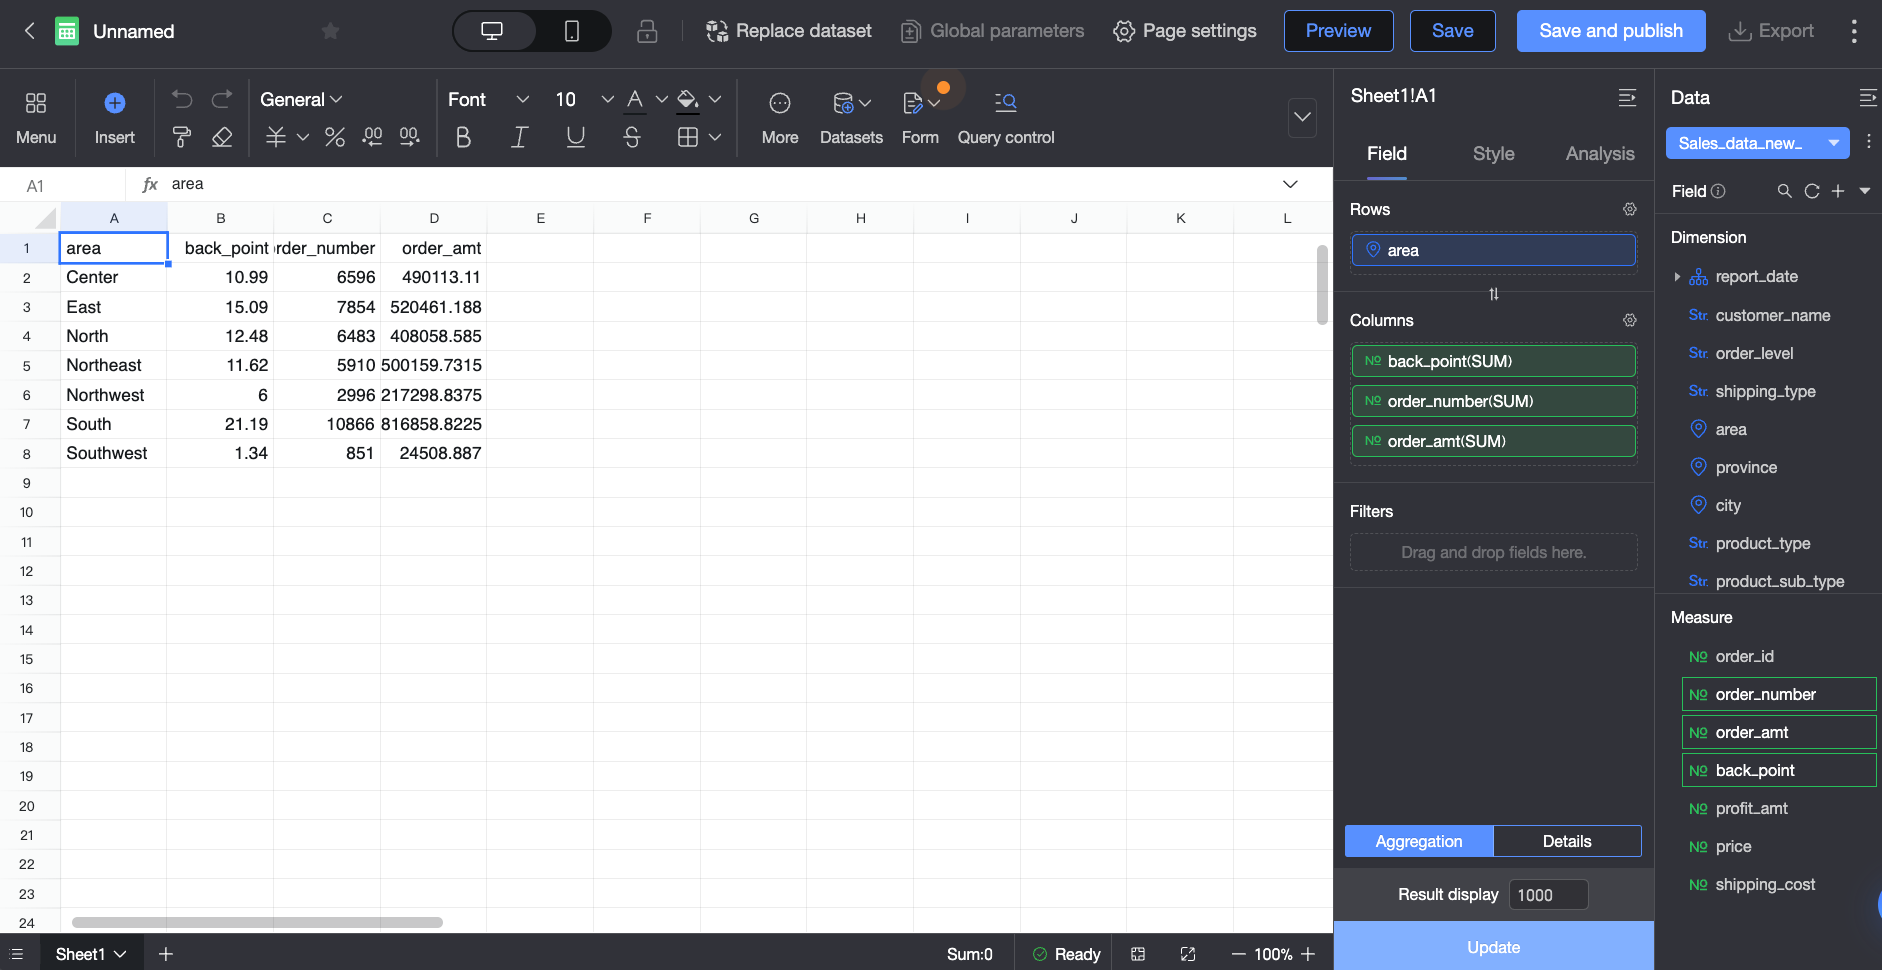
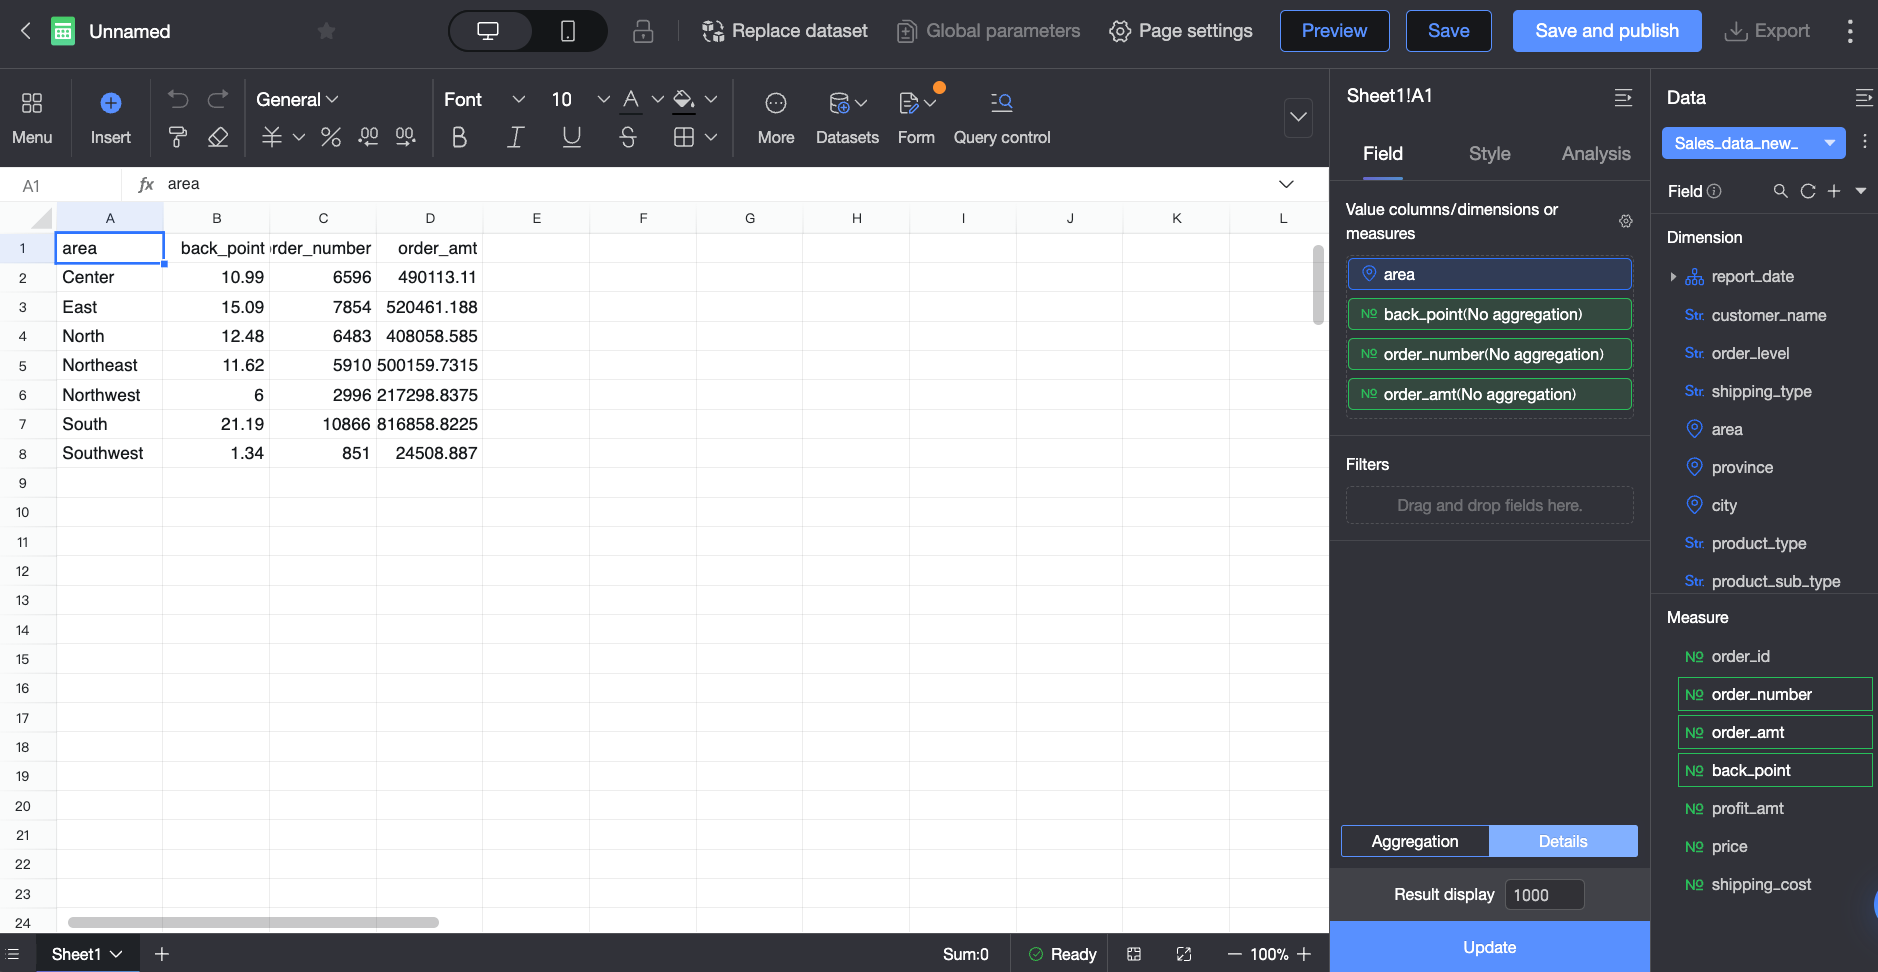
Select the required dimension and measure fields to add data to the workbook.
In Aggregation mode, you can configure fields in the following ways.
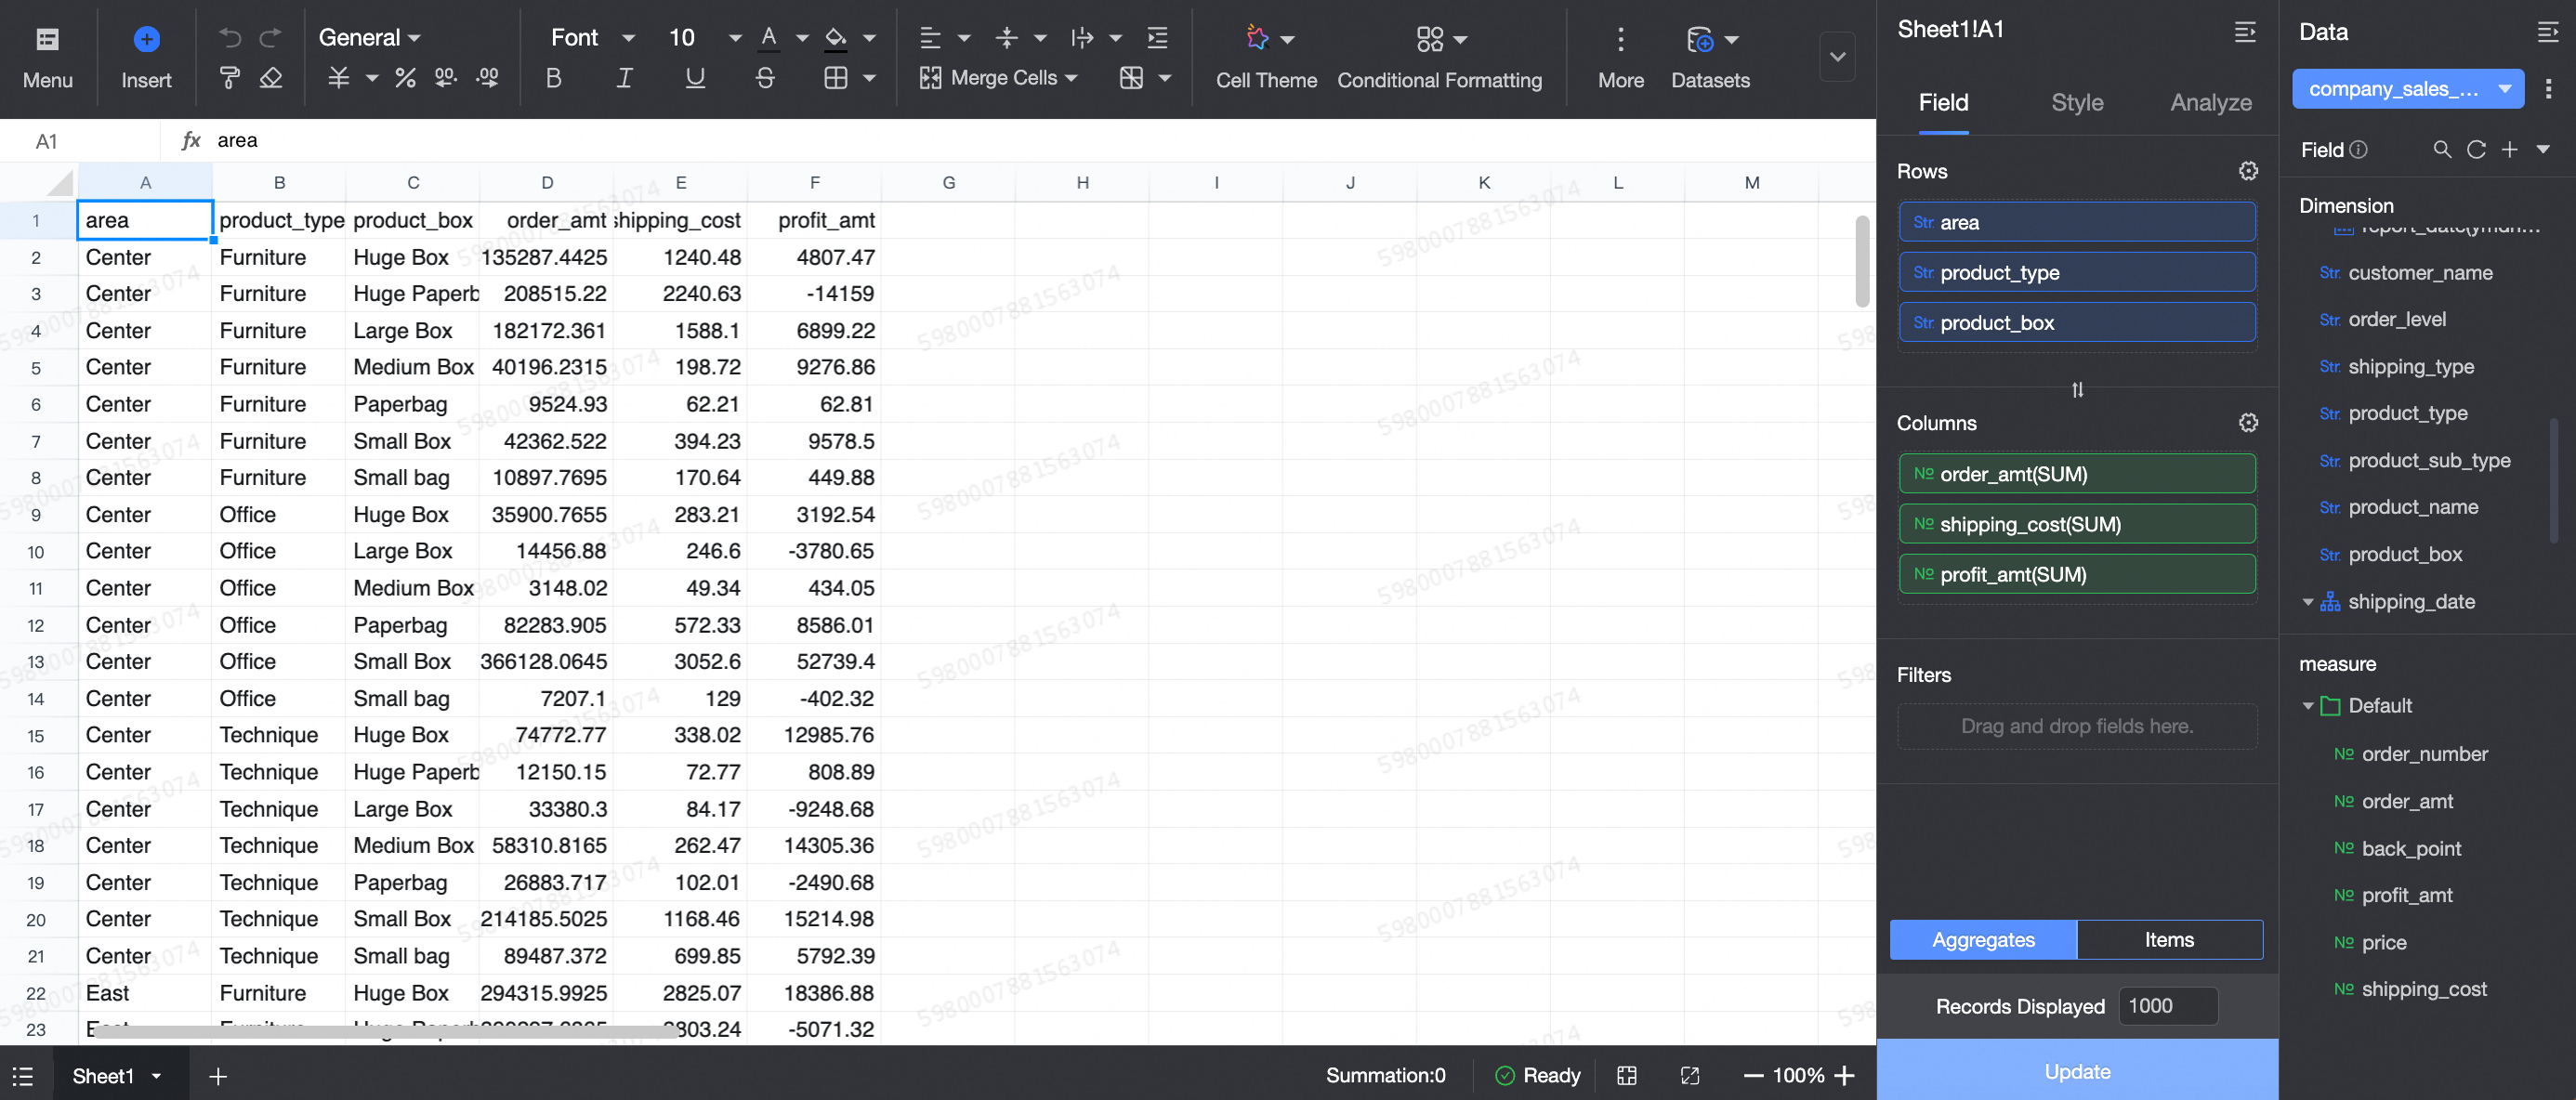
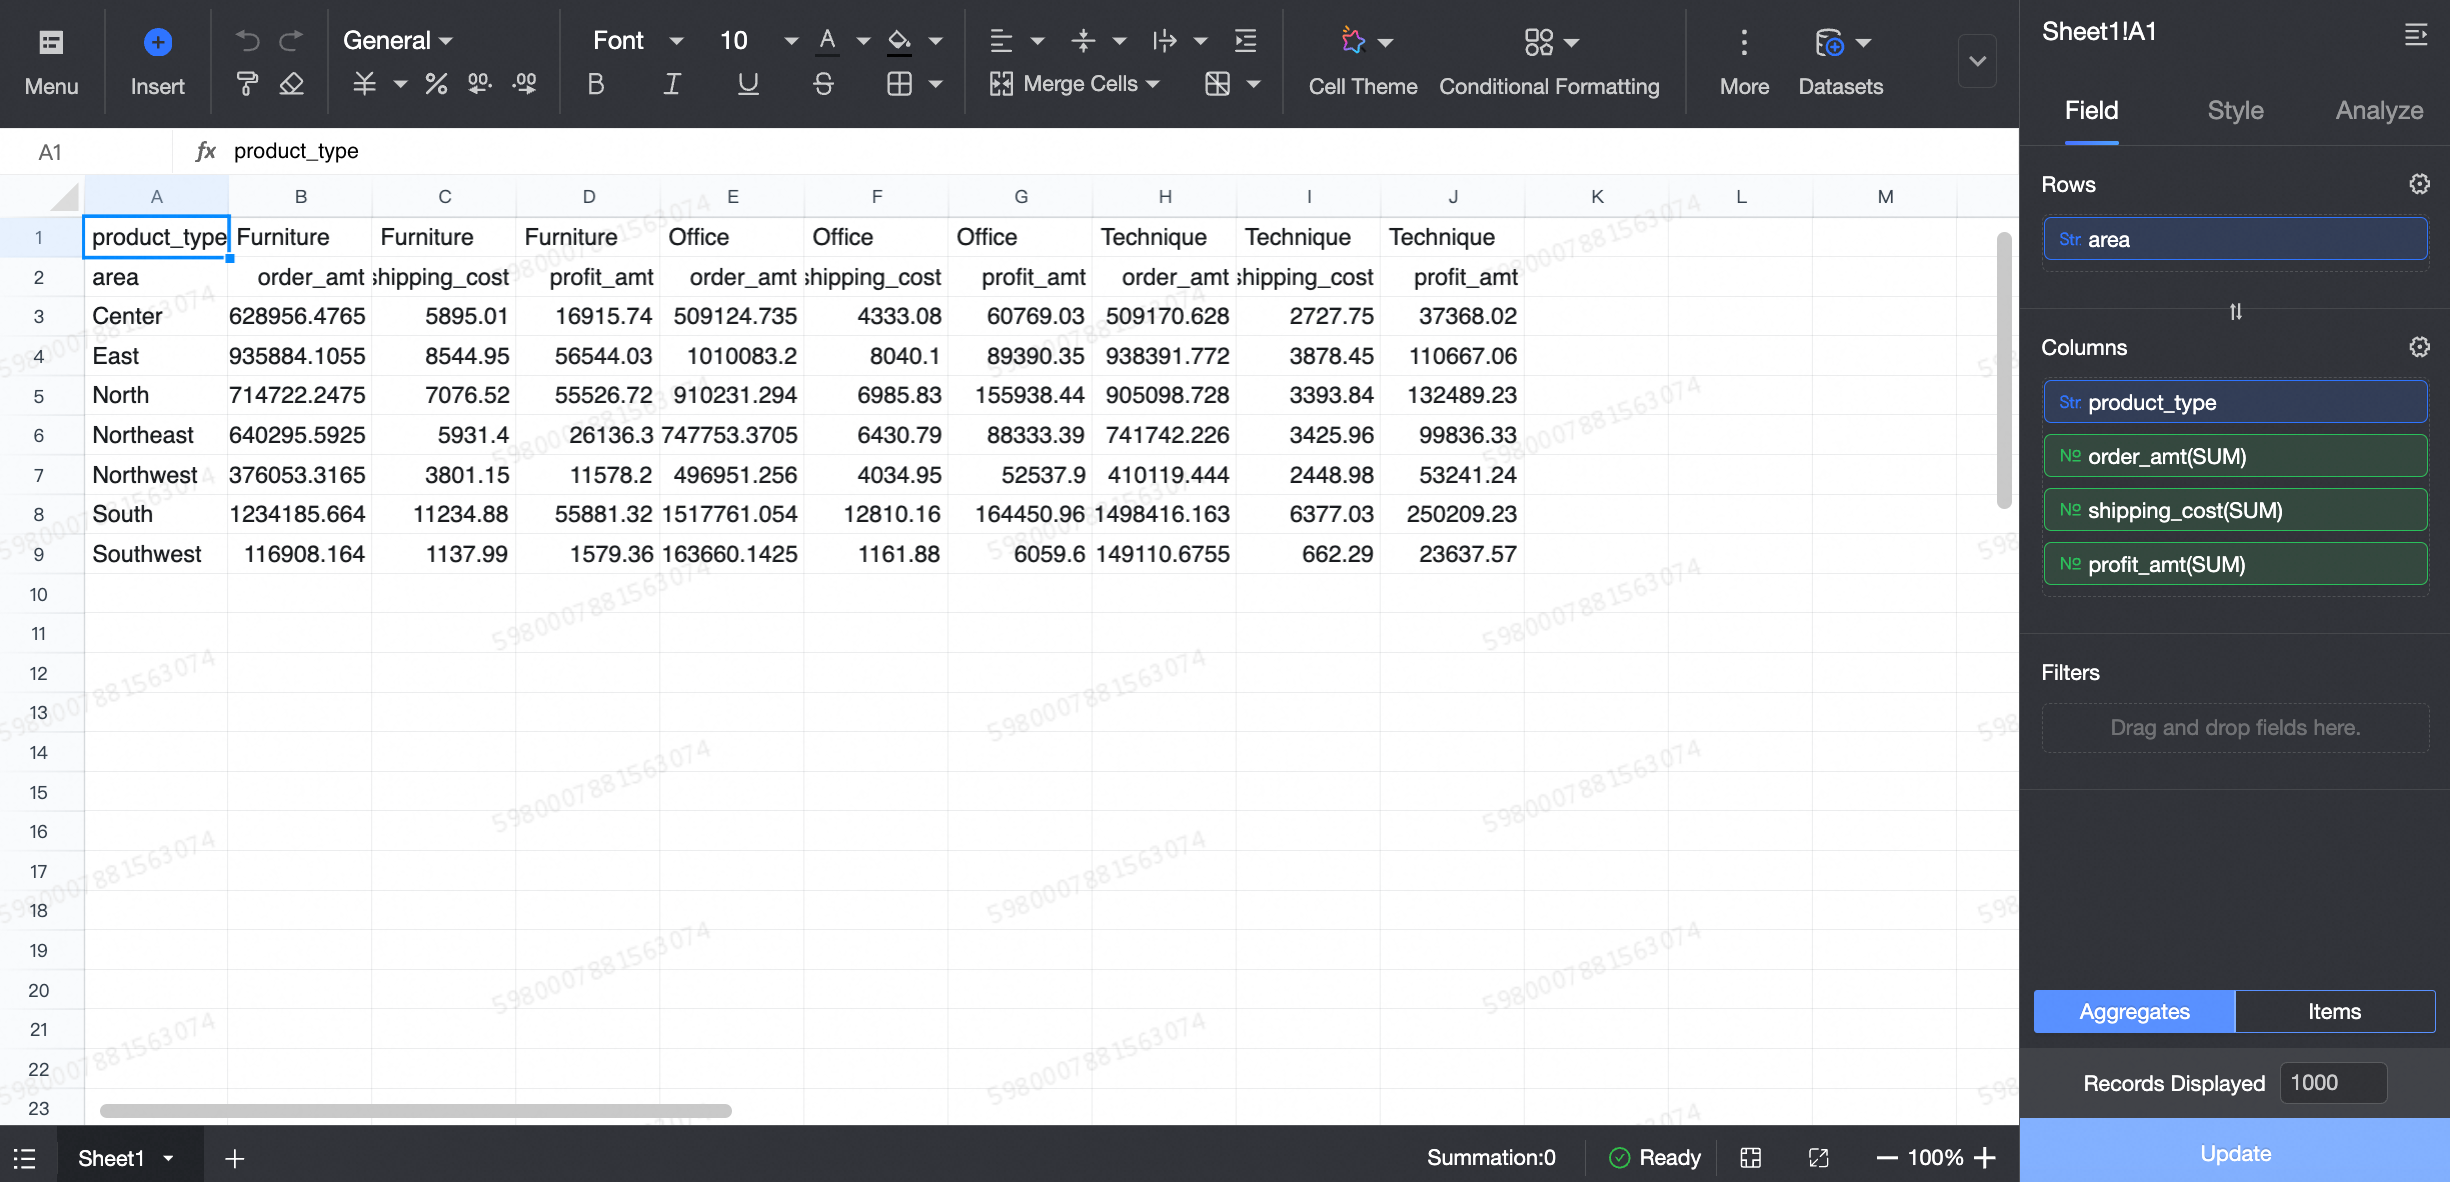
Method 1: Add a dimension field to Row and a measure field to Column, as follows.
On the Field tab, add the required dimensions and measures.
In the Dimension list, find Province, Product Type, and Product Package, and sequentially double-click or drag them to the Row area.
From the Measures list, double-click or drag Order Amount, Shipping Cost, and Profit Amount to the Columns area.
Click Update. The system automatically updates the workbook.
Method 2: Add a dimension field to Rows and a measure and a dimension field to Columns as follows.
On the Field tab, add the required dimensions and measures.
In the Dimension list, find Province, and double-click or drag it to the Row area.
In the Dimension list, find Product Type and drag it to the Column area.
In the Measures list, find Order Amount, Shipping Cost, and Profit Amount, and double-click or drag them to the Column area.
Click Update, and the system automatically updates the workbook.
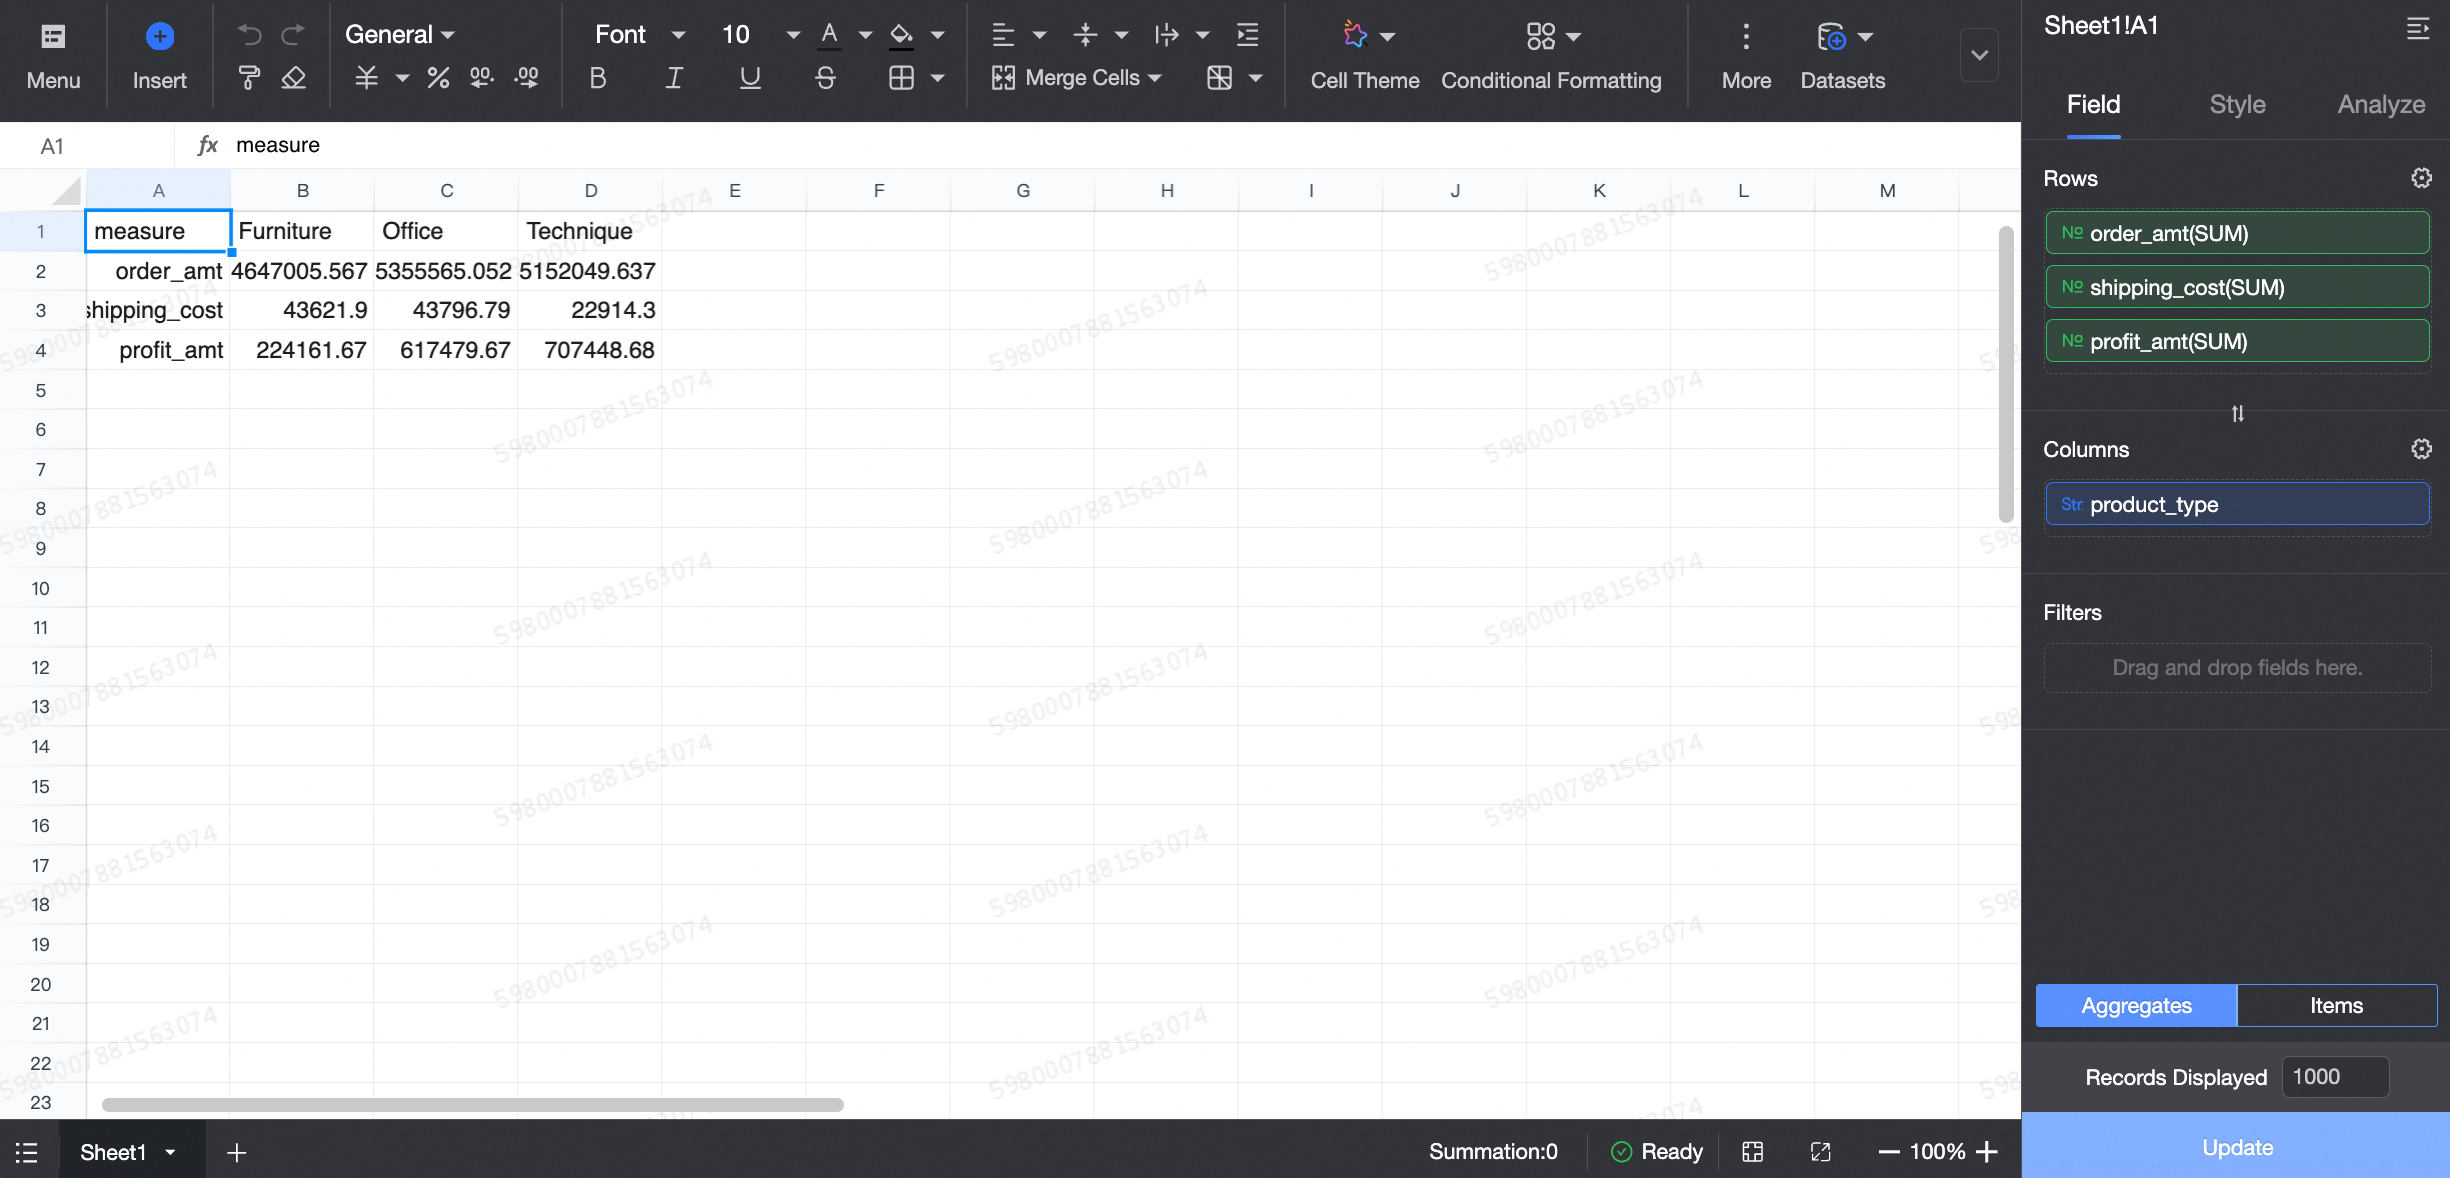
Method 3: Add a measure field to Rows and a dimension field to Columns. The procedure is as follows.
On the Field tab, add the required dimensions and measures.
In the Dimension list, find Product Type and drag it to the Column area.
In the Measures list, find Order Amount, Shipping Cost, and Profit Amount, and drag them in sequence to the Row area.
Click Update, and the system automatically updates the workbook.
In Detail mode, dimension and measure fields are displayed together. You can drag the fields to rearrange their order in the table.
Configure the field format.
Parameter
Description
Date display format
Default: Auto. Supported formats include YYYY-MM-DD, YYYYMMDD, YYYY/MM/DD, MMDD, MM-DD, MM/DD, and DDMMYYYY.
NoteThis setting applies only to date-type fields.
Alignment
Default: Auto. Supported options: Left, Center, and Right.
Sort
Default: No Sorting. Supported options include Ascending, Descending, Ascending Within Group, Descending Within Group, Advanced Sort, Custom Sort, and Field Sort.
NoteAdvanced Sort applies only to measure fields.
Custom Sort and Field Sort apply only to dimension fields.
Display name
Specify a display name for the field.
Data display format
Default: Auto. Supported options include Integer, 1 Decimal Place, 2 Decimal Places, Percentage, Percentage (1 Decimal Place), Percentage (2 Decimal Places), and Custom.
NoteThis setting applies only to measure fields.
When the custom format type is Numeric or Percentage, you can set the format for negative numbers to -1234 or (1234) and select Use thousands separator.
Aggregation method
Supported methods include Sum, Average, Count, Count Distinct, Max, Min, Population Standard Deviation, Sample Standard Deviation, Population Variance, Sample Variance, and Last Day.
NoteThis setting applies only to measure fields.
Advanced calculation
Supported options include date accumulation, Percentage, Rank, and period-over-period comparison.
NoteThis setting applies only to measure fields.
Null value display style
For dimension fields, you can configure the display style for null values or empty strings.
Null value:
Auto: Follows the dataset's configuration.
Display as '-'
Display as '{Null}'
Displayed as 'null'
Custom
String:
Auto: Follows the dataset's configuration.
Display as '-'
Display as '{Empty String}'
Display as 'null'
Custom
For measure fields, you can configure the display style for null values.
NoteA custom display value for nulls can contain Chinese and English characters, digits, underscores (_), forward slashes (/), backslashes (\), vertical bars (|), parentheses (()), and brackets ([]), and has a 150-character limit.
To set up filters, drag the target field to the Filters area. Then, click the
icon to the right of the field and configure the filter settings. For more information, see Field filtering.Click Save>.
NoteThe Save Workbook dialog box appears only when you save the workbook for the first time.
Parameter
Description
Name
The name of the workbook.
Location
The location where the workbook is stored.
Click OK to create the workbook.
NoteWorkbooks support an Excel-style AutoSum feature. Selecting a range of cells in the workbook displays their sum.
 icon to the right of the field and configure the filter settings. For more information, see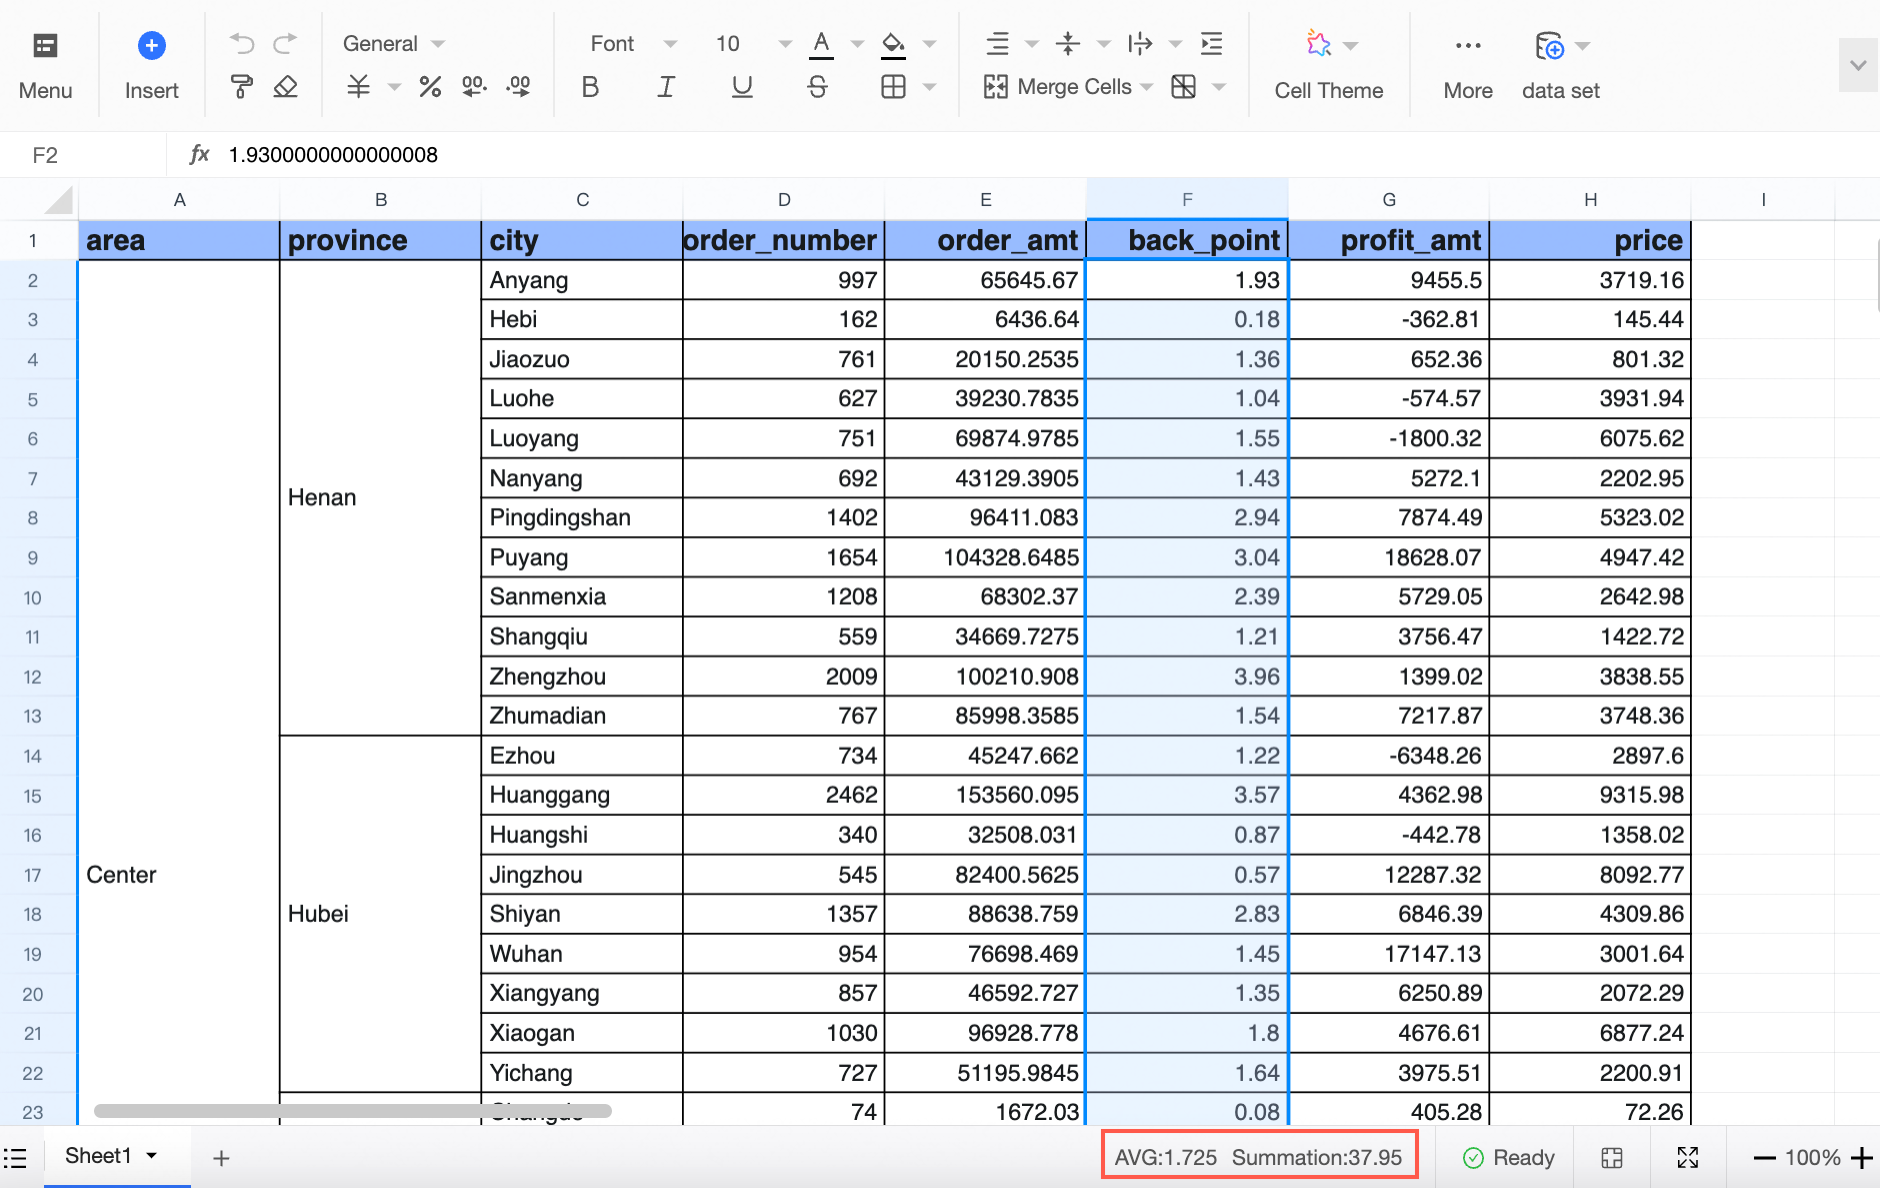
Insert free-form cells
Free-form cells are a paid add-on for Quick BI Pro and Quick BI Enterprise Standard.
(Optional) Set up the report layout before you insert free-form cells.
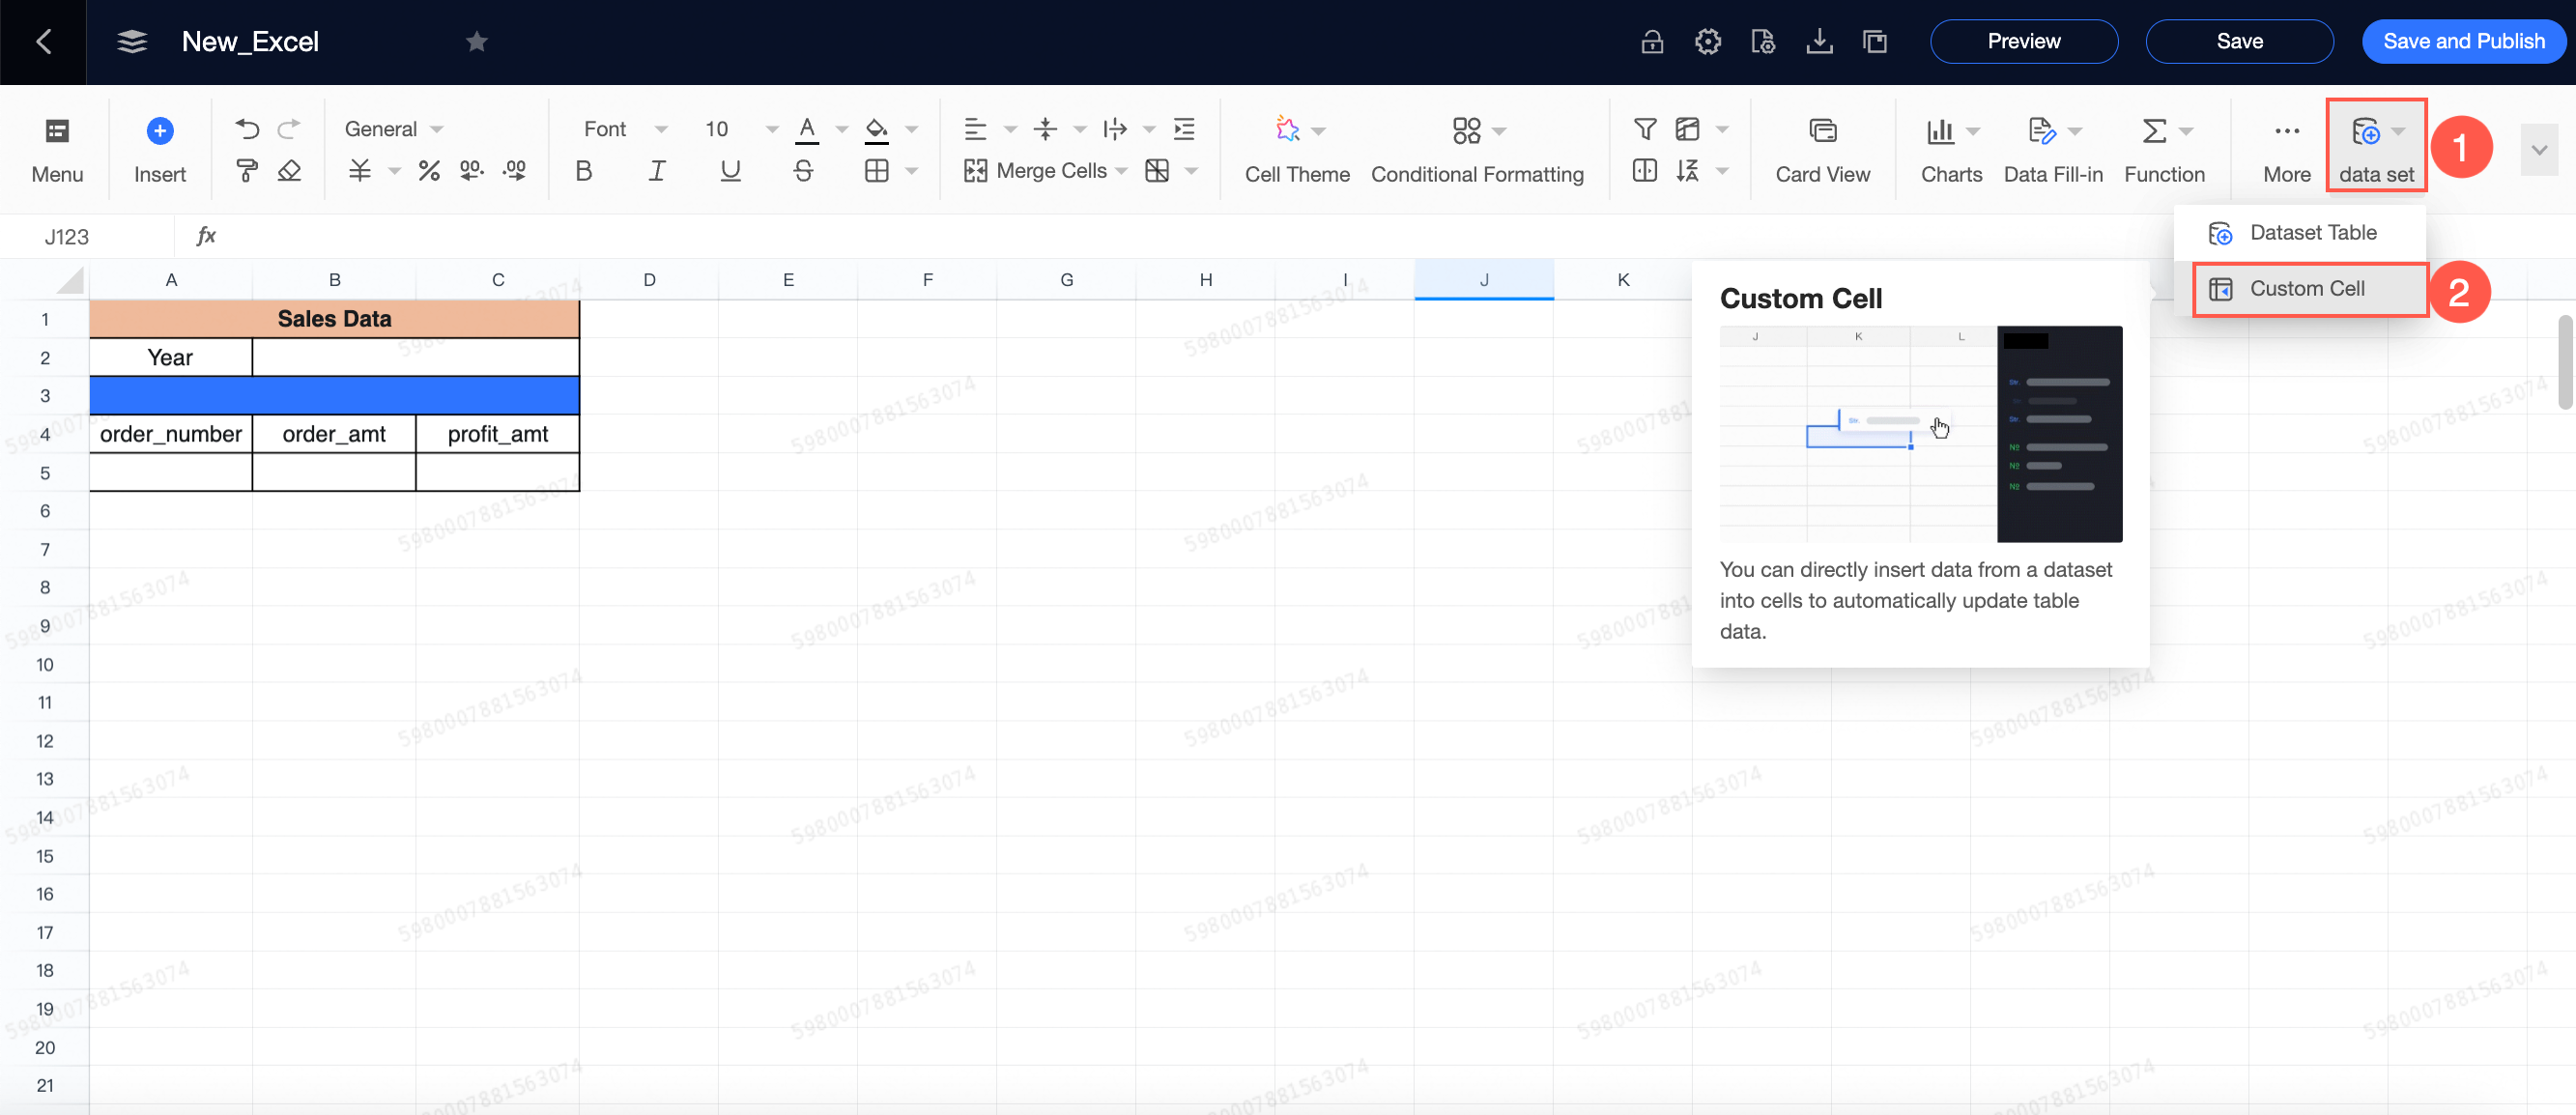
On the workbook editing page, click ①Dataset > ②Free-form Cell.
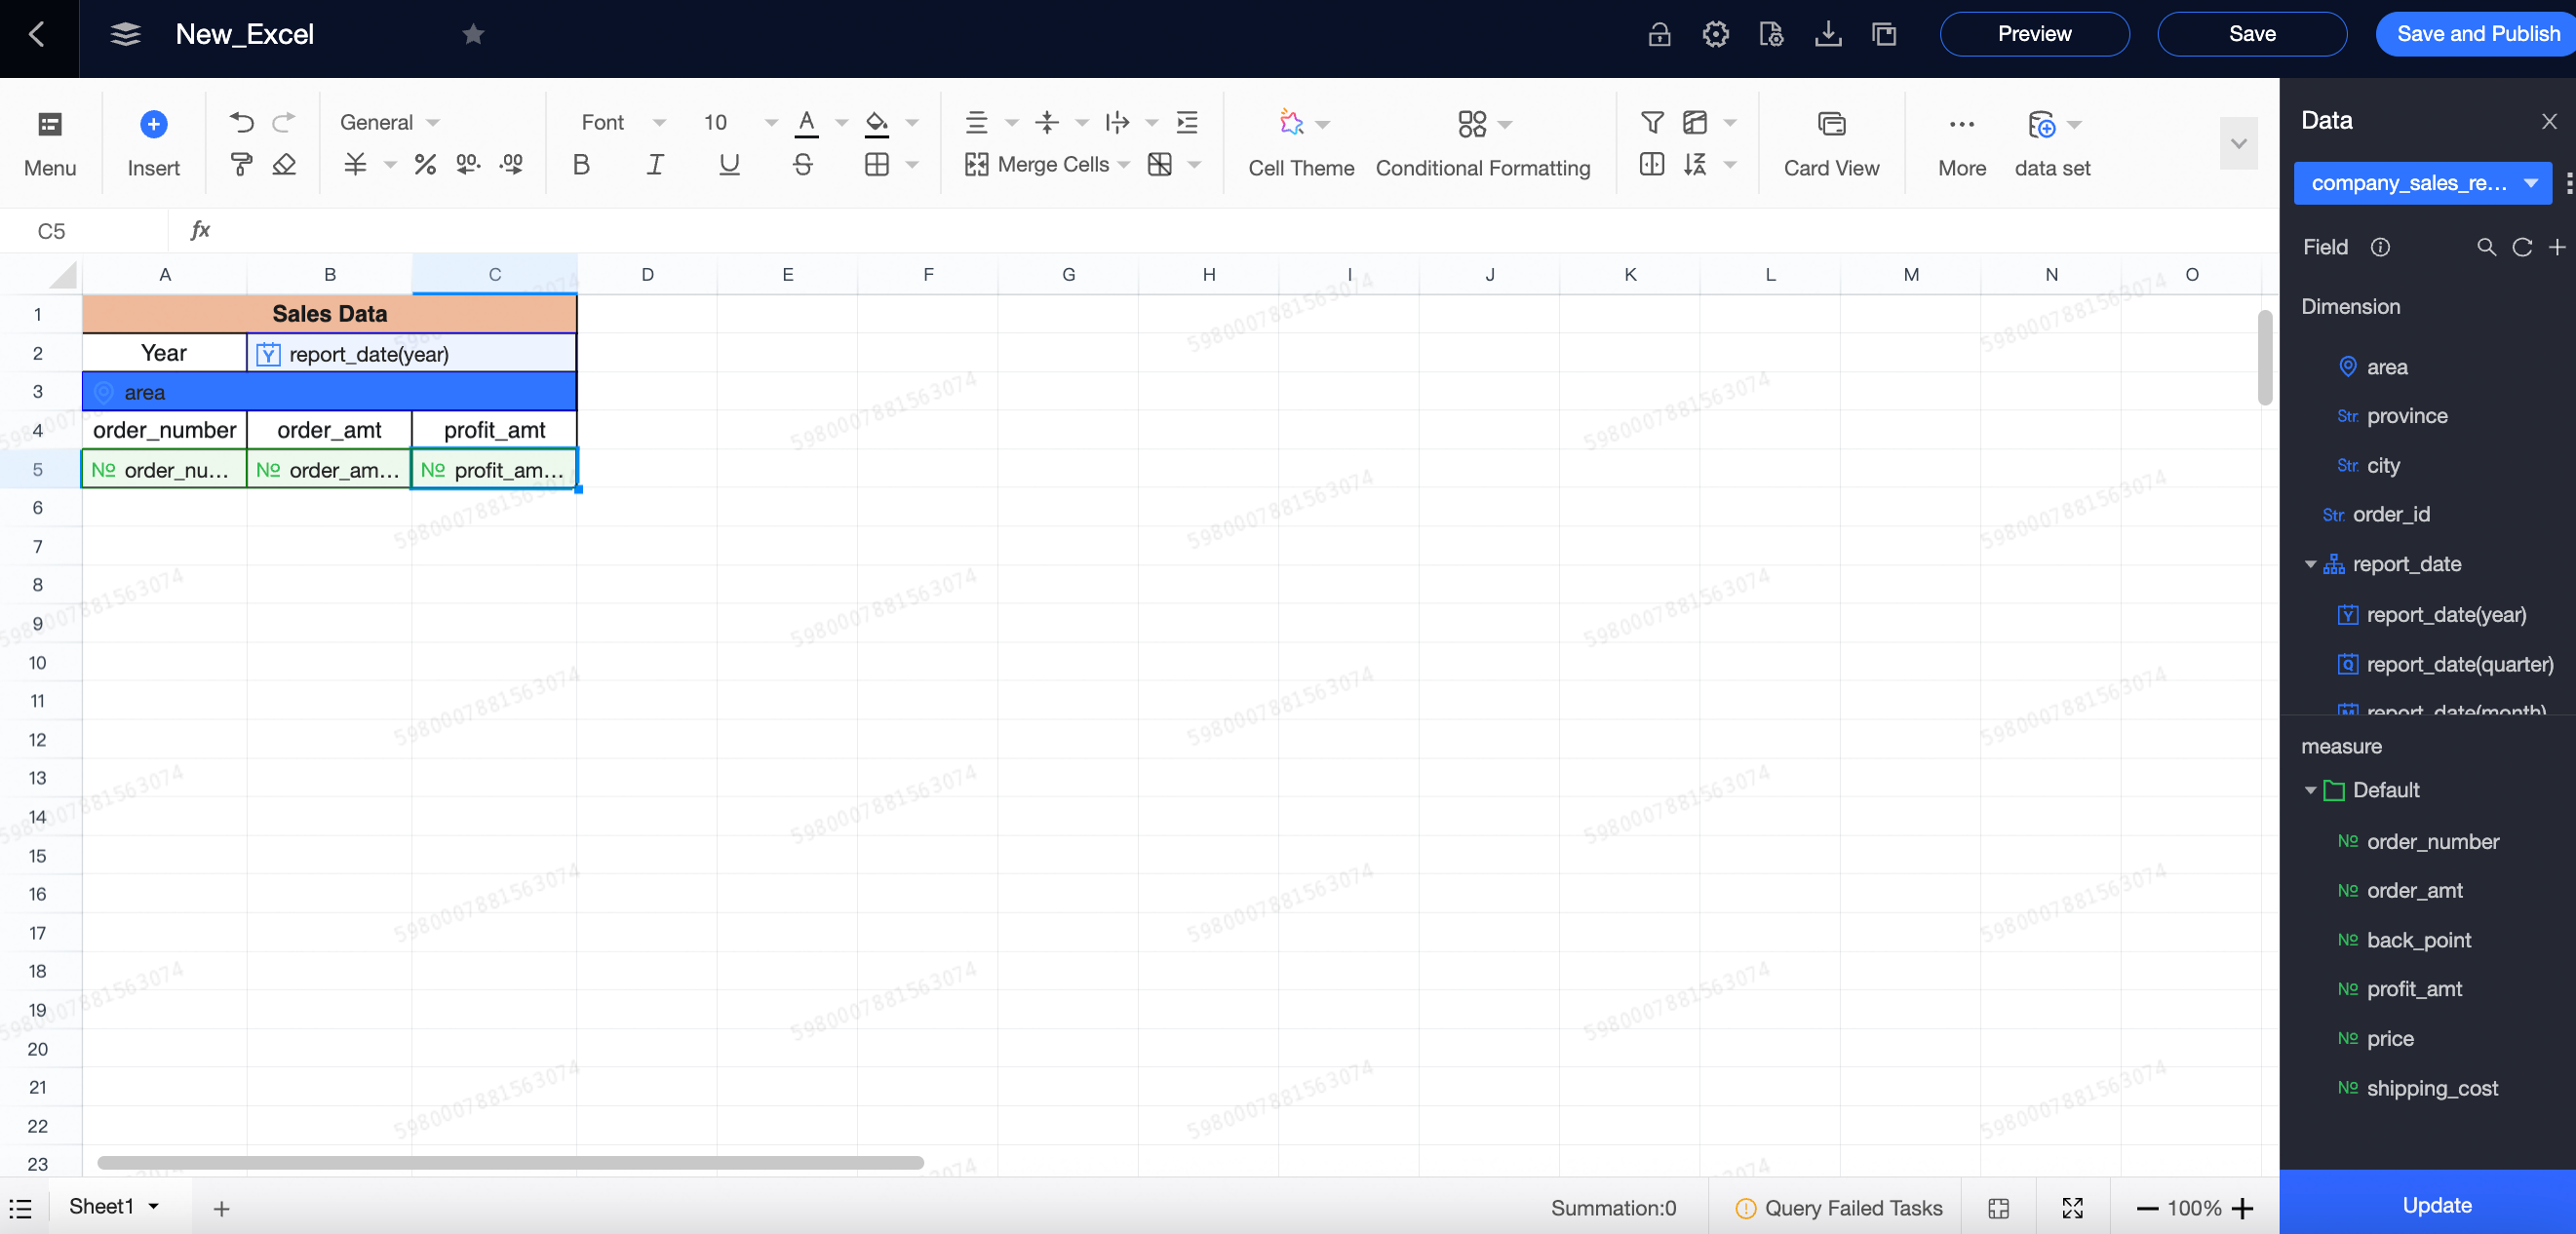
In the Data panel, click Select a dataset and select the target dataset from the drop-down list.
Select the required dimension and measure fields, and then double-click or drag the fields to the workbook editing area.
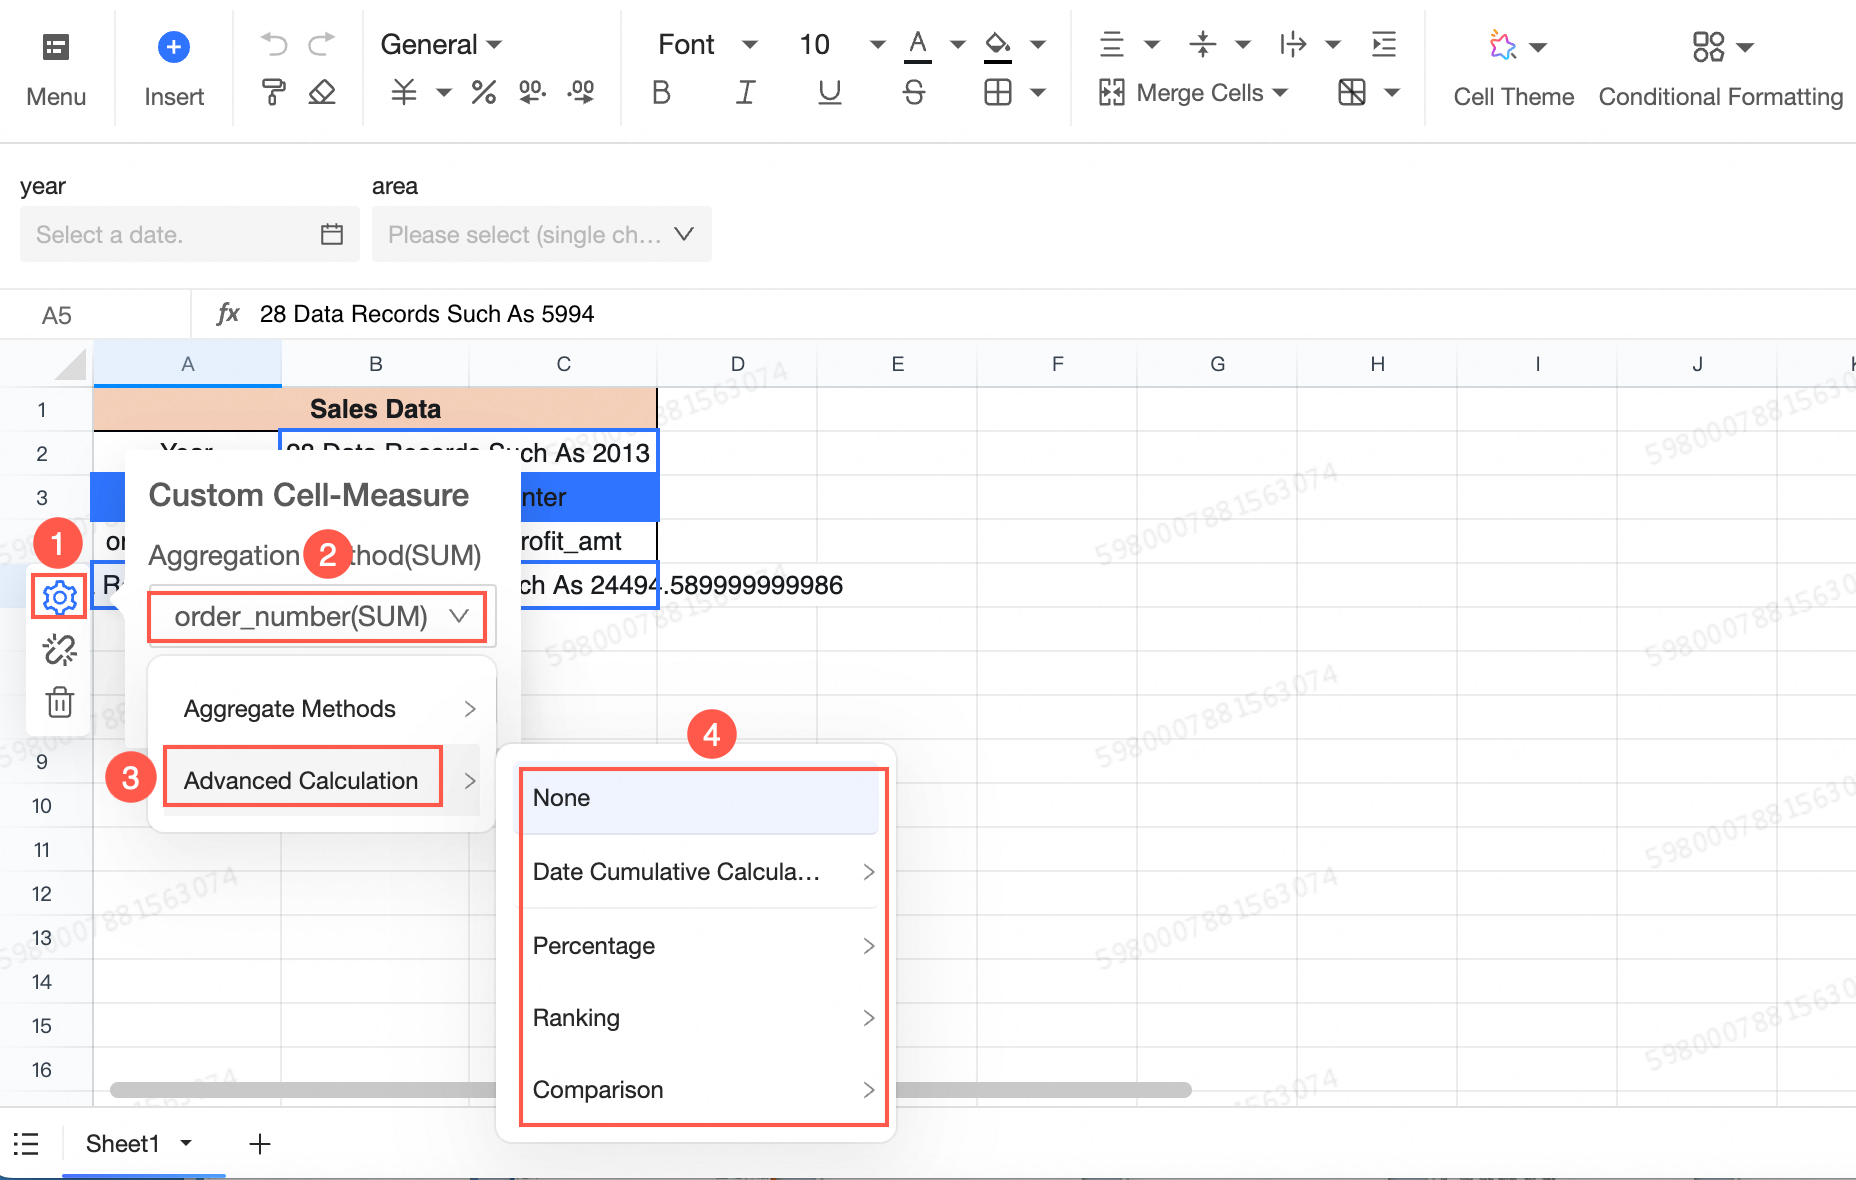
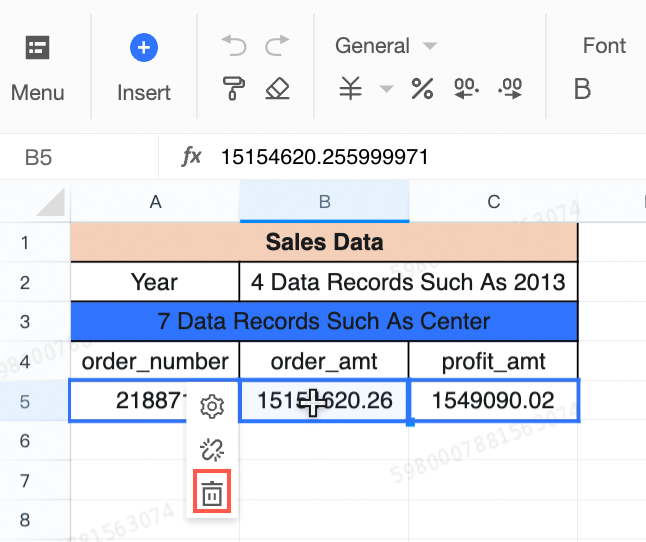
You can configure a field's aggregation method, advanced calculation, and association, or delete it.
To configure the aggregation method, hover over a measure, click the
icon, and configure the settings.Measure fields support multiple aggregation methods, such as Sum, Average, Count, Count Distinct, Max, and Min.
To configure an advanced calculation, hover over a measure, click the
icon, and configure the settings.Advanced calculations include date accumulation, Percentage, Rank, and period-over-period comparison.
Parameter
Description
Date accumulation
Calculates the cumulative sum of data from a start date to the current date. For more information, see Date accumulation.
Percentage
Sets the data format to percentage.
Rank
Supports ascending or descending order. For more information, see Data Ranking.
Period-over-period comparison
Configures a period-over-period comparison for the data. For more information, see period-over-period comparison.
You can associate fields.
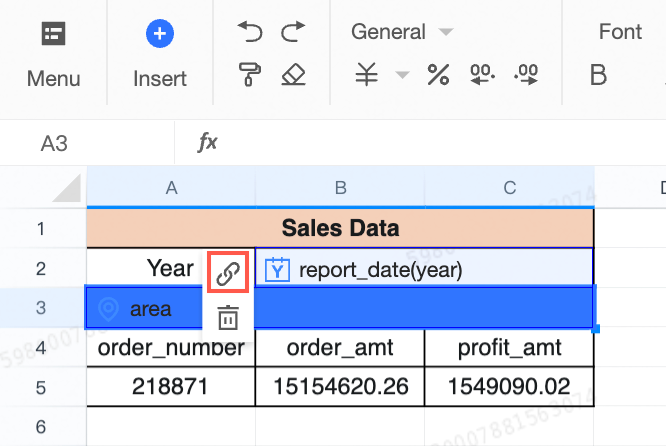
Click Associate to enter Association Mode.
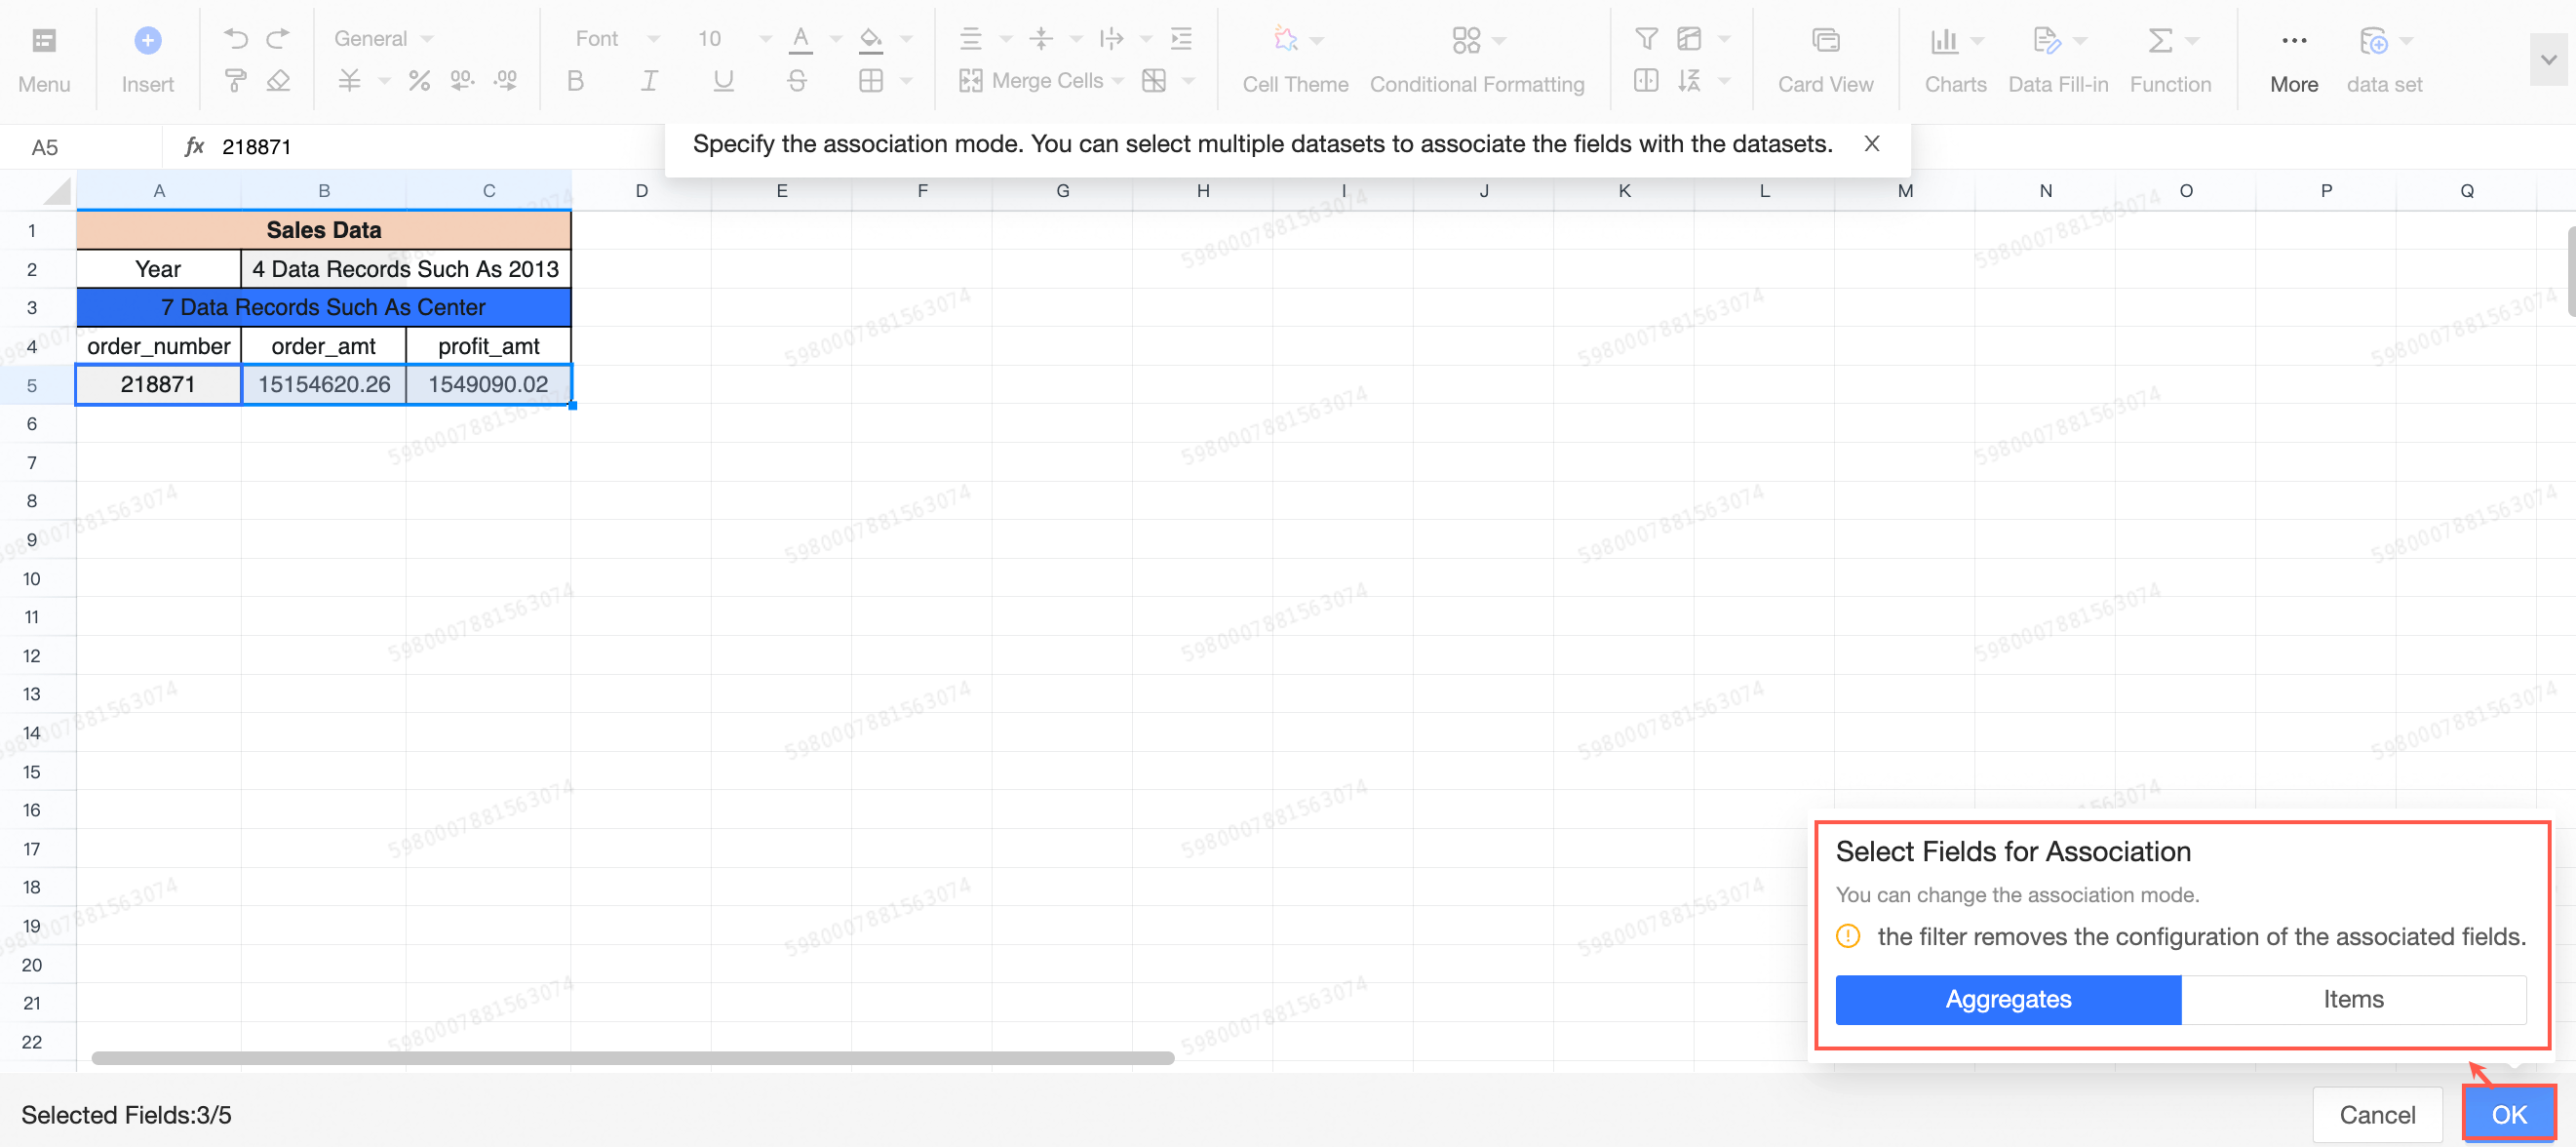
Hover over the confirm association button to switch between aggregation data and detail data.
Click Confirm Association to complete the association. In this example, Order Date (year) is associated with Order Quantity, Order Amount, and Profit Amount.
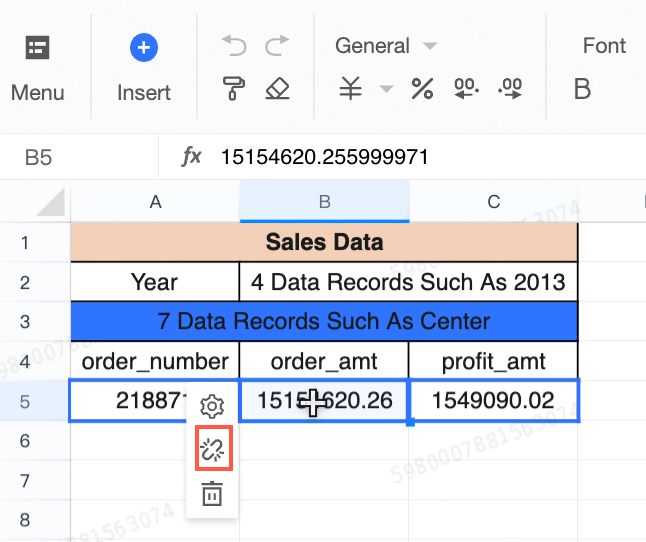
You can also click Cancel Association to remove the association.
You can delete fields that you no longer need.
NoteFor dimension fields, you can configure associations or delete the fields.
For measure fields, you can configure aggregation methods, set up associations, or delete the fields.
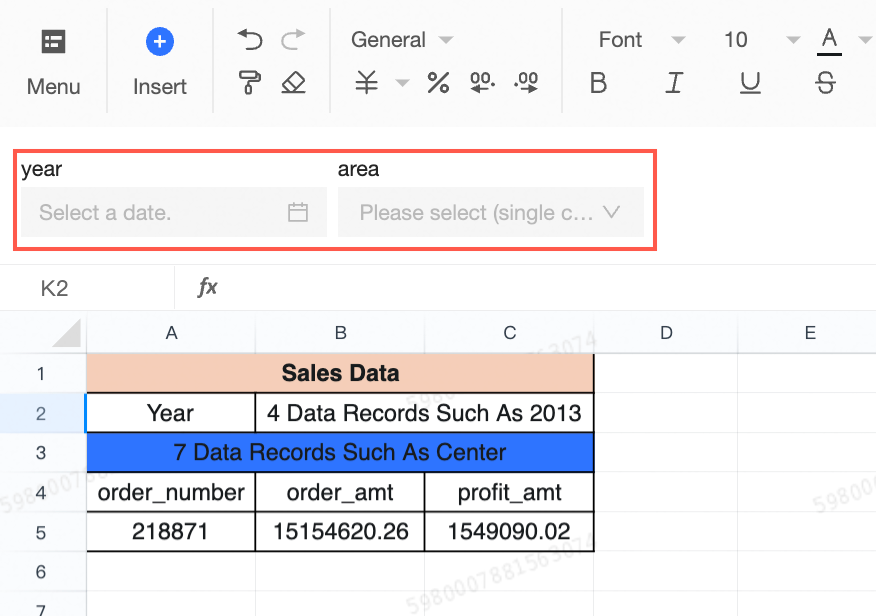
(Optional) You can add query components. This example adds two query conditions: Year and Region.
Click Update. The workbook updates automatically.
Click Save.
Create a card view.
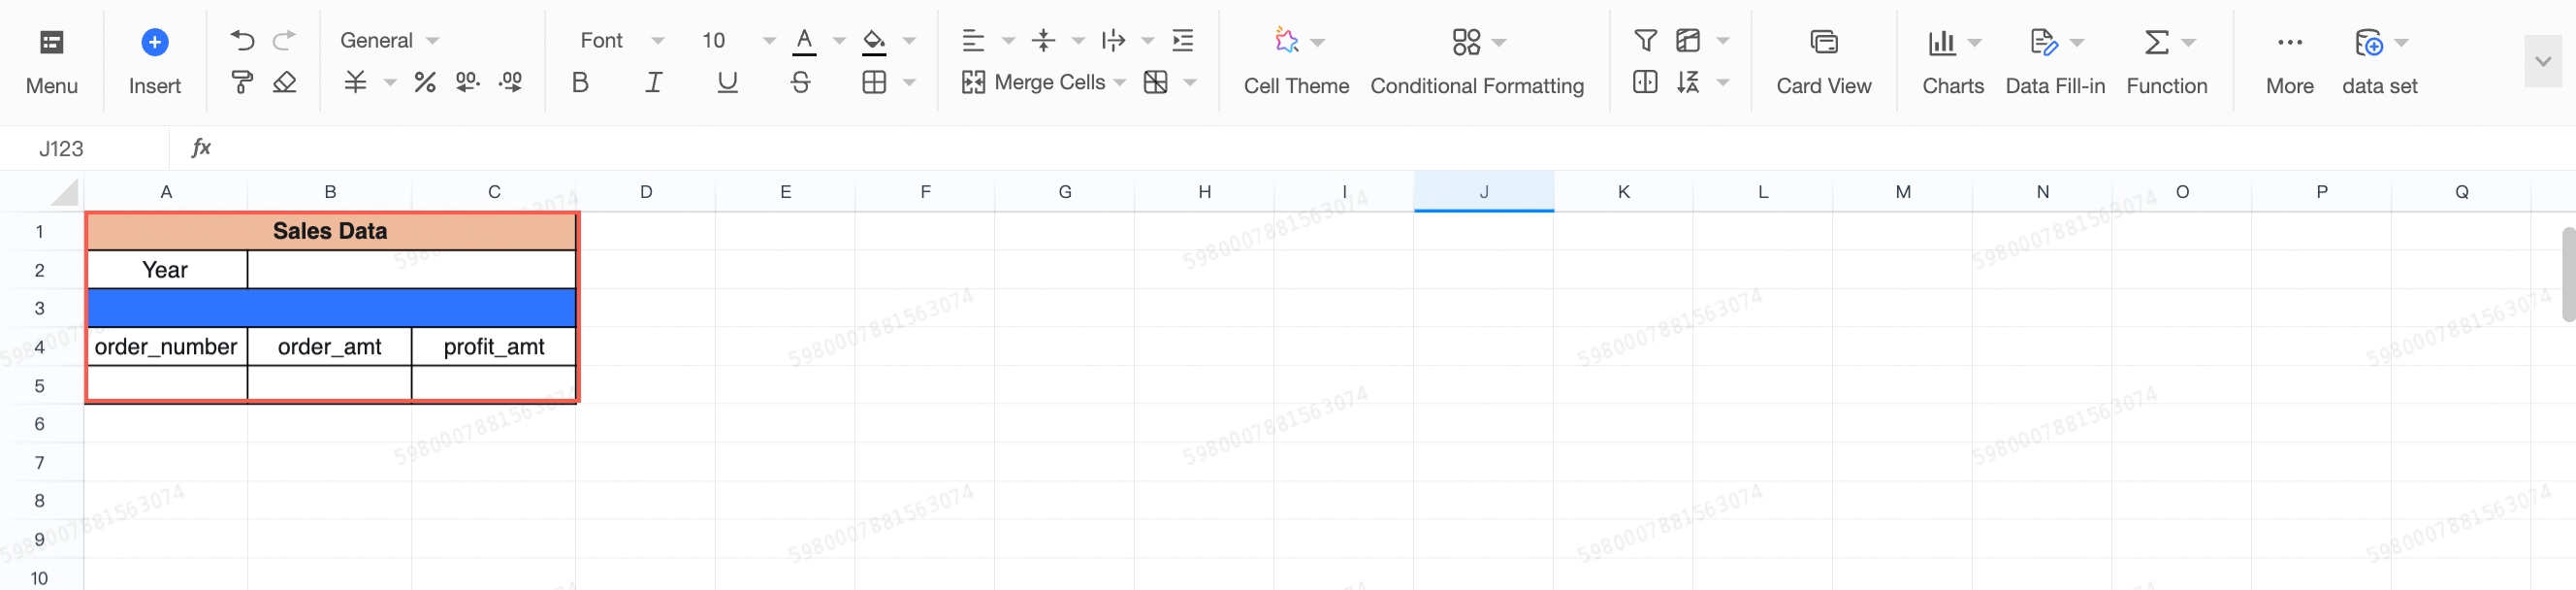
You must merge cells before adding fields to them, as cells that contain fields cannot be merged.
 icon, and configure the settings.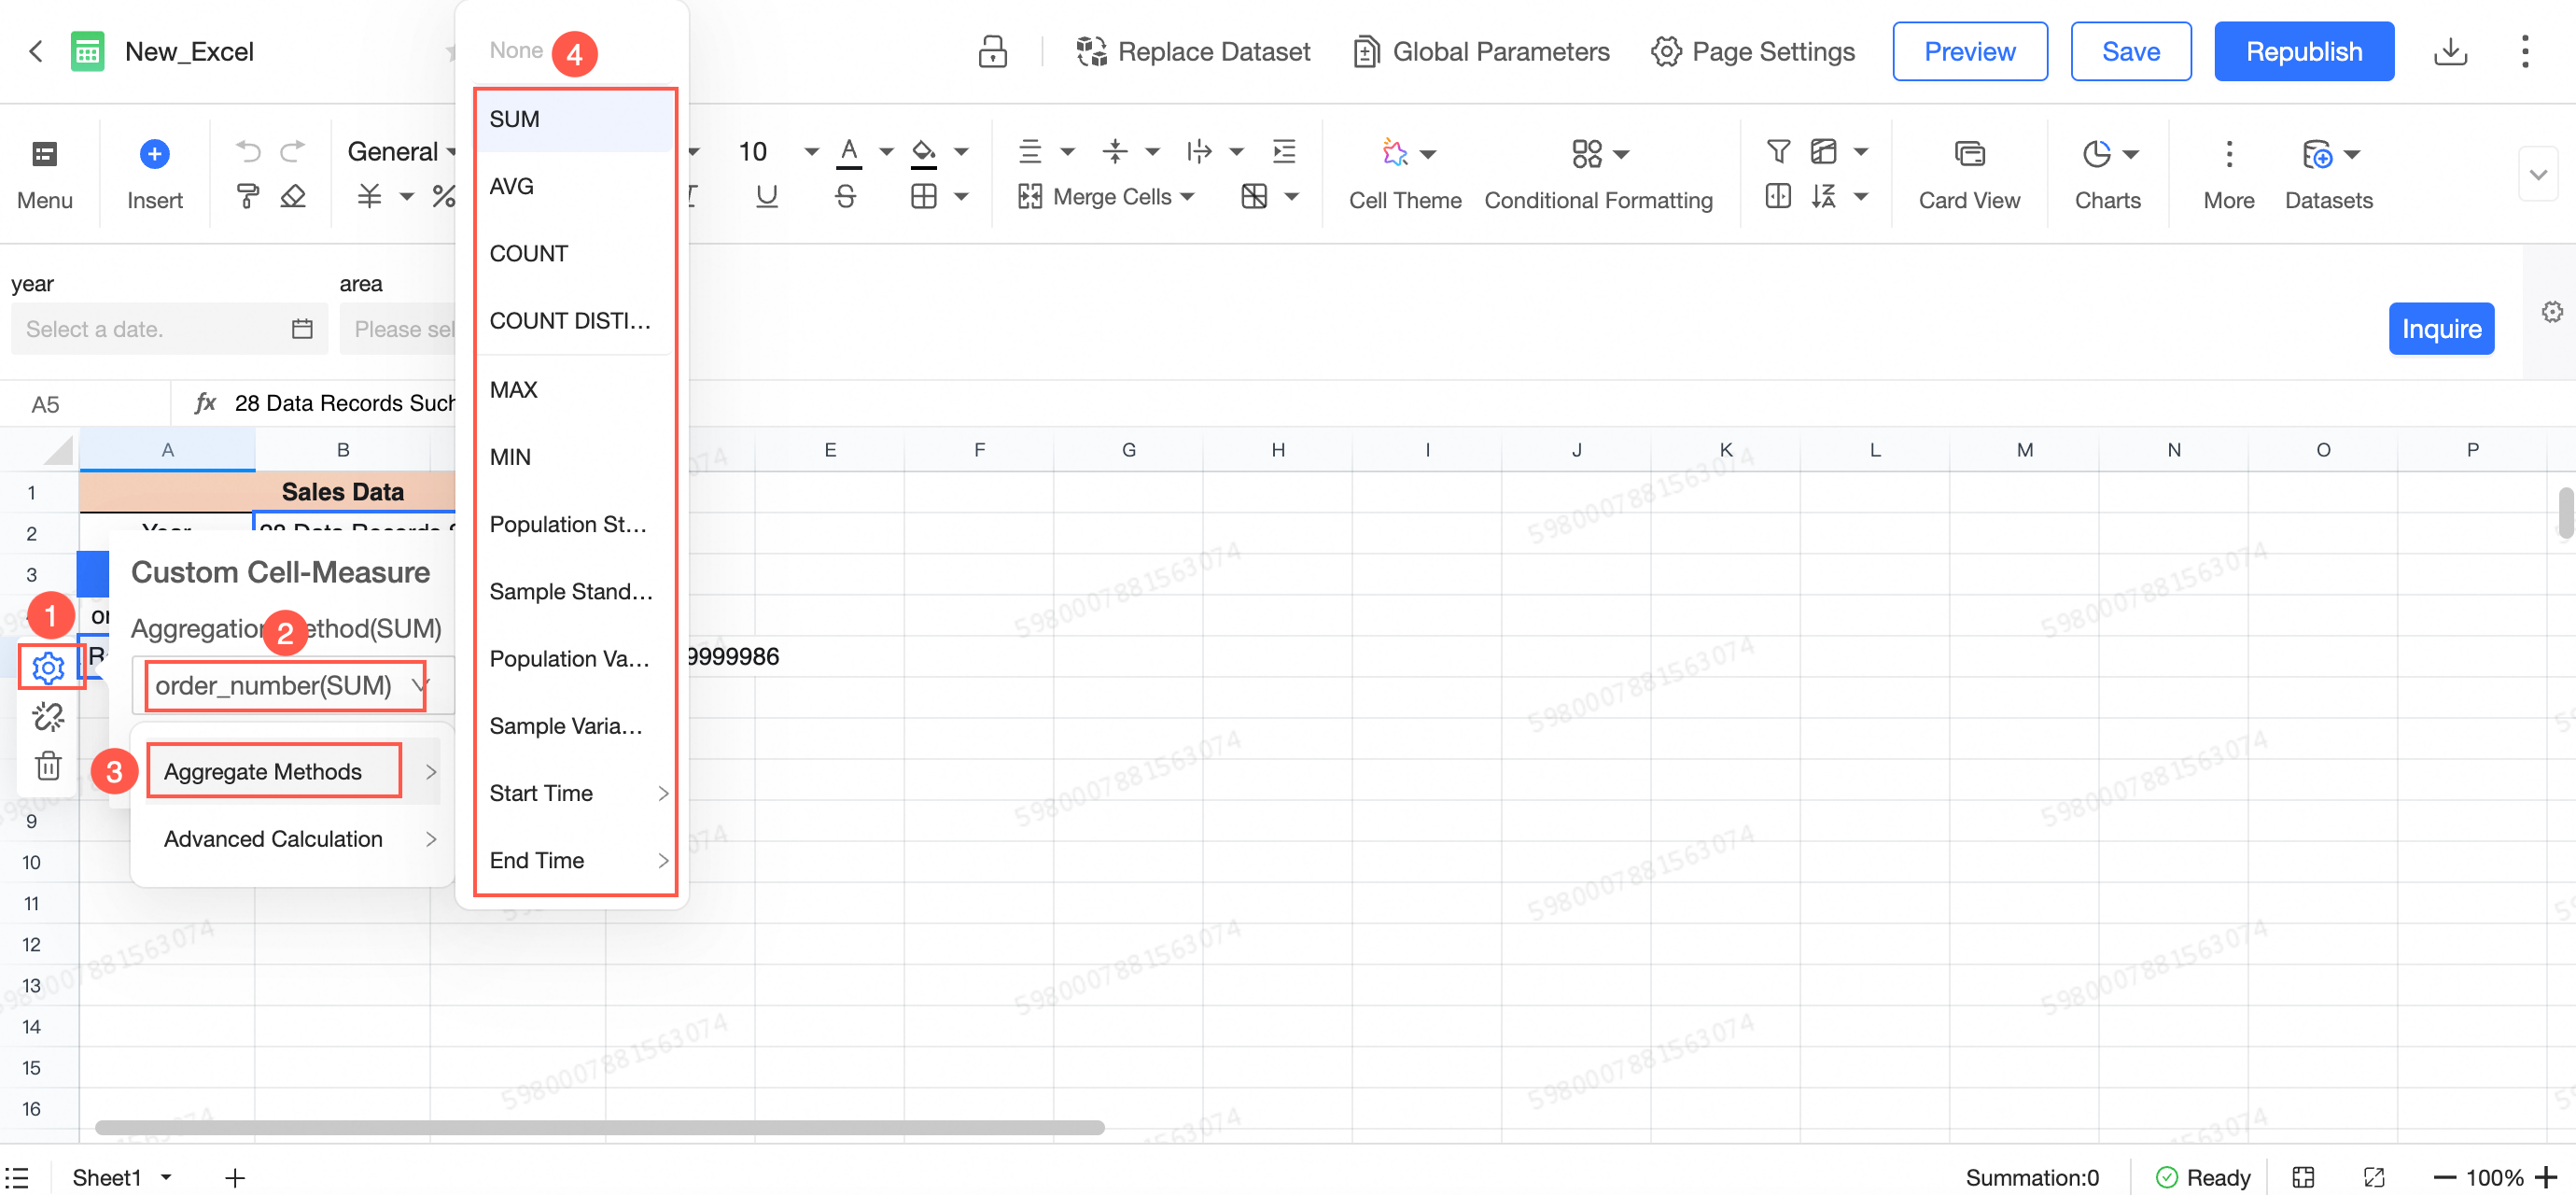
Card view
Use a card view to create multi-column reports and key performance indicator (KPI) cards in visual analysis reports.
Card view is a paid add-on for Quick BI Pro and Quick BI Enterprise Standard.
Entry point
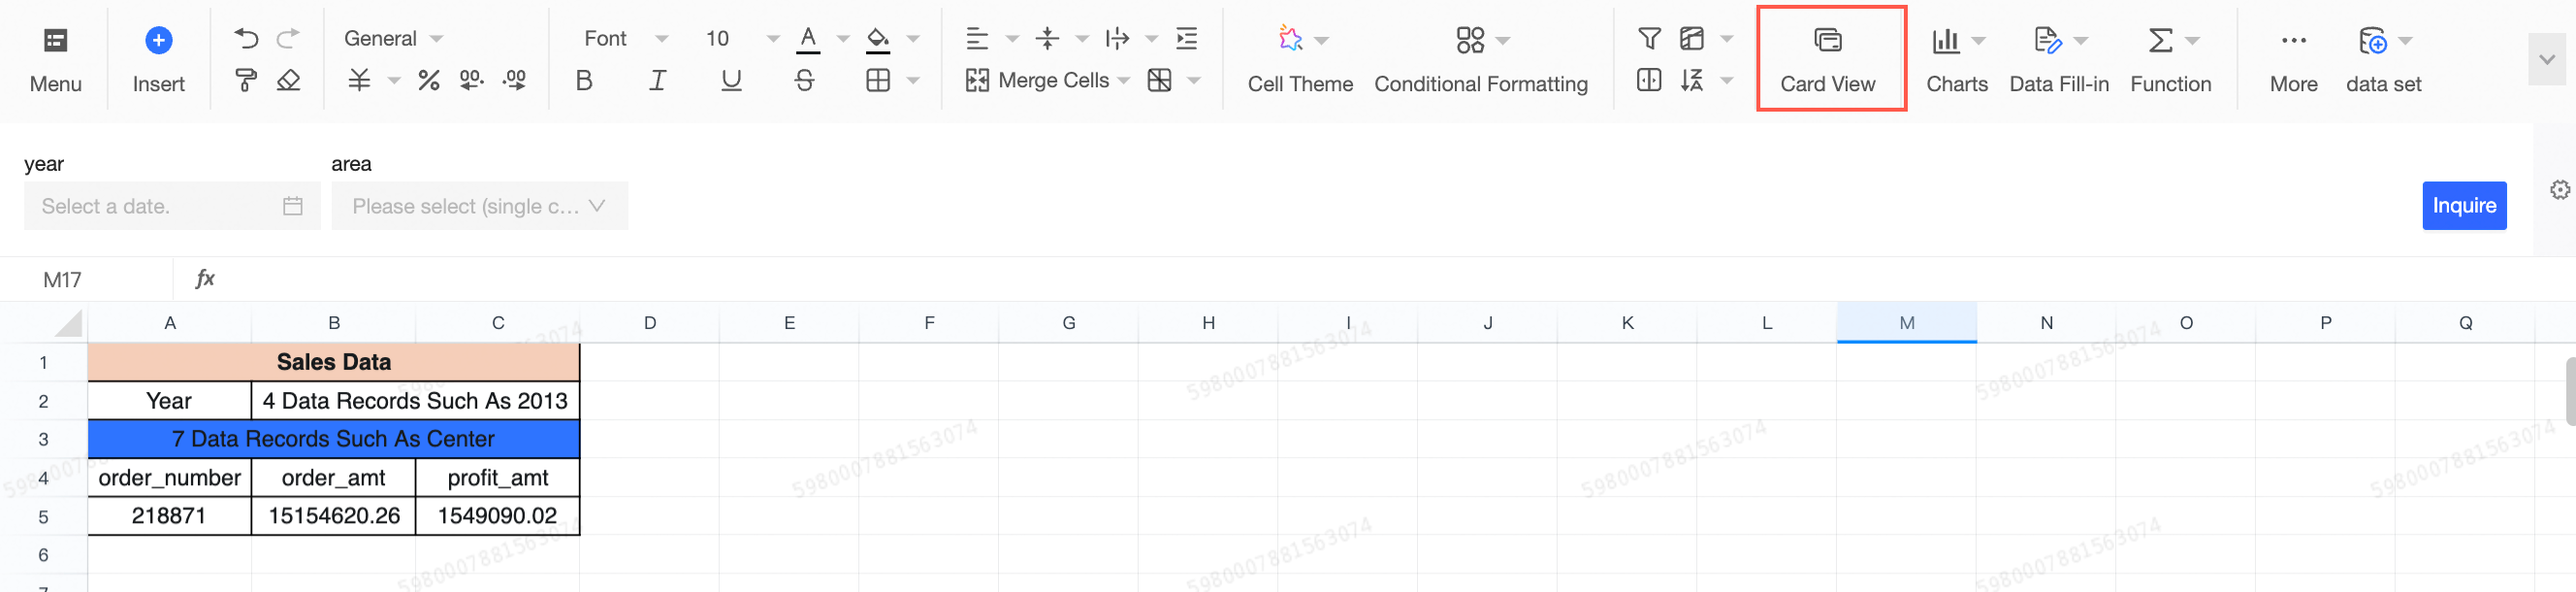
In free-form cell mode, the Card View icon appears in the toolbar.
Procedure
Click Card View to go to the card view creation page.
Create the card view.
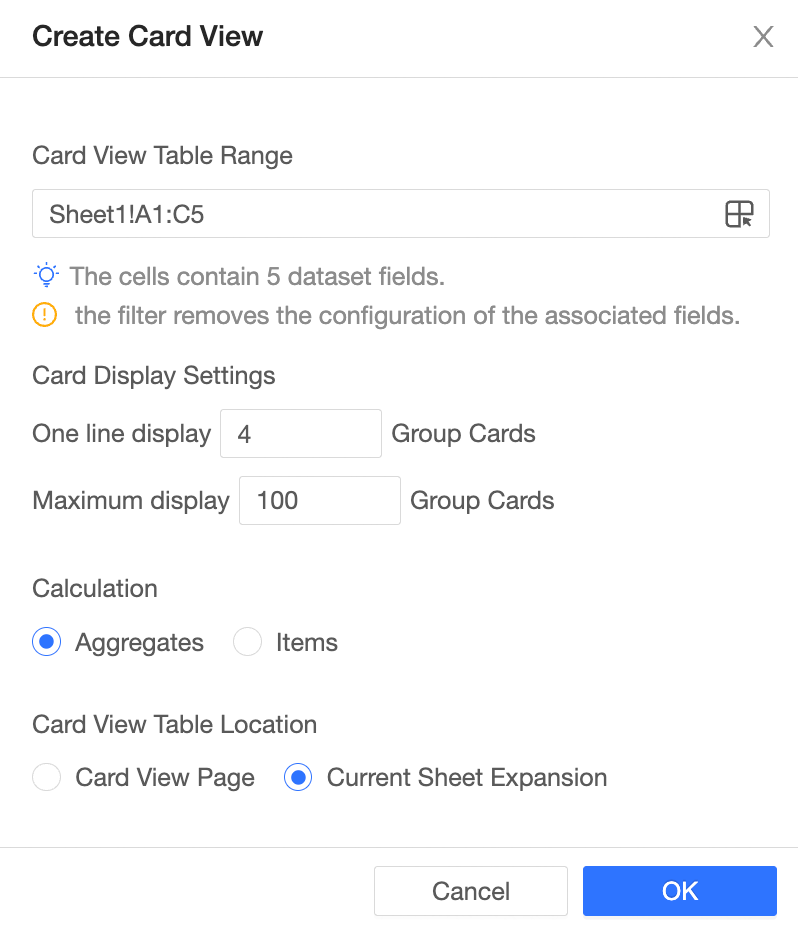
Select a base table for the card view to define its constraints.
Create the card view first, and then select the data range.
Alternatively, select the data range first, and then create the card view.
NoteFields from different datasets do not support association.
Configure the card display. You can customize the number of card groups to display per row and the maximum total number of card groups to display.
Set the calculation method to Aggregation or Detail.
Choose a location for the pivot table: Create Card View Page or Expand in Current Sheet.
In this example, Create Card View Page is selected.
Click OK.
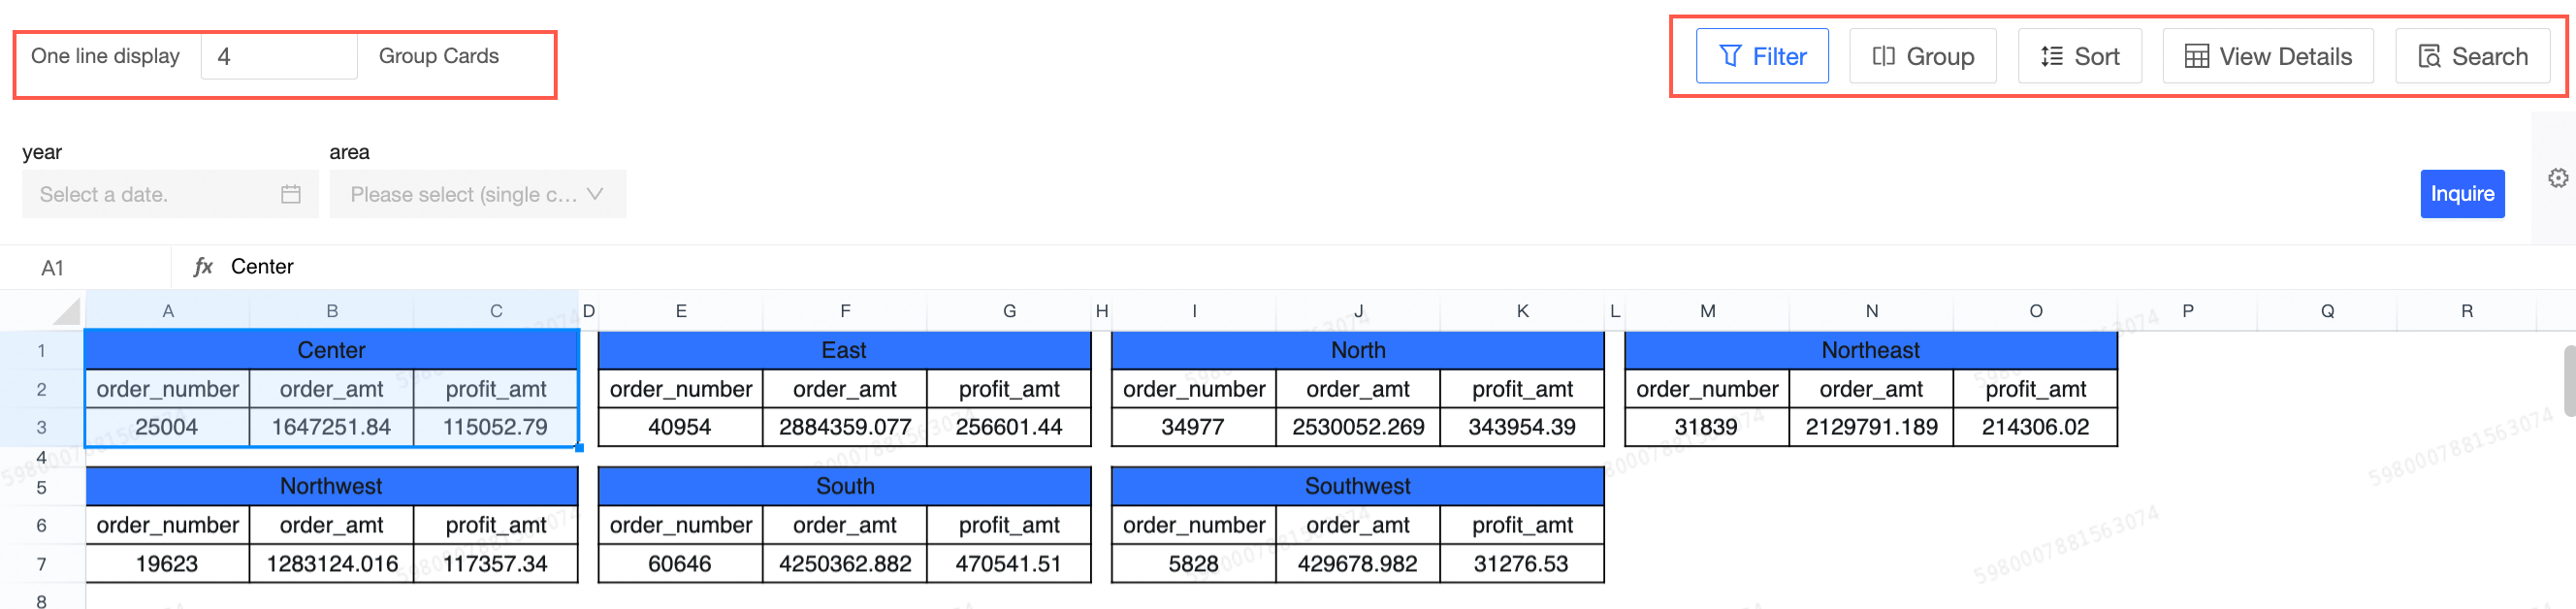
Configure the card page view. If you chose to place the pivot table on the Create Card View Page, you can change the number of card groups per row, set up filters, grouping, and sorting, view details, and perform searches.
Next steps
To configure style and analysis settings for the workbook, see Configure Styles and Configure Analytics.