Overview of Q Report Editing
The Q Report editor lets you use the AI assistant to generate analysis outlines, ask XiaoQ questions, obtain smart insights, and create text visualizations. You can also add dashboard charts and configure page styles. After a report is generated with a single click, you can manually refine AI-generated content for practical use.
Prerequisites
You have created a Q Report.
Features
Document editing
Adjust the content and format of your report. For example, change the font size, color, and display style, or work with content from referenced resources.
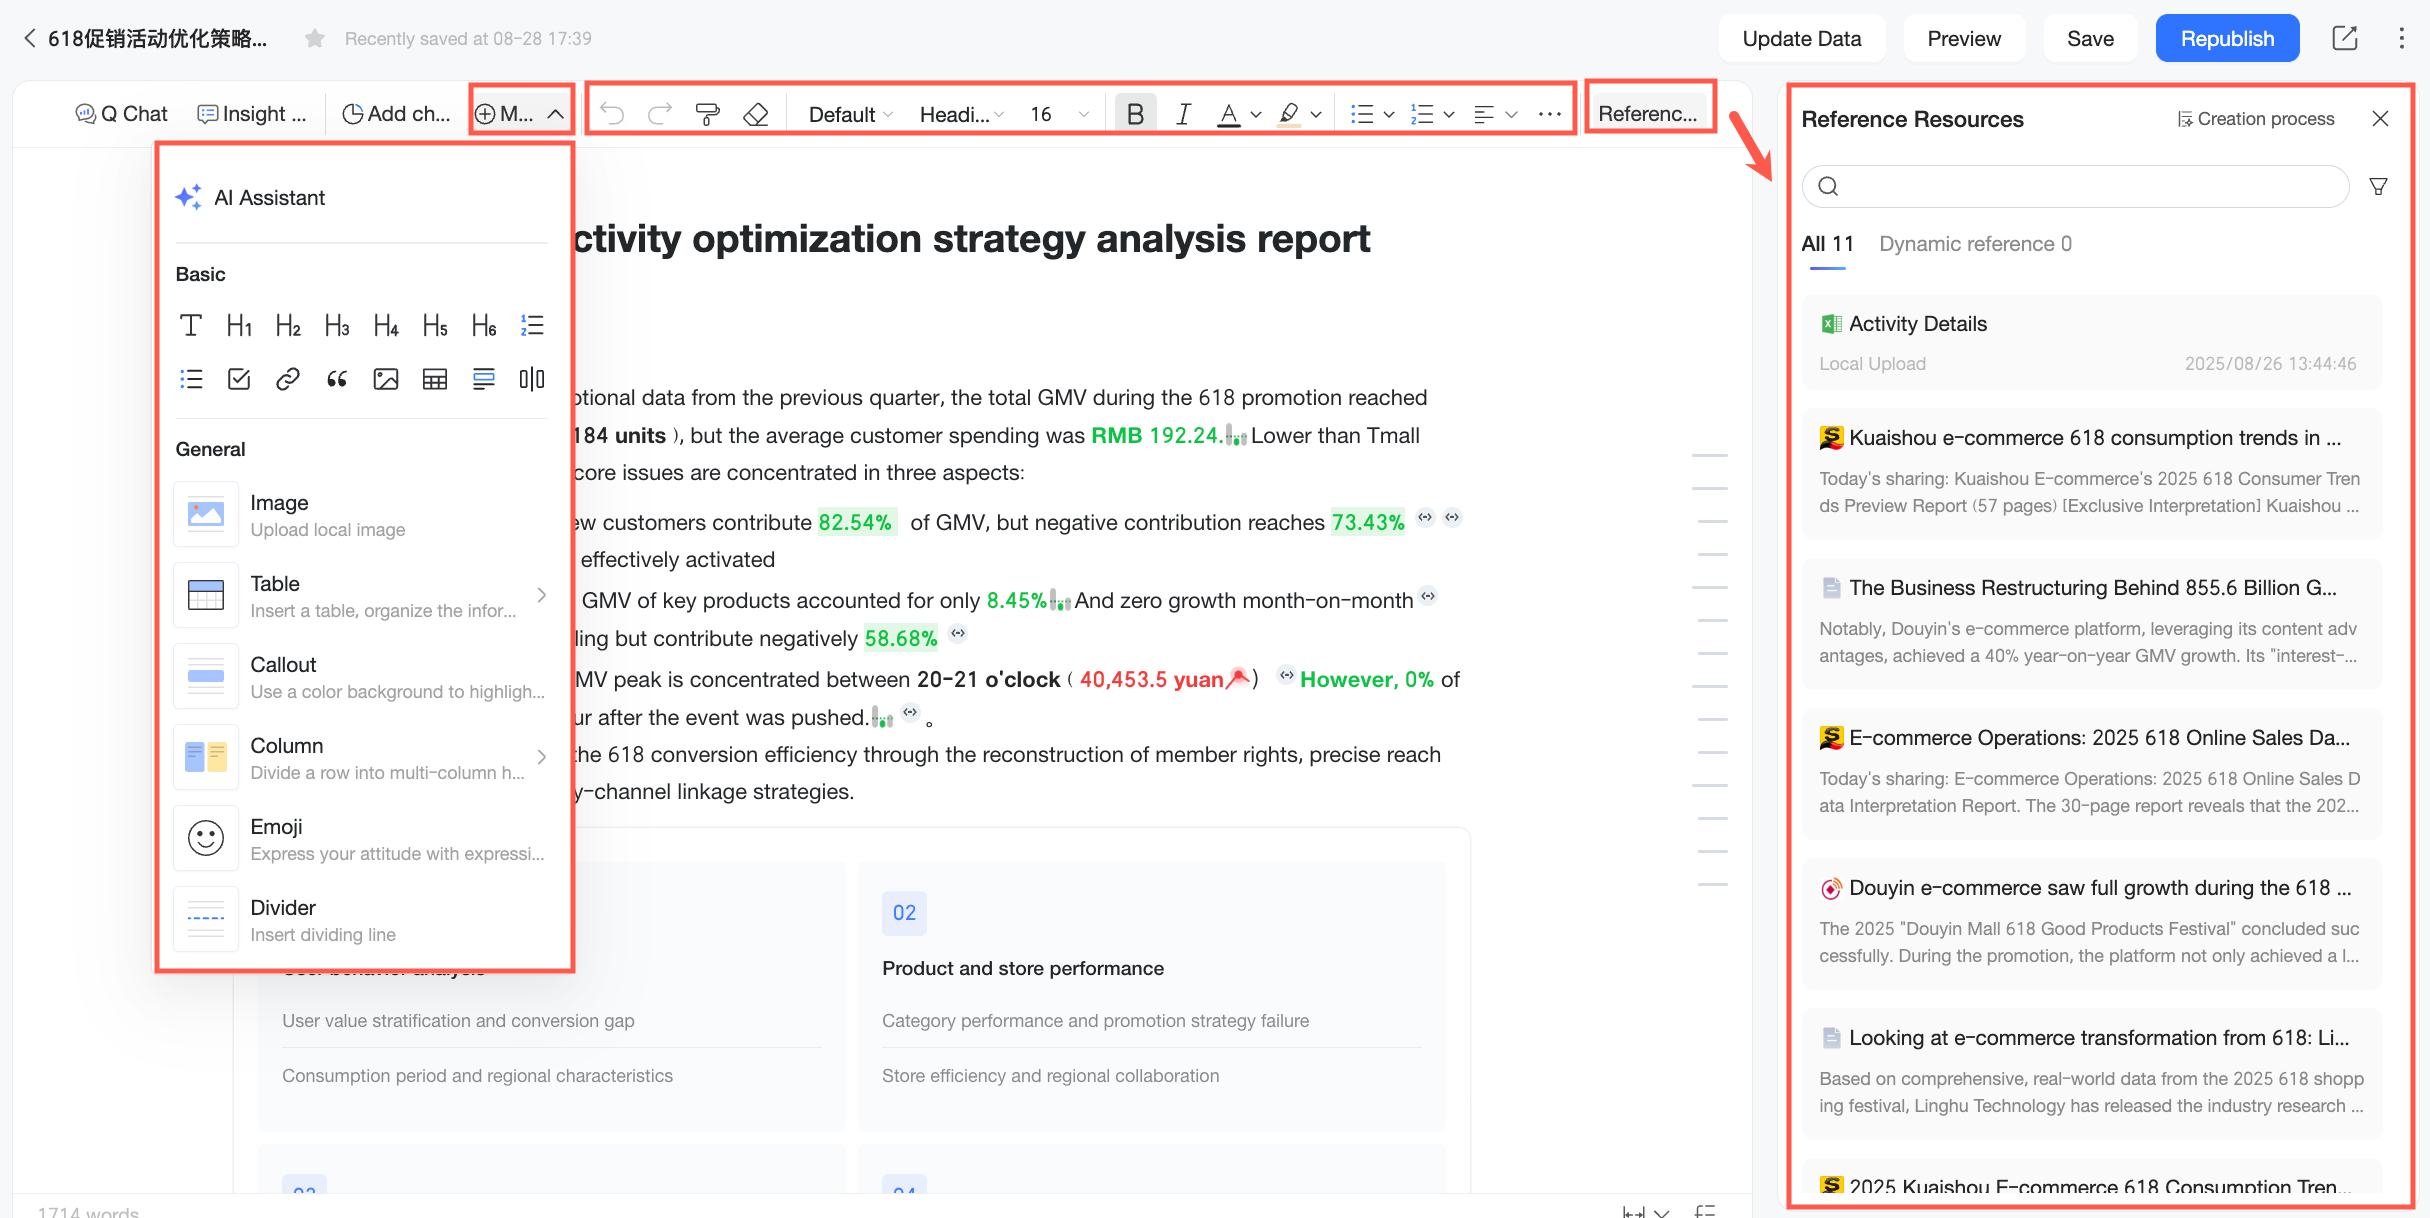
For more information, see Document editing.
AI assistant
Use AI capabilities such as XiaoQ Ask and Smart Insights to generate analysis outlines, ask XiaoQ questions, obtain smart insights, and create text visualizations directly in your report.
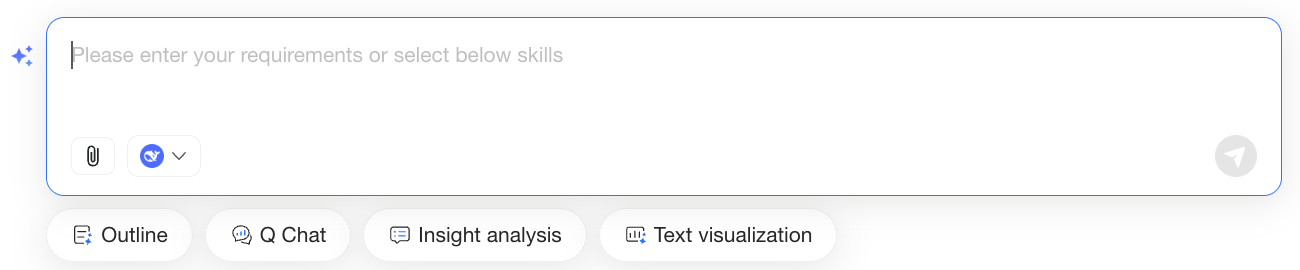
For more information, see AI assistant in reports.
Chart insertion
Add existing dashboard chart components directly into your report to unify data presentation and reduce redundant work.
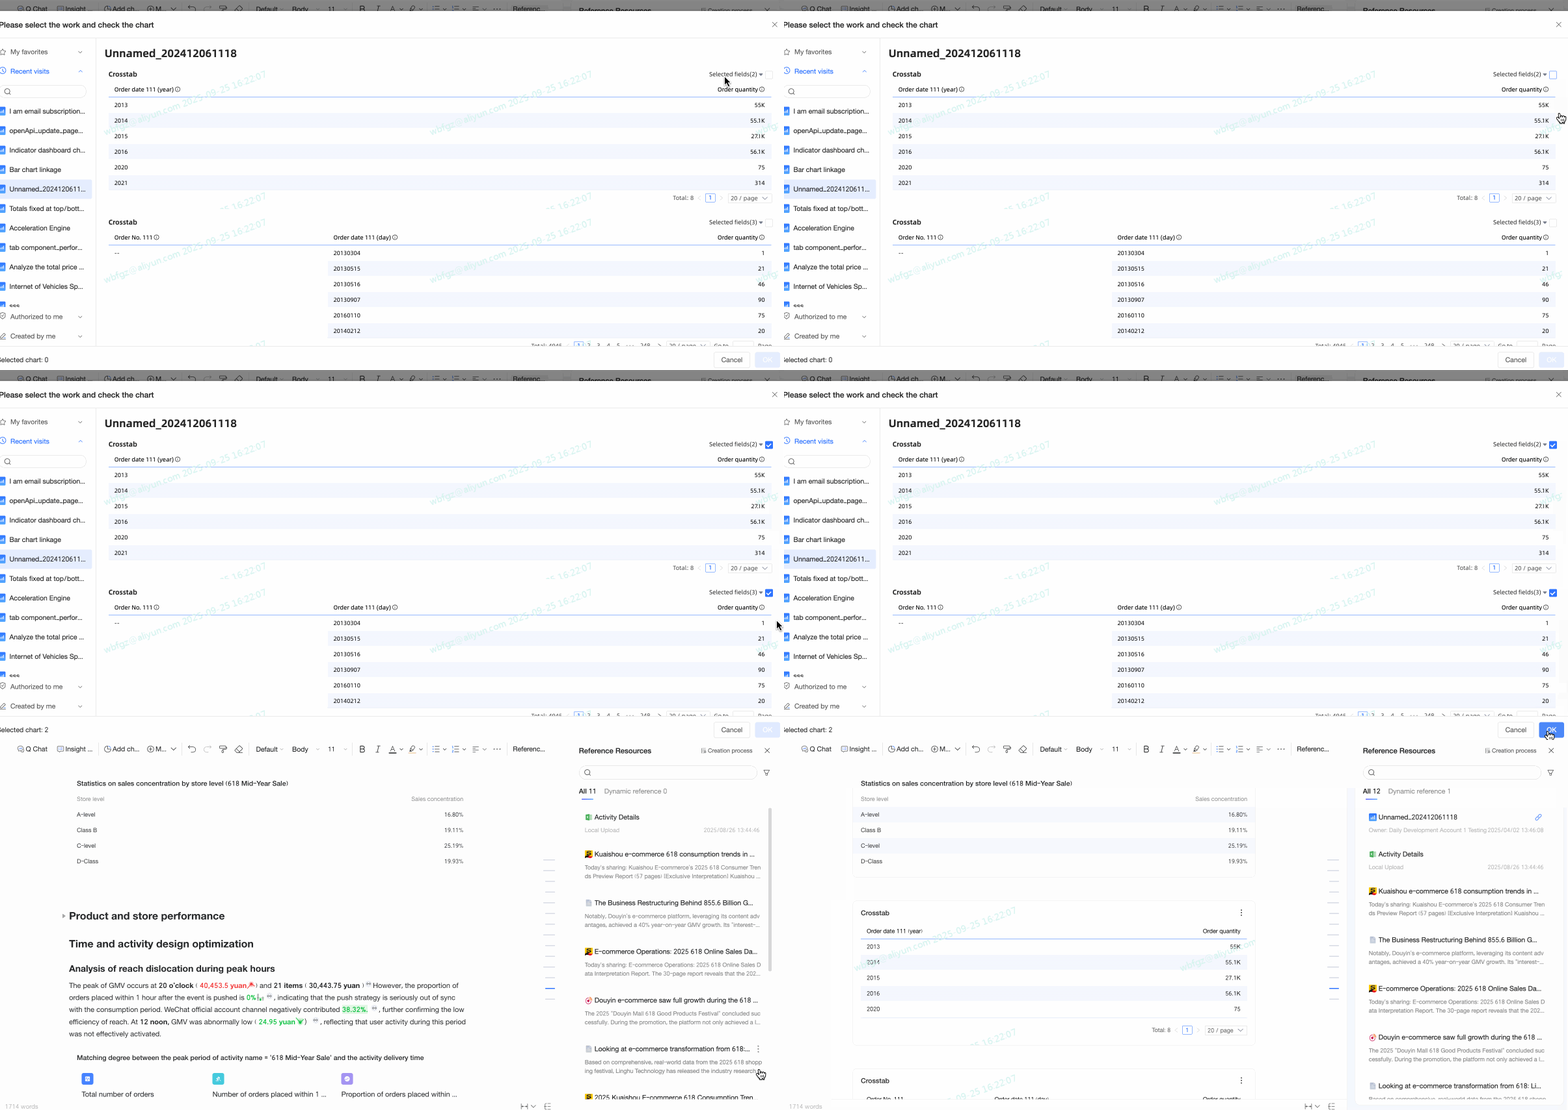
For more information, see Add dashboard charts.
Style configuration
Configure the overall page style and text formatting to enhance the appearance of your report.
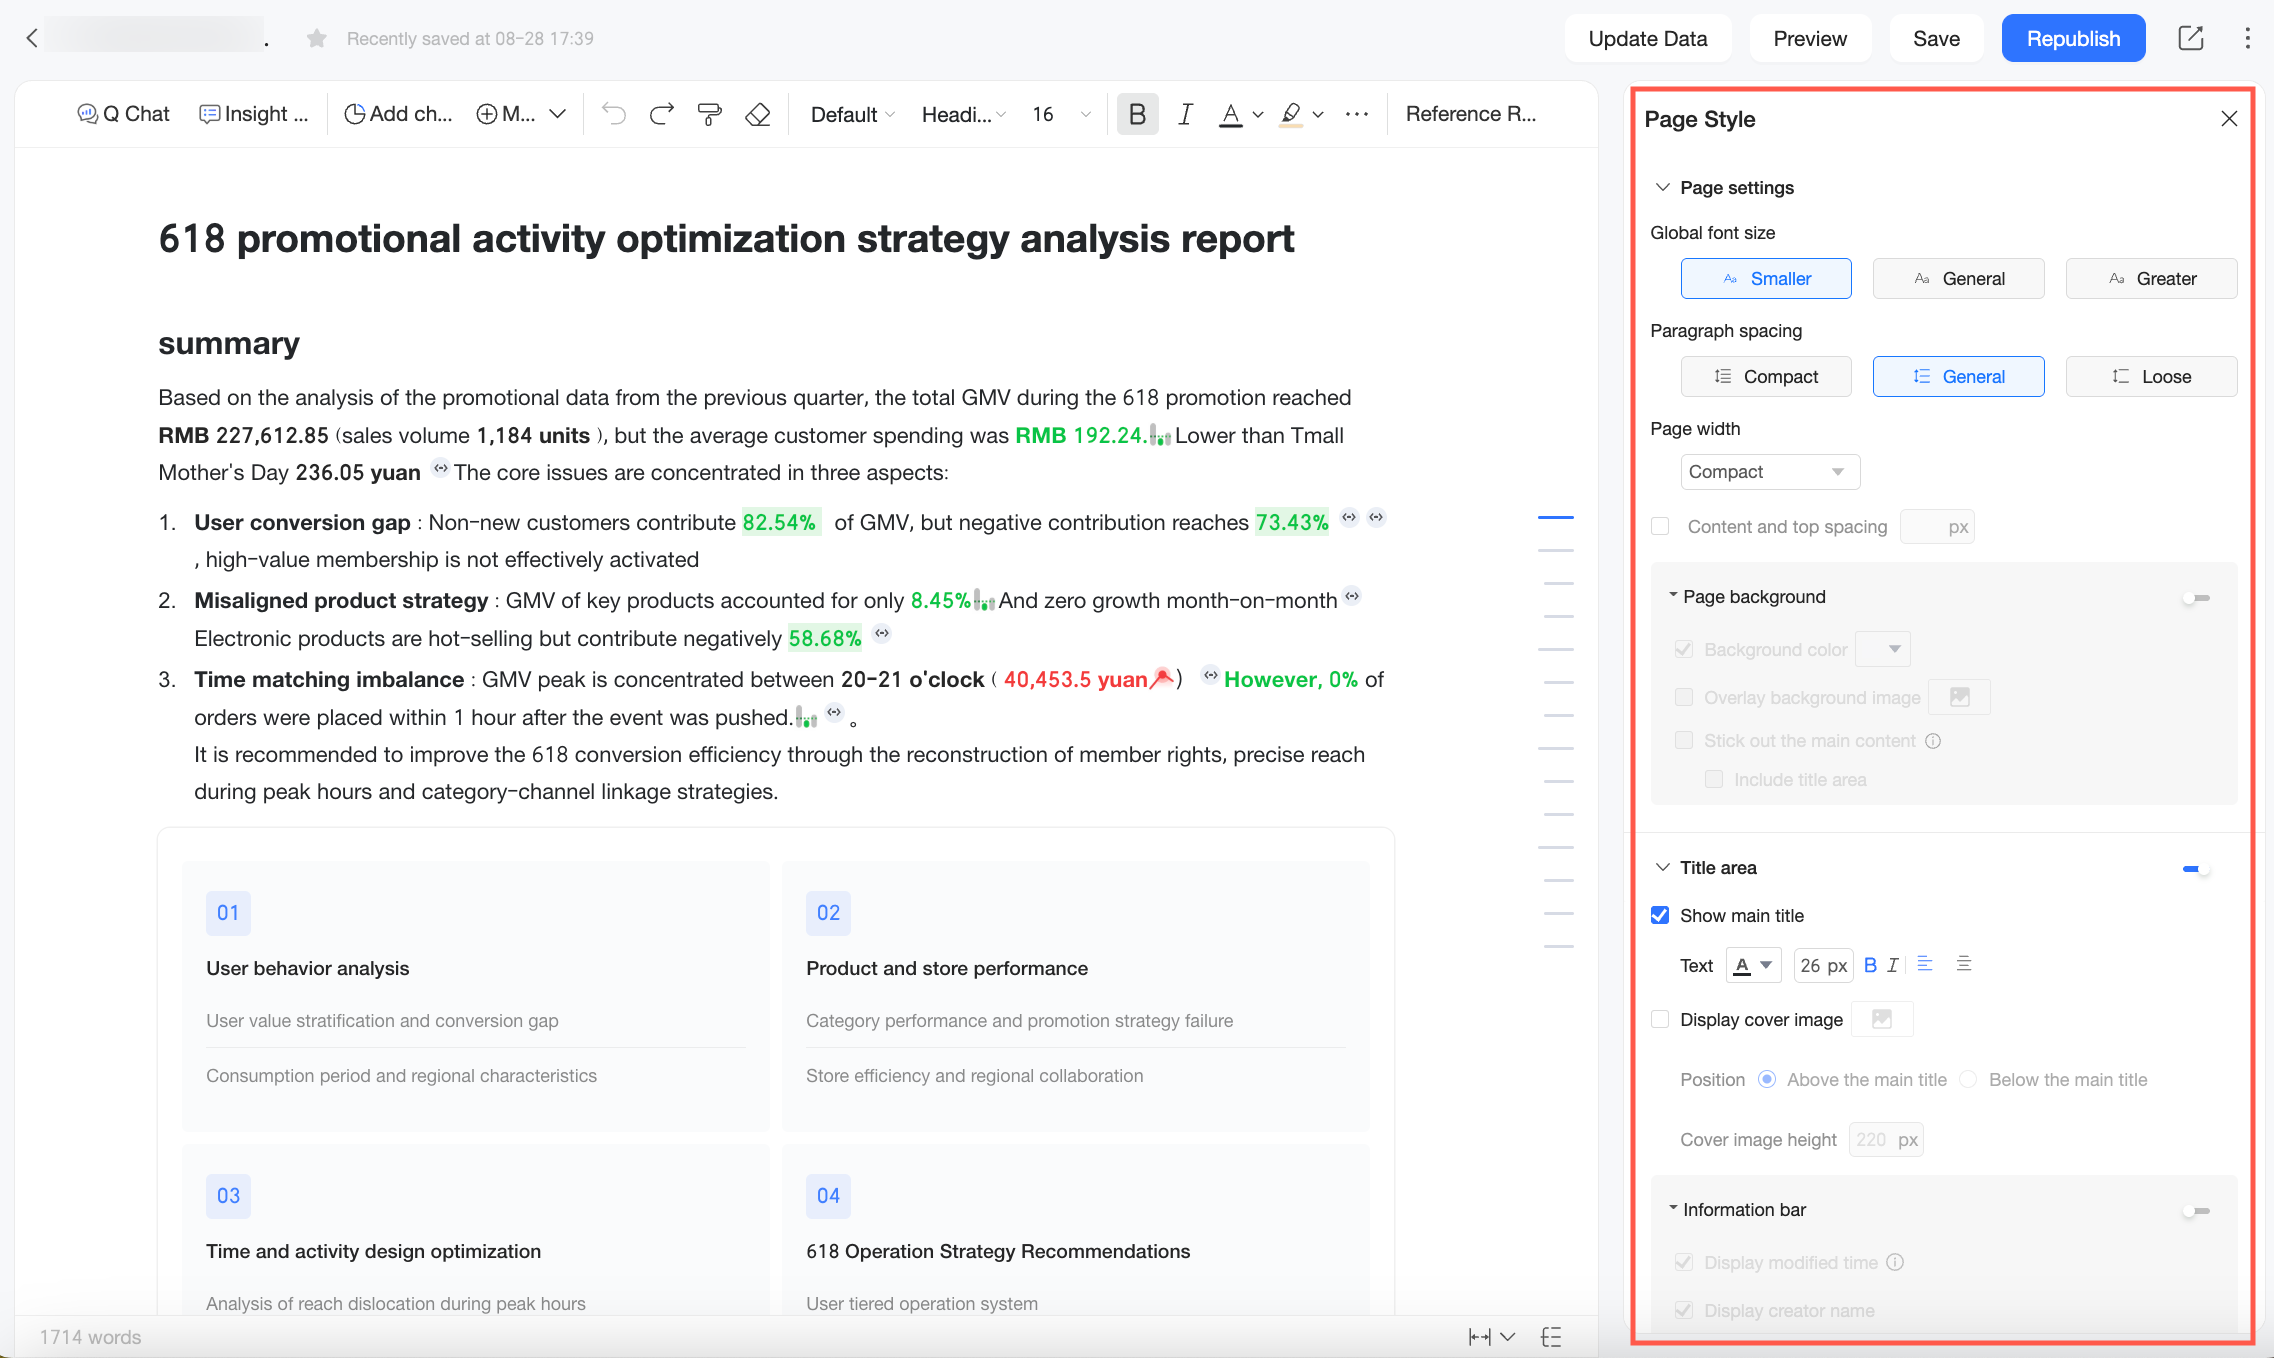
For more information, see Style configuration.
What to do next
After you edit your report, you can share it with others, set permissions, and manage existing reports. For more information, see Q Report management.