To support diverse visual analysis needs, Quick BI separates data and style configurations in the visualization panel and provides features for creating fields in the data processing panel. This topic describes common chart operations on the dashboard edit page.
In the chart configuration area, you can add data, configure styles, and set up advanced features like filter interaction and hyperlinks.
In the data processing panel, you can process chart data for in-depth analysis.
On the data processing page, you can:
Visualization configuration
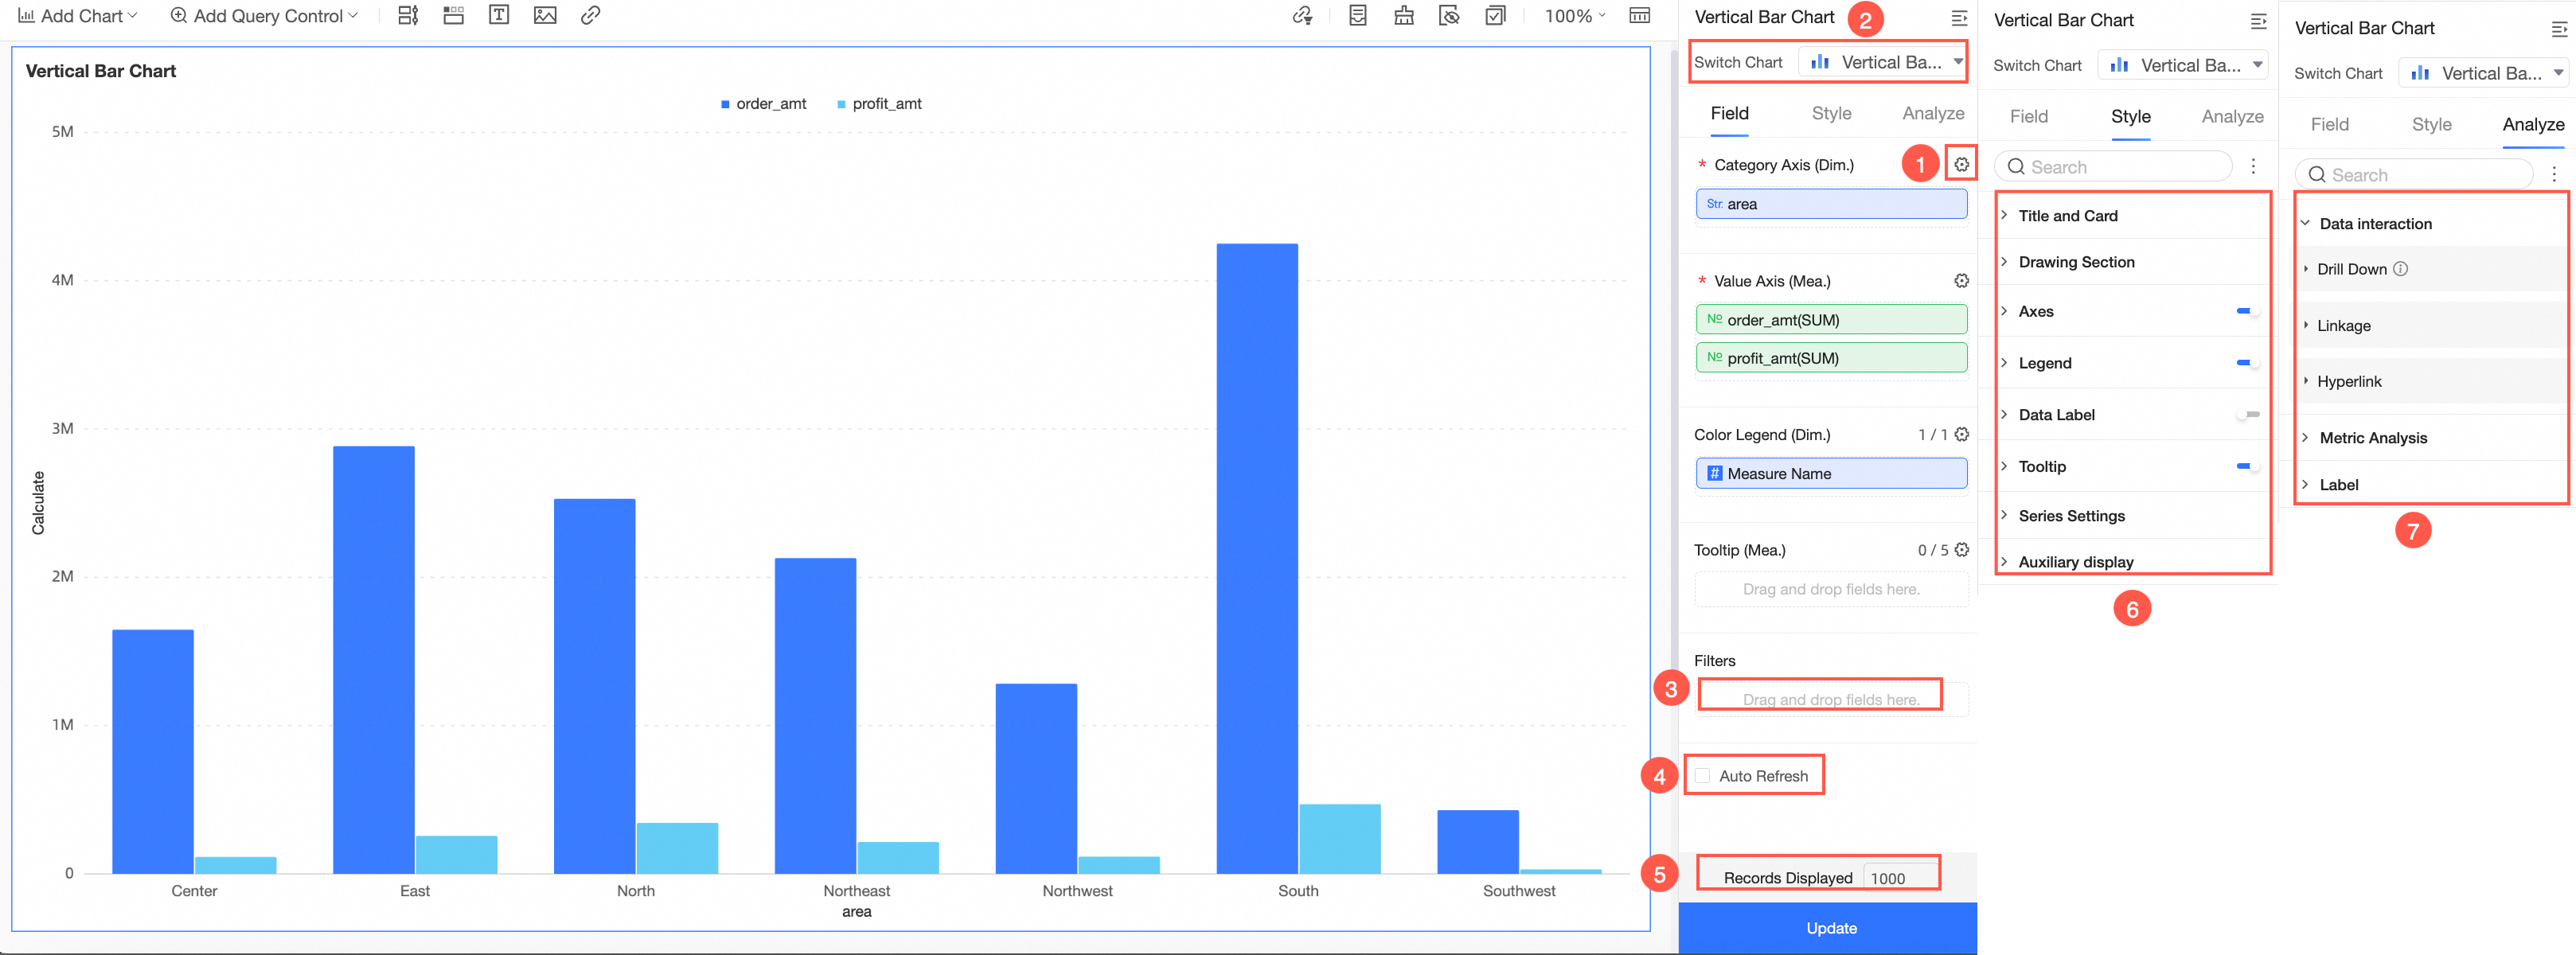
On a dashboard, you can configure a chart's fields and style, as well as its advanced settings.
Field configuration
Fields determine the data displayed in a chart. The required fields vary by chart type. For more information about the data elements supported by each chart, see Chart use cases.
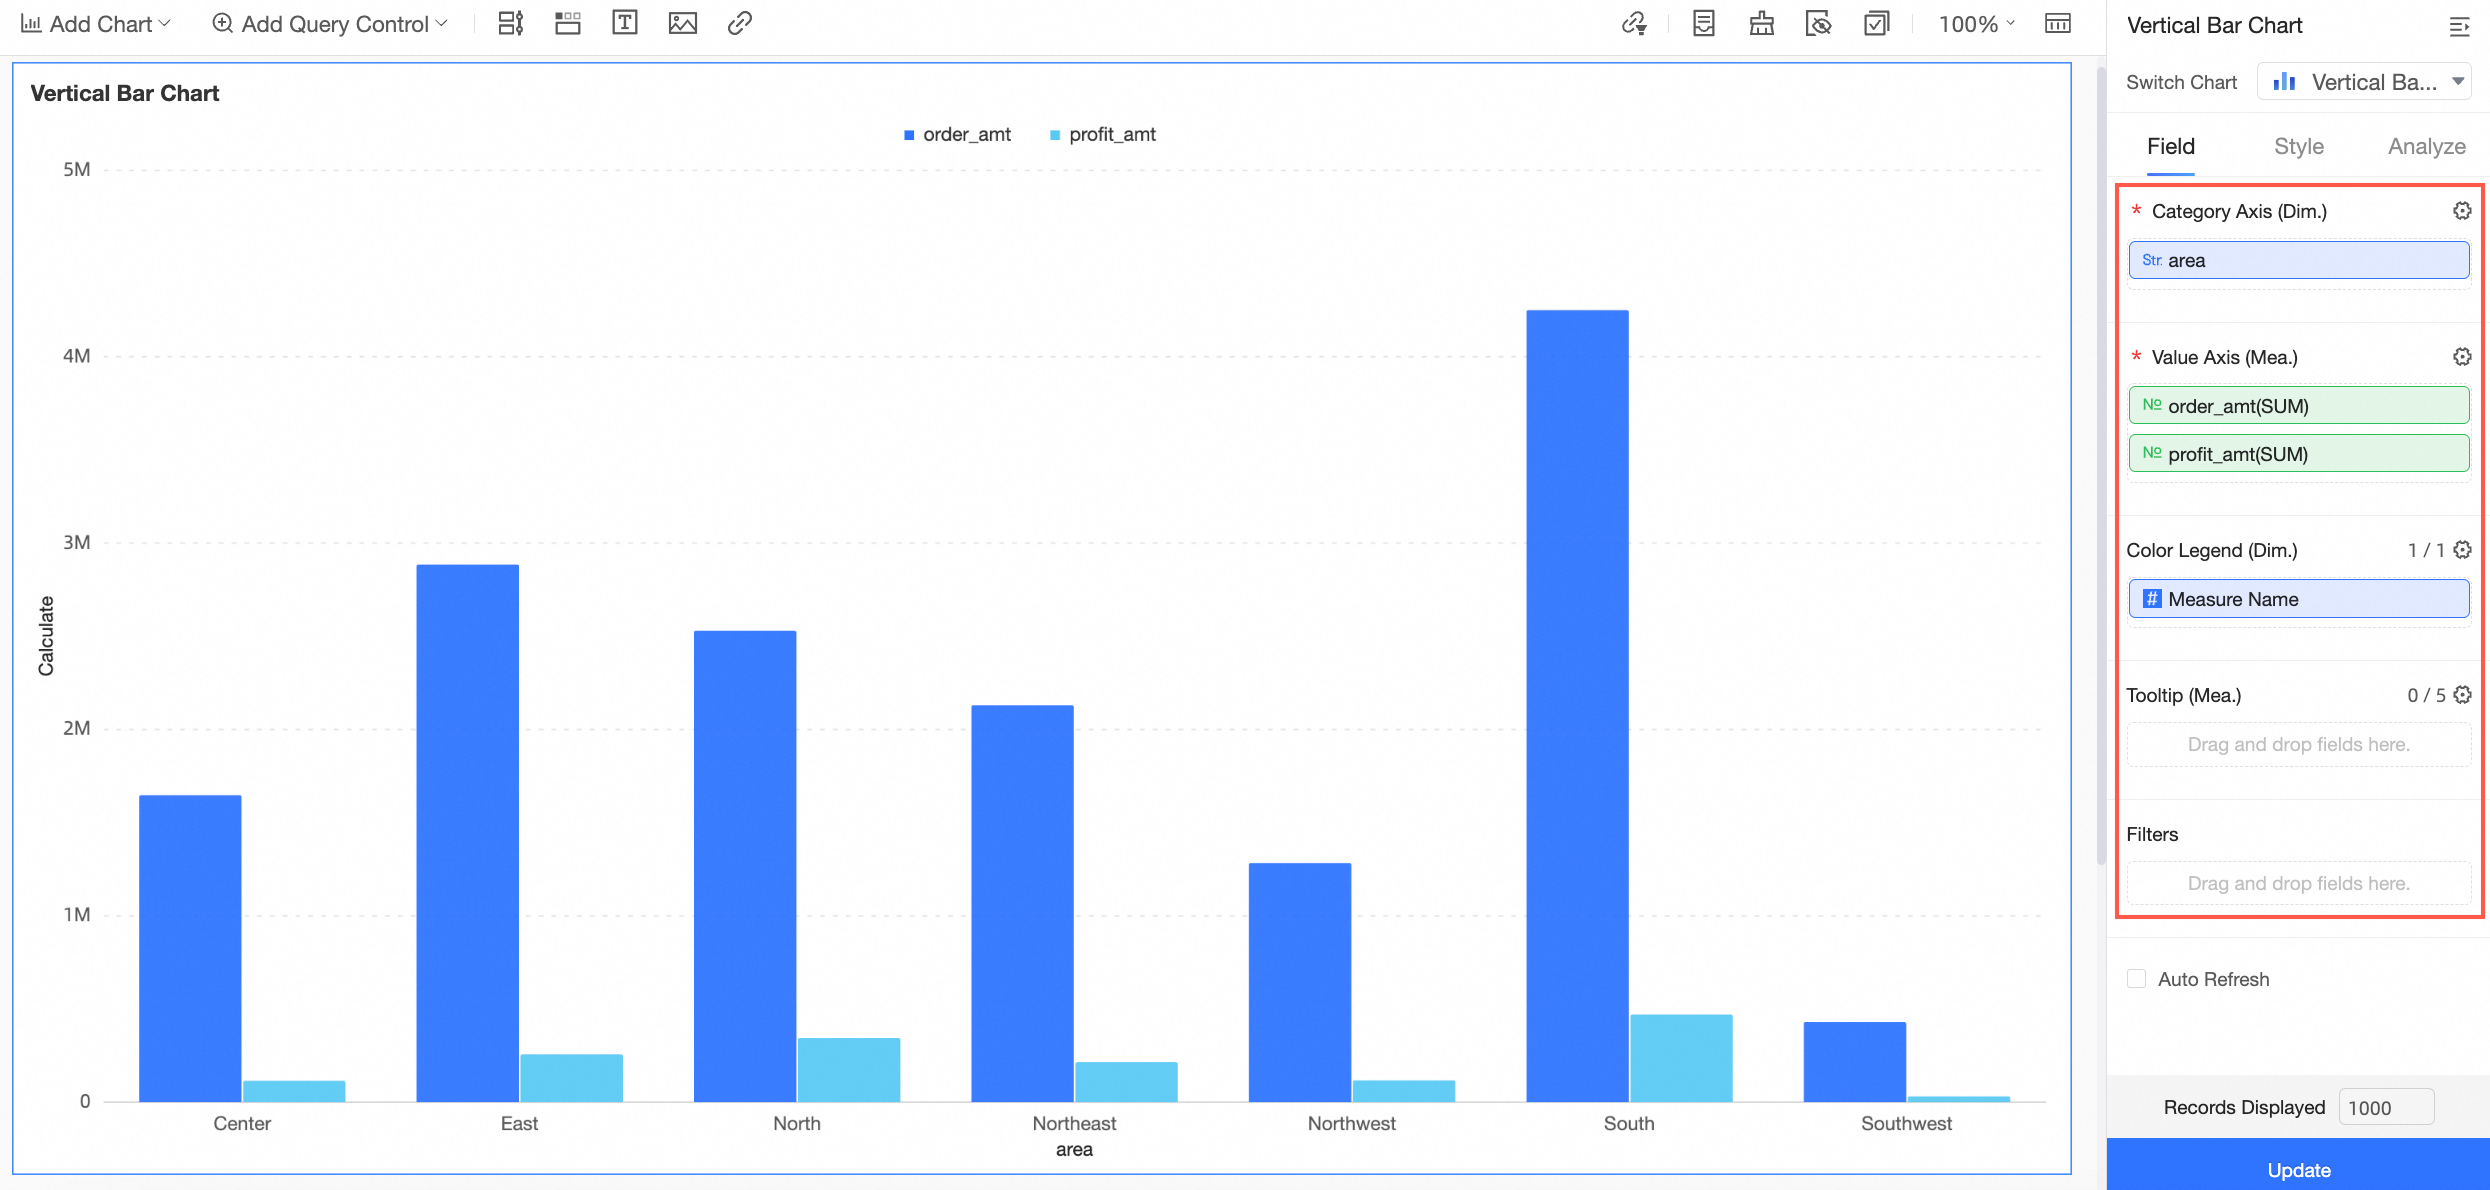
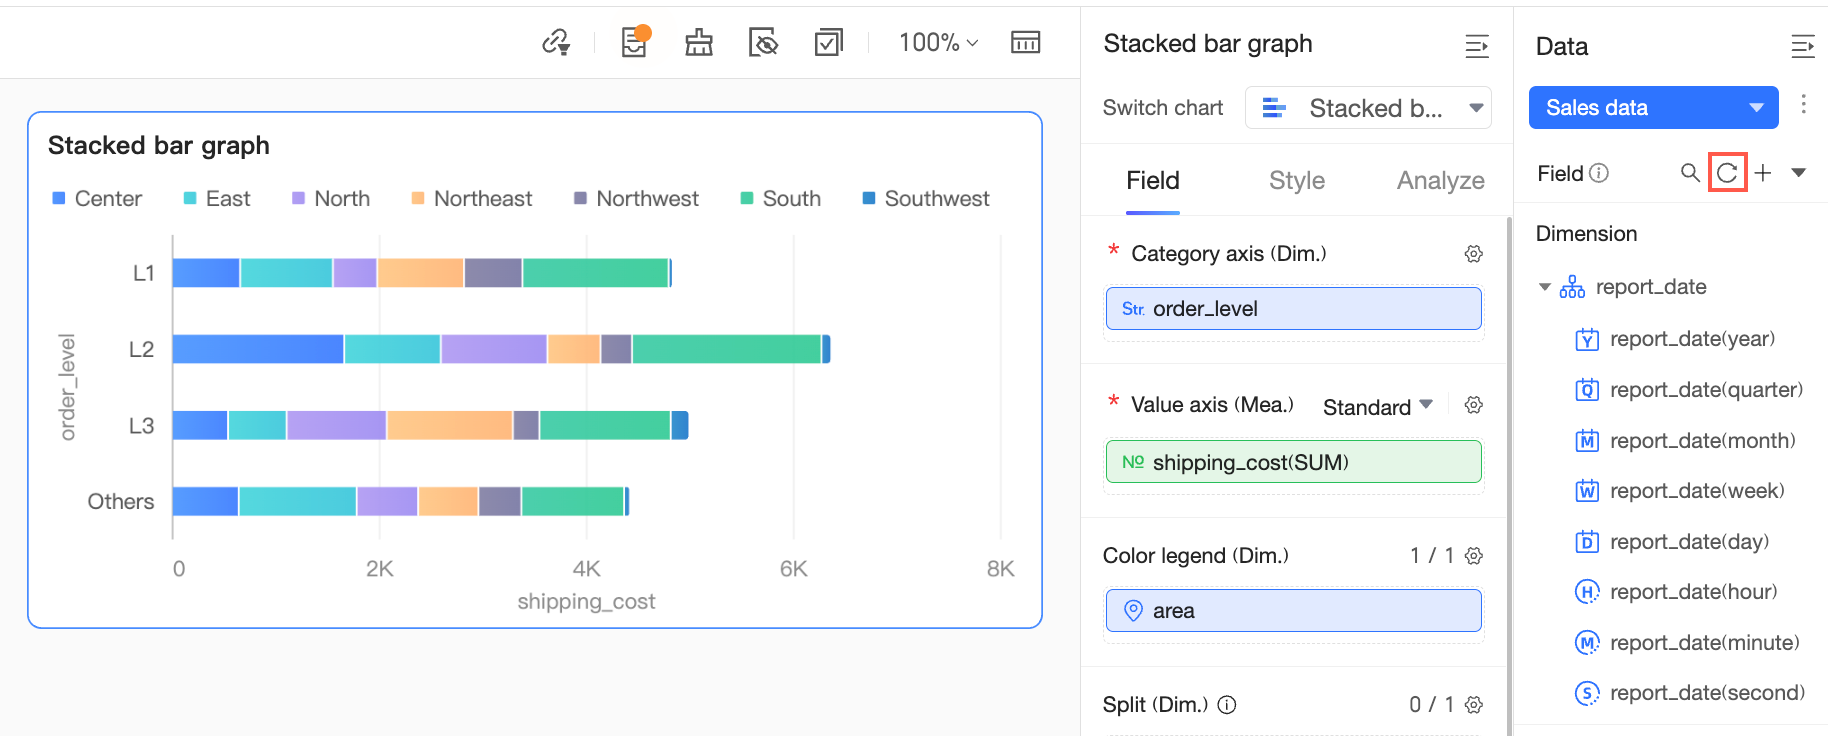
The fields displayed in the chart data area may differ from those on the dataset preview page. Click the refresh button to get the latest field data.
You can also complete the following configurations in the field panel:
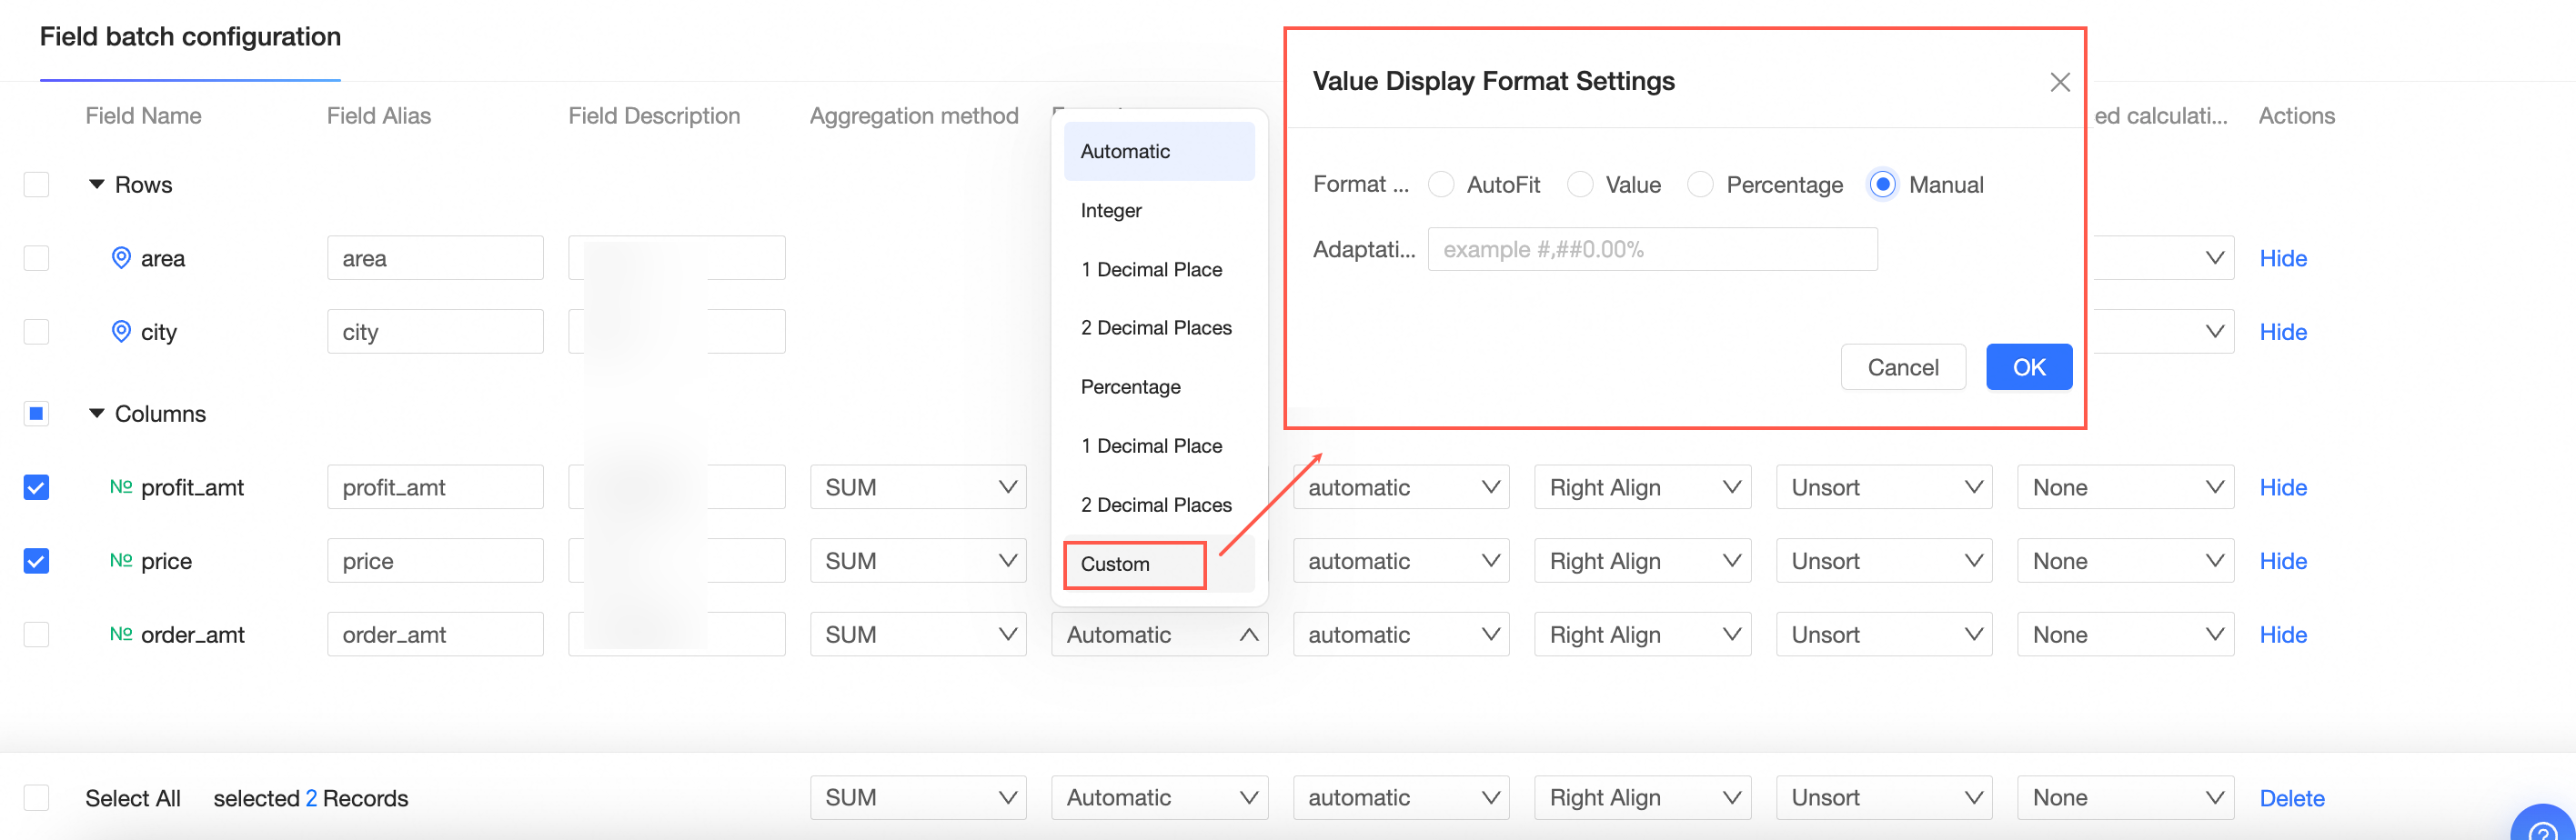
Configure multiple fields at a time
To efficiently modify multiple fields, you can edit them in batches.
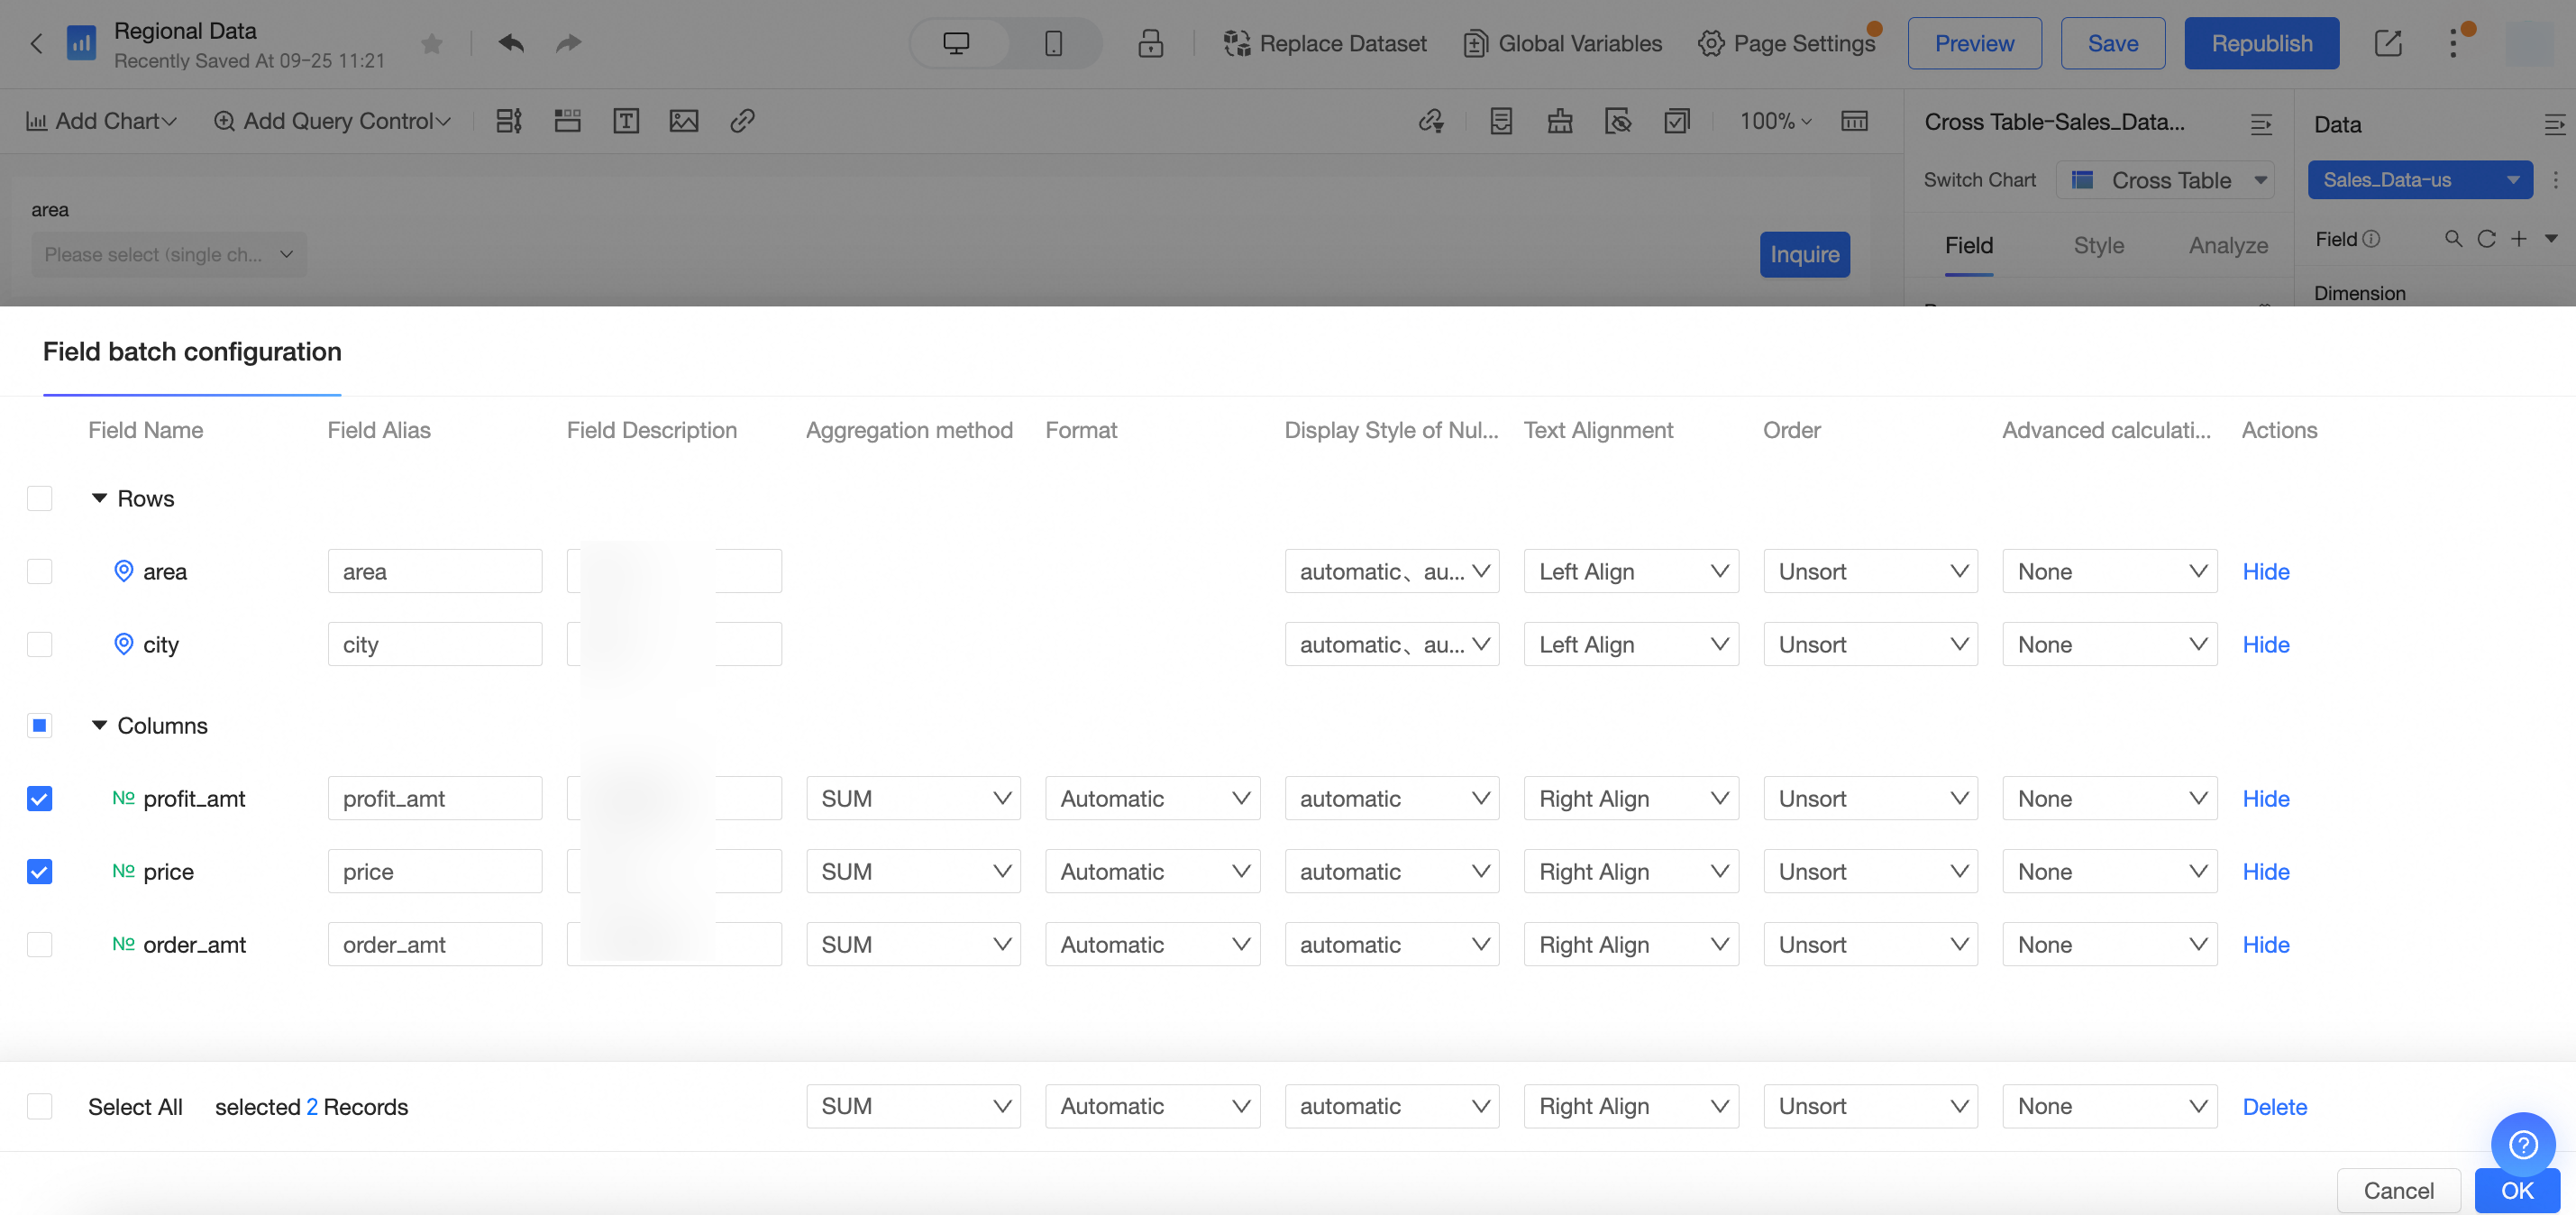
Additionally, when you batch-configure the Format of measure fields, you can select Custom. This allows you to set the format for negative numbers or manually enter formats such as ##0.00%. For detailed configuration instructions, see Configure chart fields.

Change the chart type
When your business data changes, you can switch to a different chart type.
NoteIf you cannot switch the chart type, the data elements of the current chart may not match the requirements of the new chart type. The system highlights the element names that need to be adjusted. Based on the prompts, select the appropriate fields from the dimension and measure lists and add them to the corresponding chart element areas to complete the switch.
Configure a filter
Filters allow you to select specific data. When dealing with a large amount of data, you can use a filter and set a range to display only the data you need, making your report more precise.
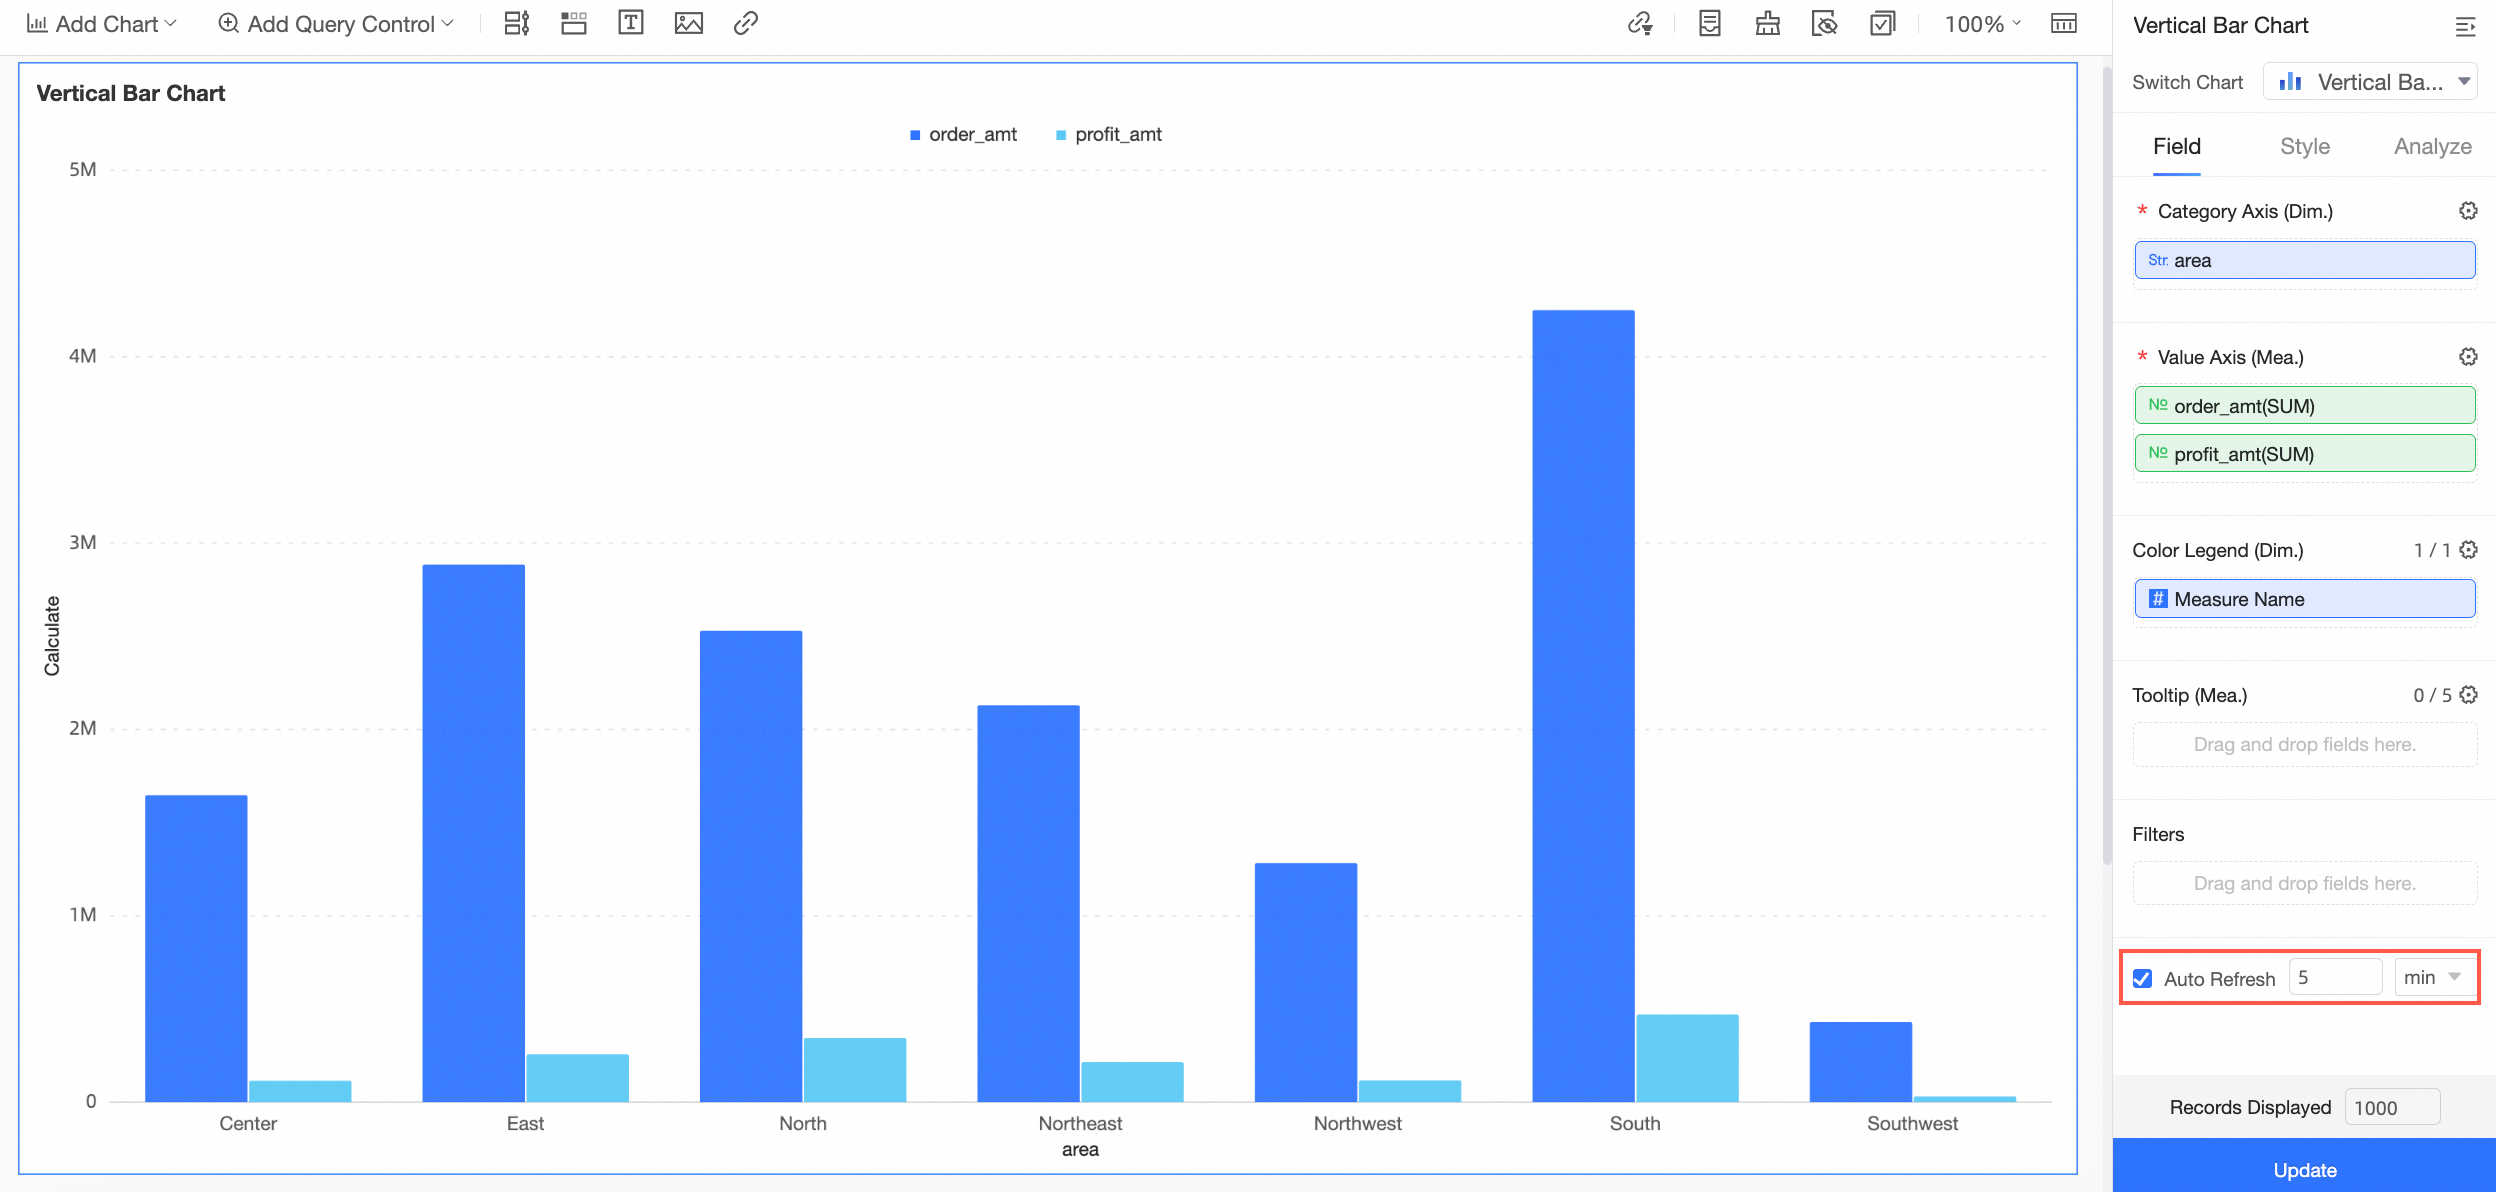
Automatically refresh chart data
After you enable Auto-refresh, the system automatically refreshes the chart data. For example, if you select this option, set the duration to 5, and select minutes as the unit, the system automatically refreshes the chart data every 5 minutes.
Specify the number of rows to preview

Style configuration
Style settings determine the appearance and details of your chart. You can configure the chart style here.
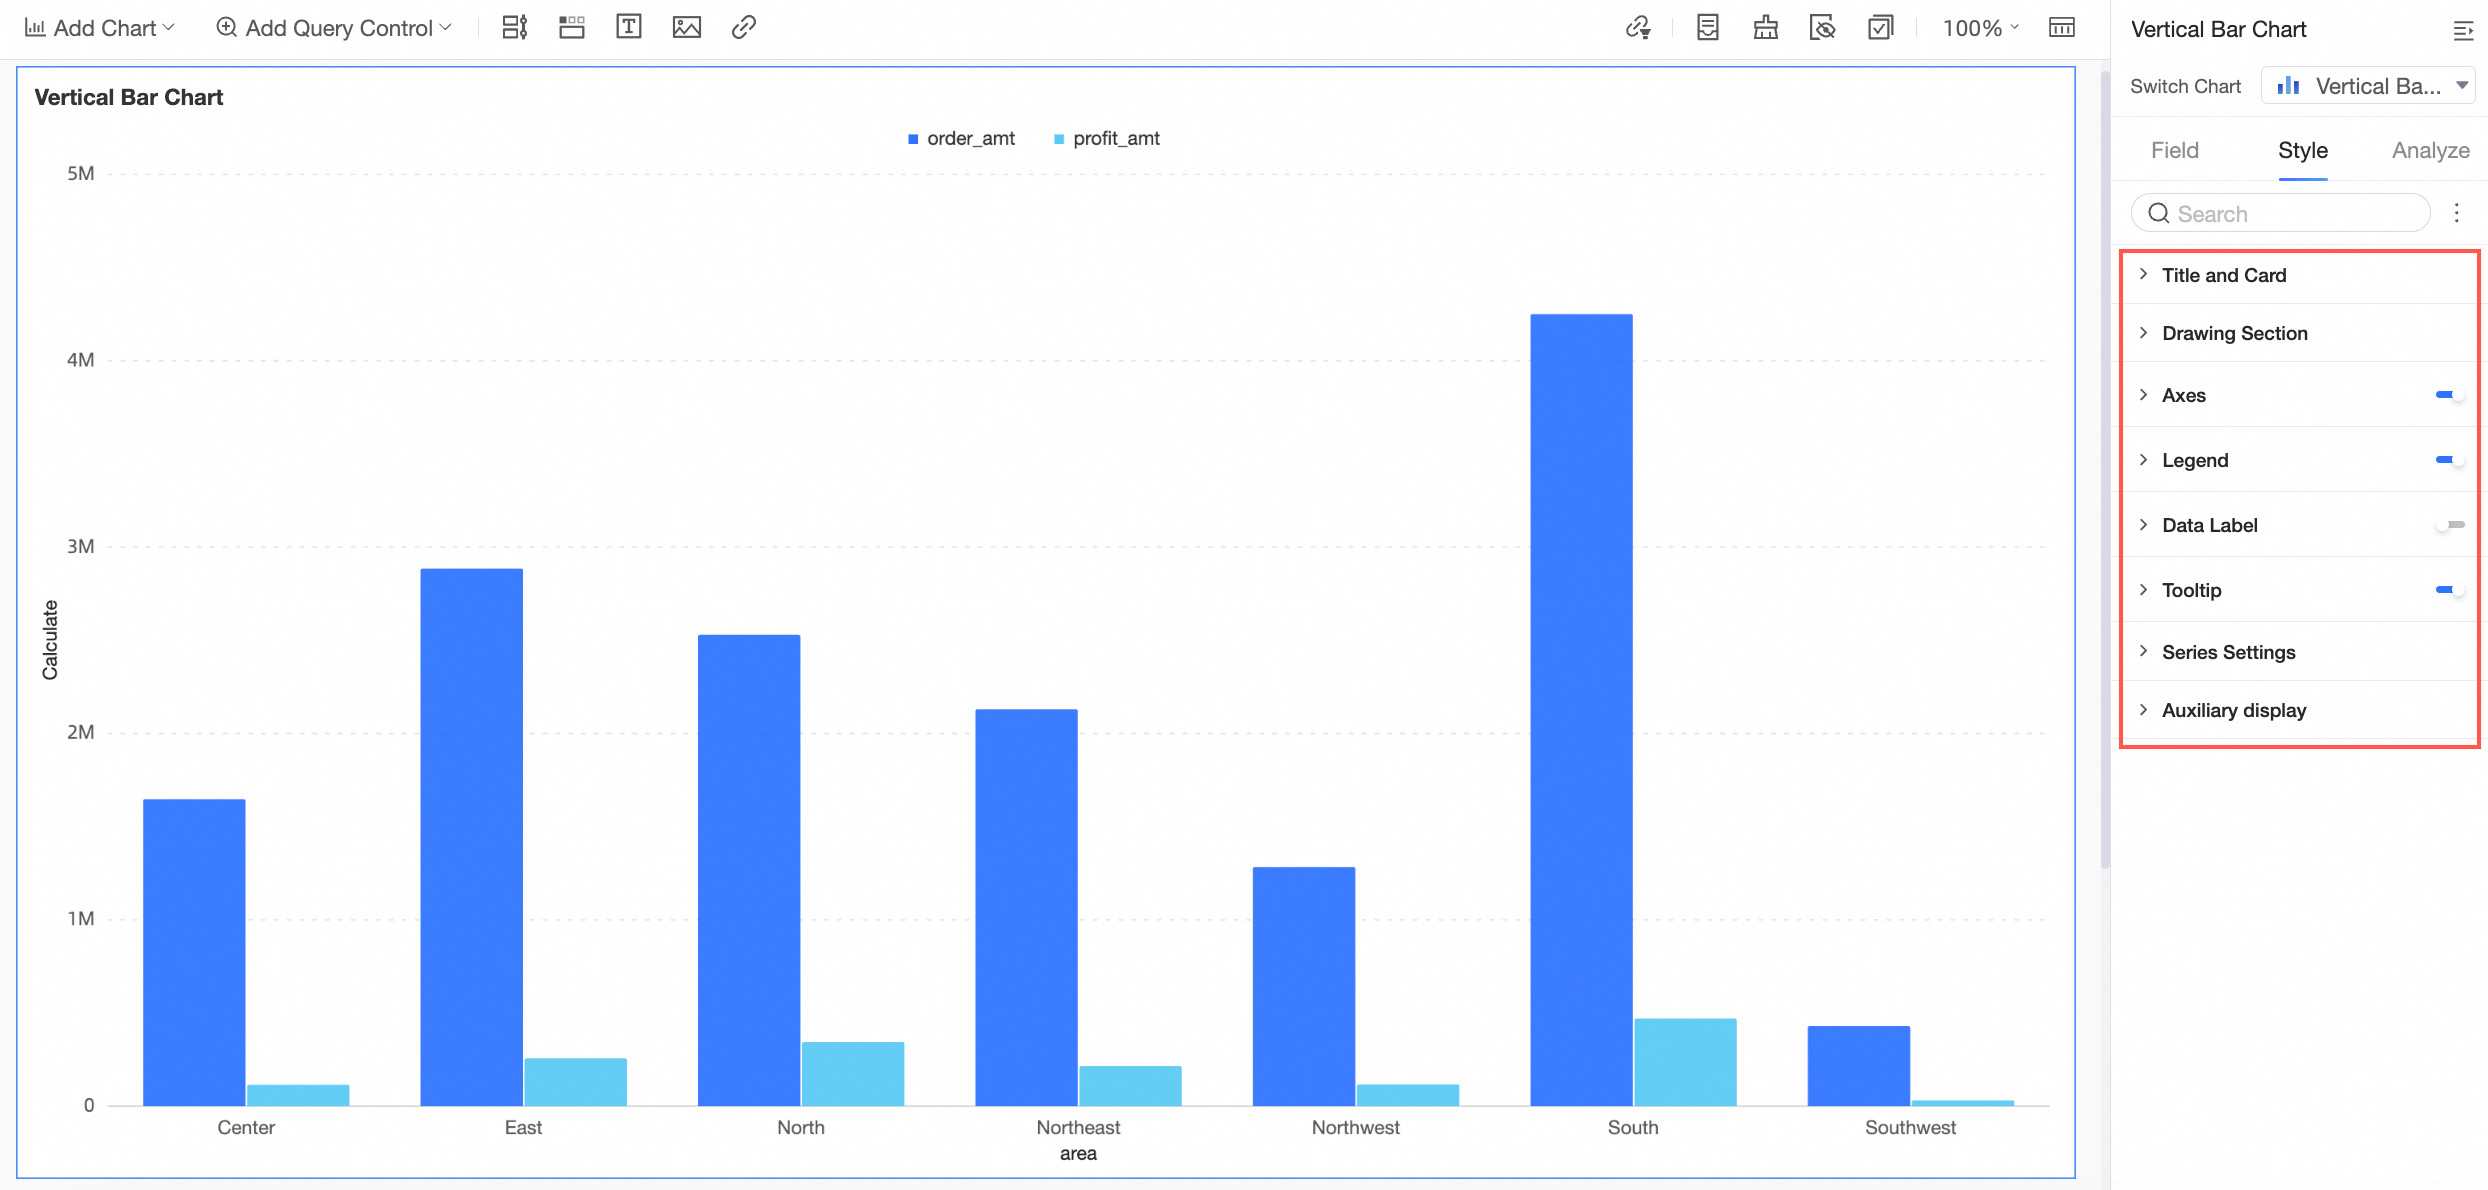
Style settings vary by chart type. The available options depend on the actual chart. For configuration examples, see Chart style configuration.
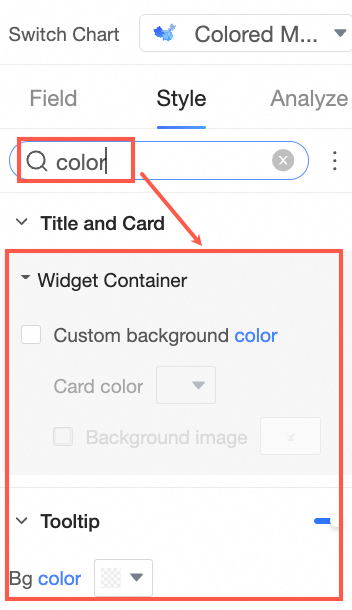
To quickly find a specific configuration item, you can enter keywords in the search box at the top to display the relevant options.
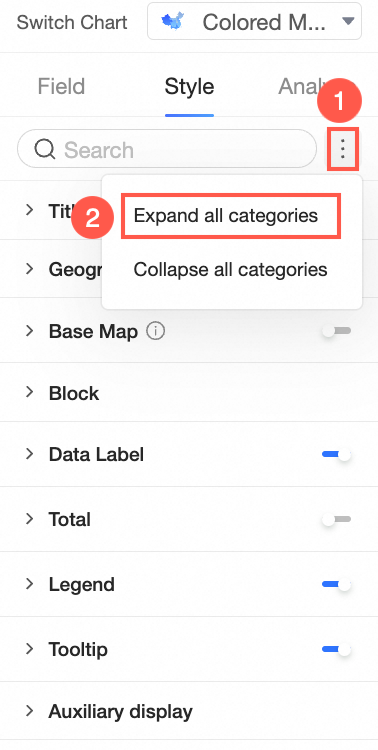
To expand all configuration categories at once, click the ![]() icon to the right of the search box and select Expand all categories.
icon to the right of the search box and select Expand all categories.
Analysis configuration
Advanced analysis enables data-driven interactions across multiple charts, allowing you to dynamically display data comparisons and interactions based on your needs.
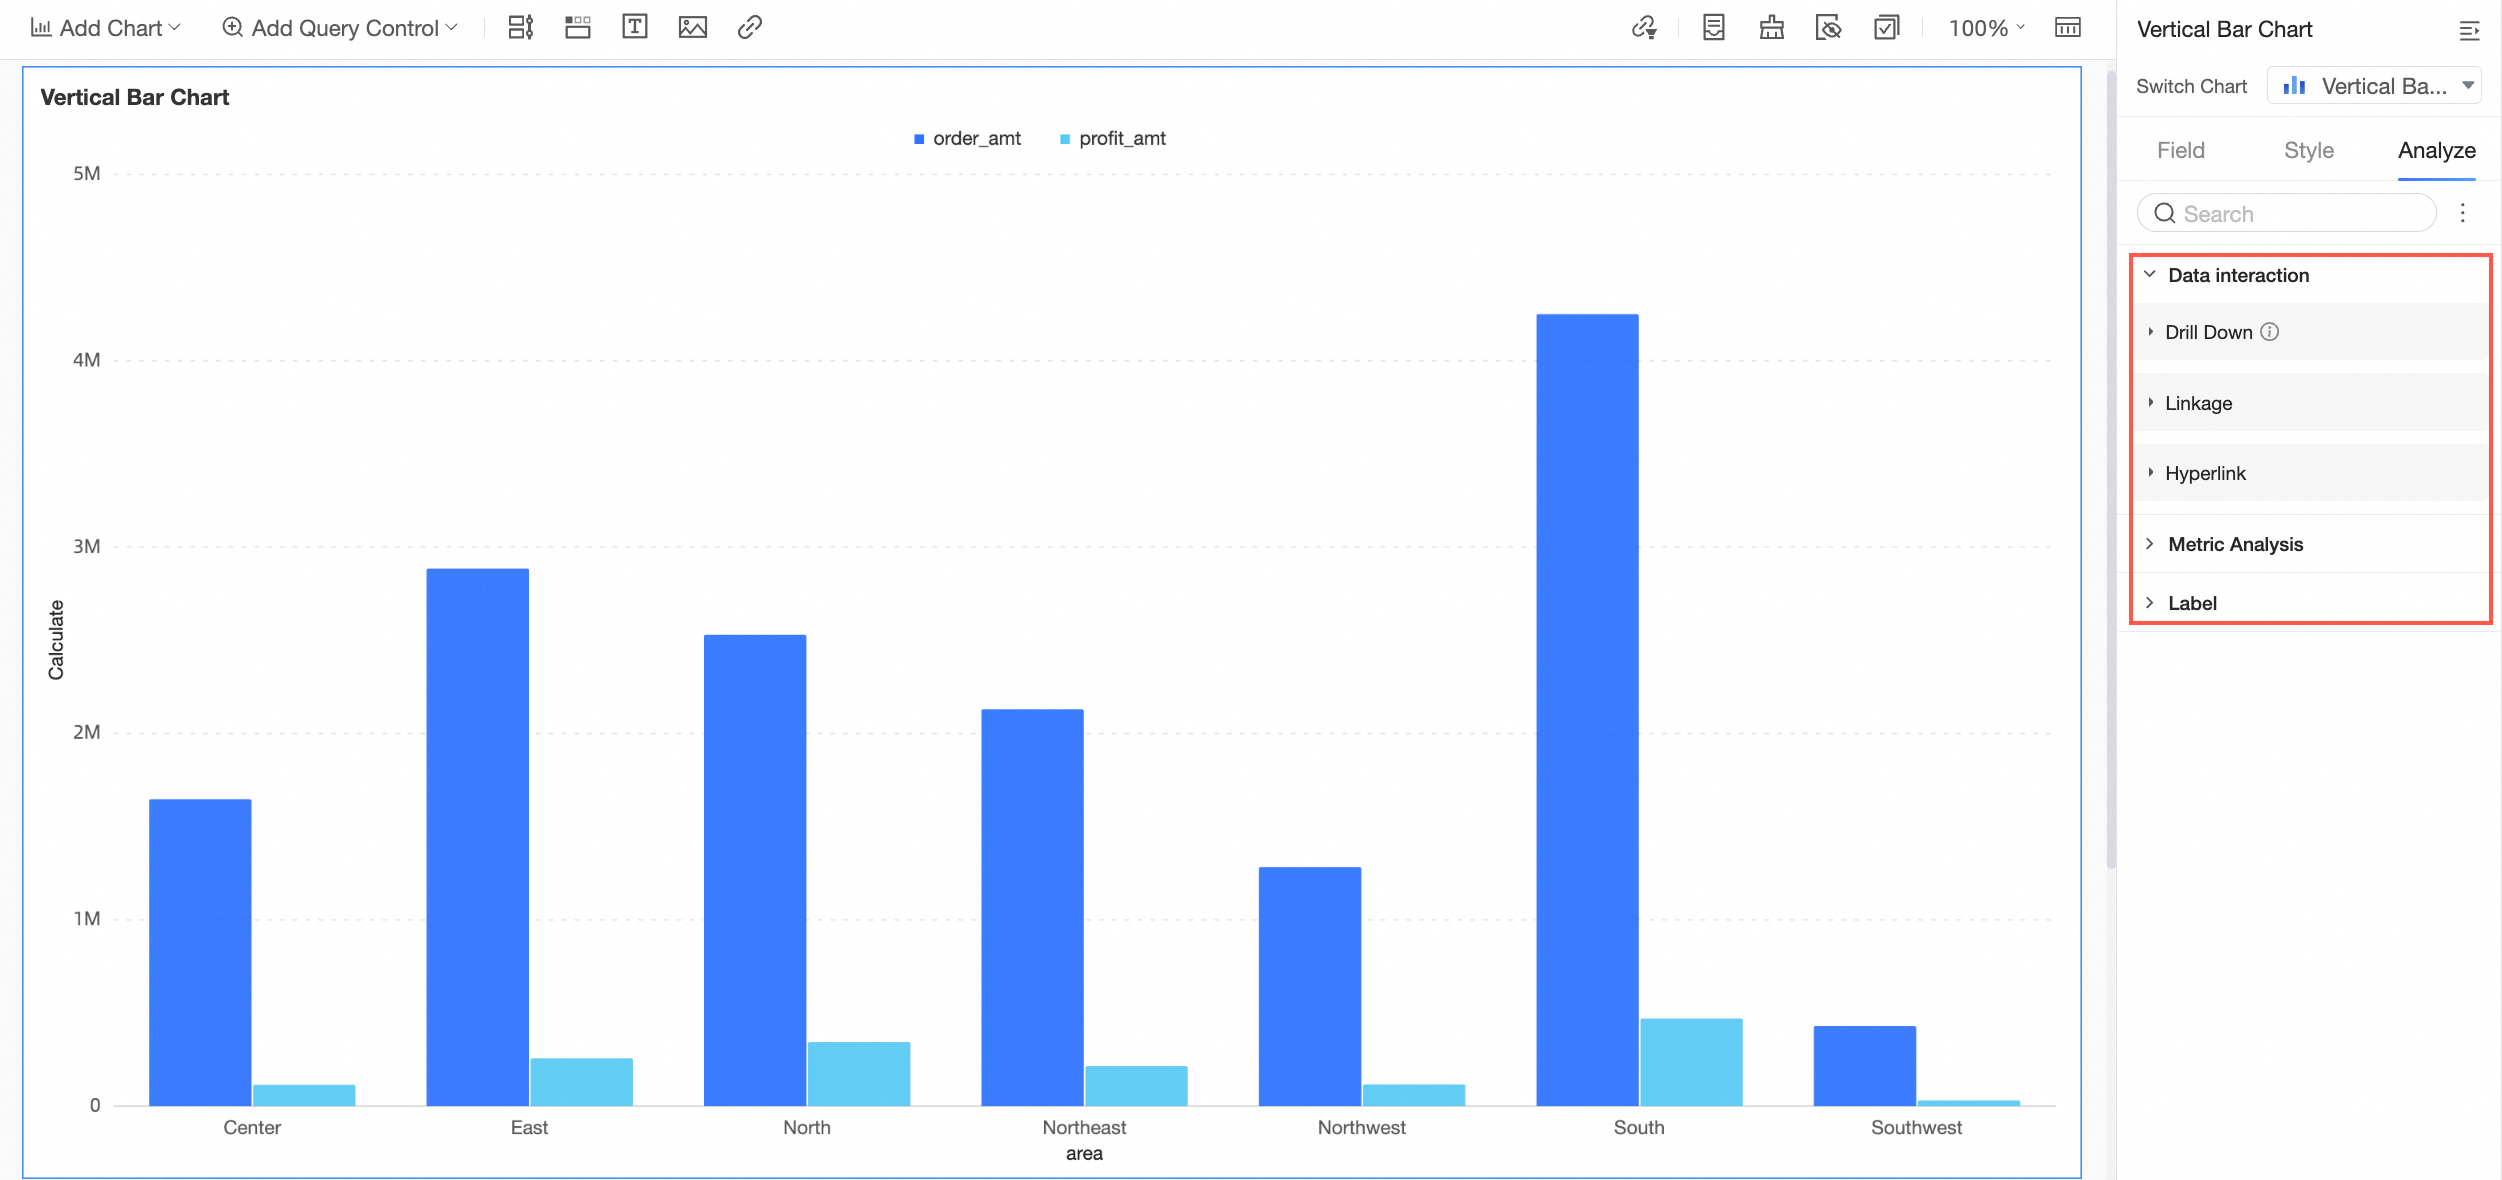
For more information, see drill-down, filter interaction, hyperlink, analysis alerts, and annotations.
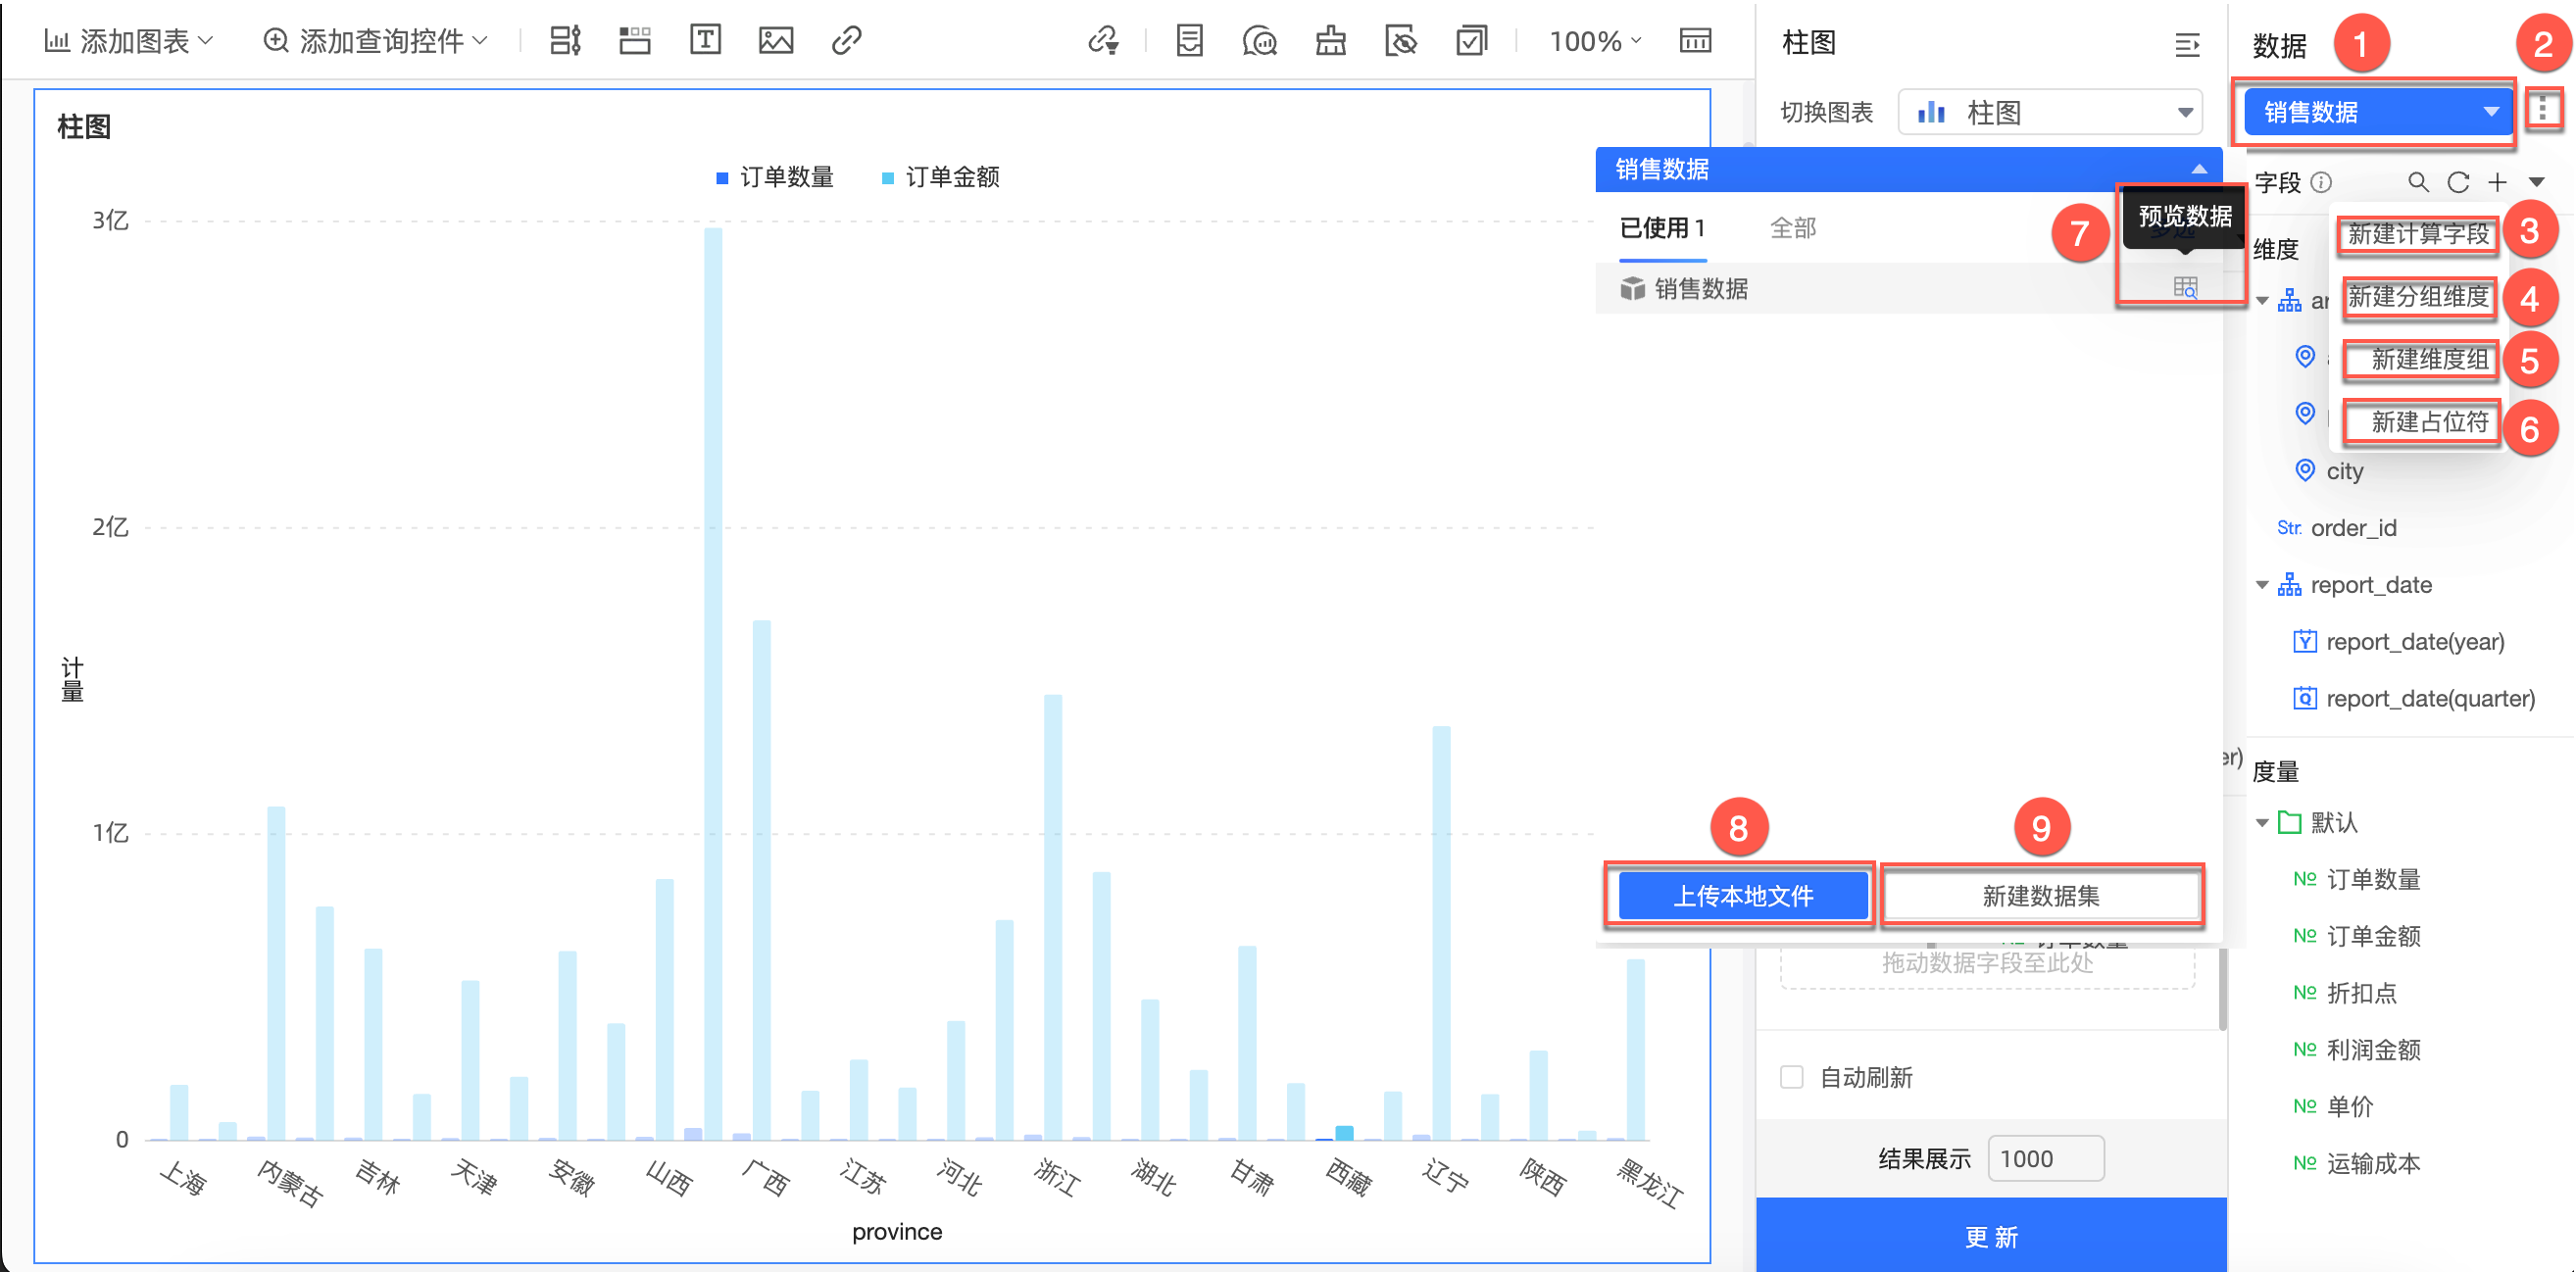
Data processing
Note the following points about fields in data processing:
A new calculated field is not saved to the dataset and applies only to the current chart.
If you create a new chart and select the same dataset, the calculated field is lost.
If you copy a chart that contains a calculated field, the new field is also available in the copied chart, provided that the copied chart uses the same dataset.
Data processing includes creating a calculated field, group dimension, dimension group, and placeholder.
Create a calculated field
If a dataset lacks a field required for analysis, you can create a calculated field to derive it from existing data.
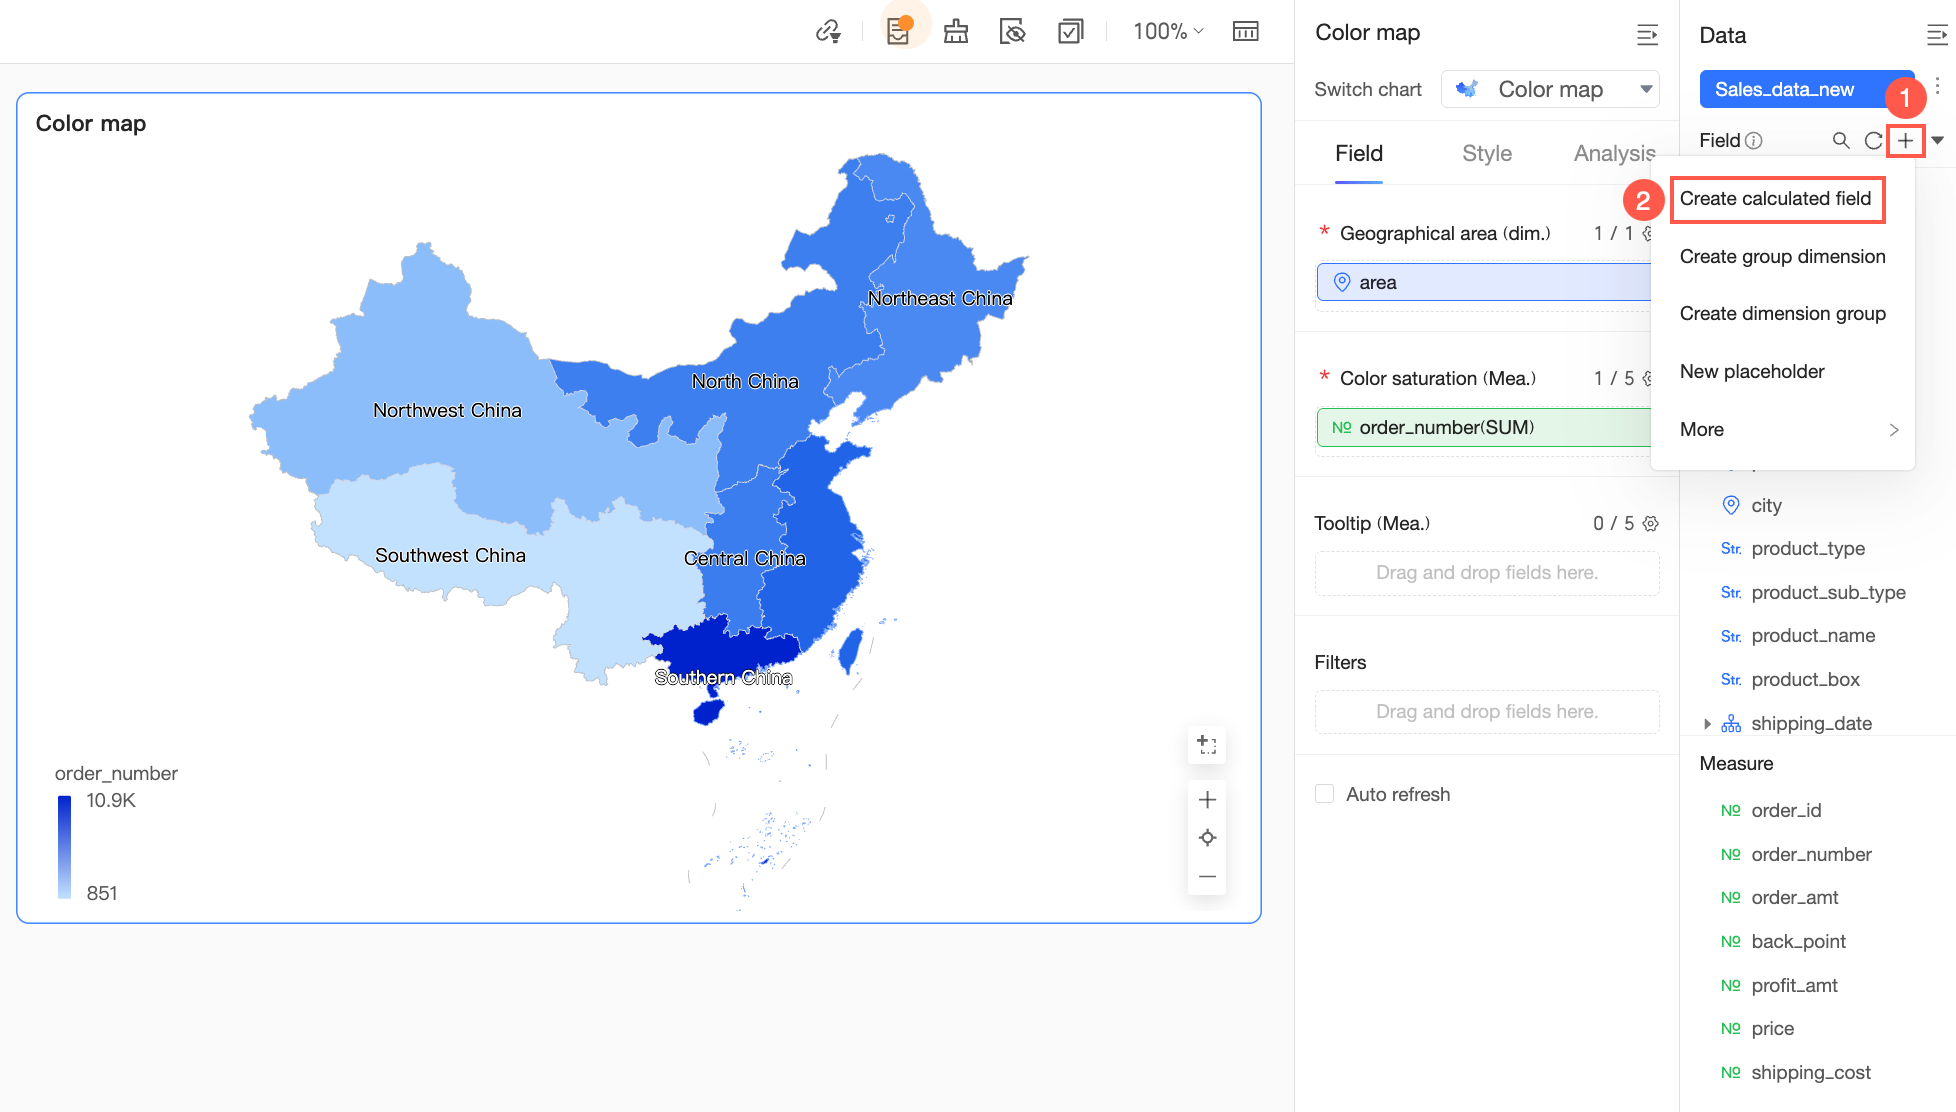
For detailed instructions, see Create a calculated field.
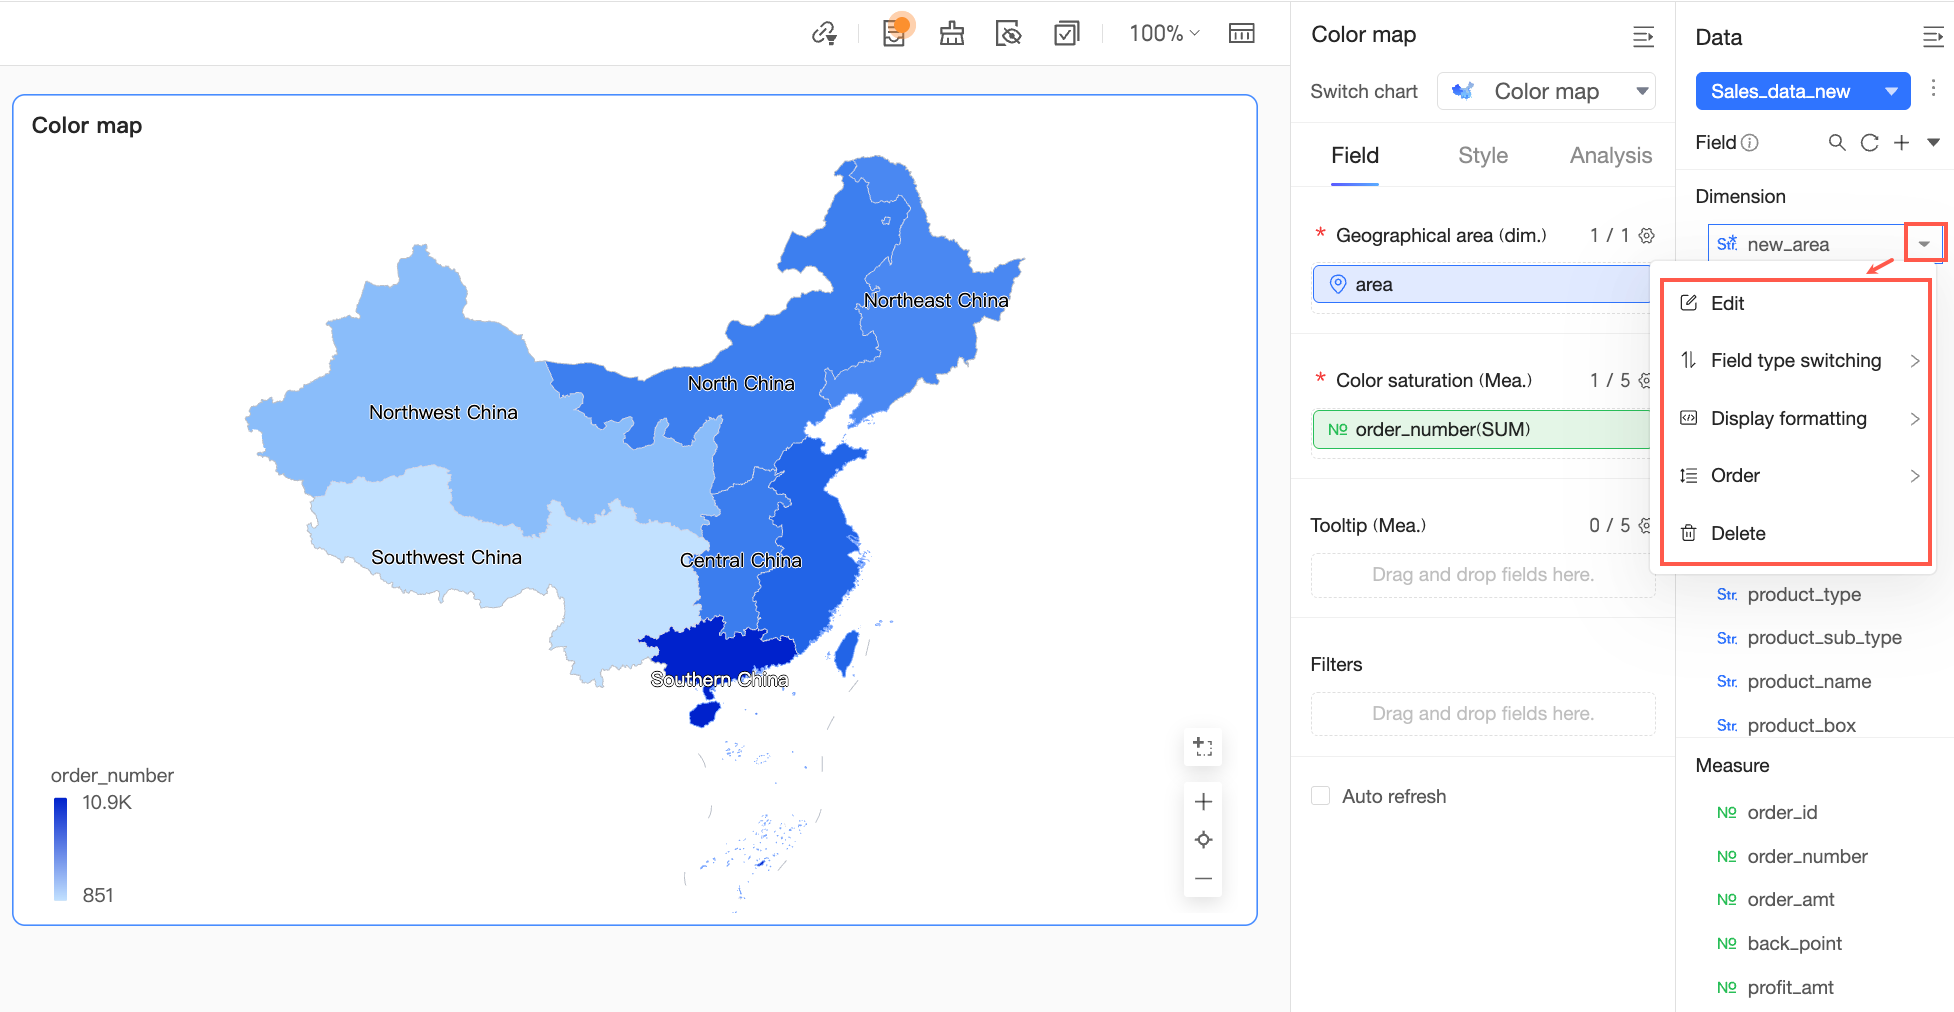
The new calculated field supports the following operations:
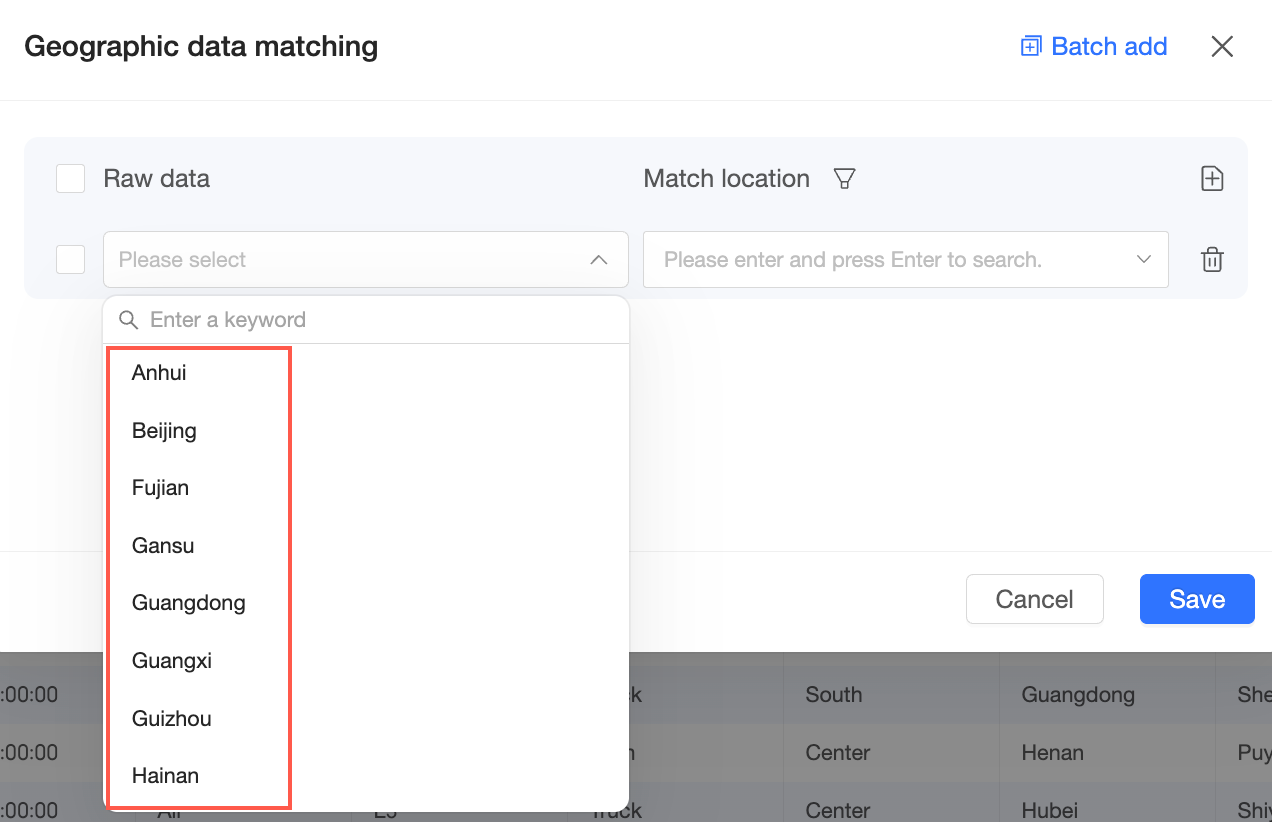
For more information, see Field configuration.When the field type is changed to a Geo field and is set to Continent, Country/Region, Province/Municipality, City, or District/County, you can configure Geographic Data Matching.
NoteThis feature matches geographic information fields (such as city or country) in the dashboard data panel with standard geographic names supported by the system for display on a map.
Note: The system automatically matches standard geographic names. Manual configuration is necessary only if your names differ from the standard or are not recognized. This ensures that your data maps to the correct locations.
For detailed instructions, see Geographic data matching.
 For more information, see
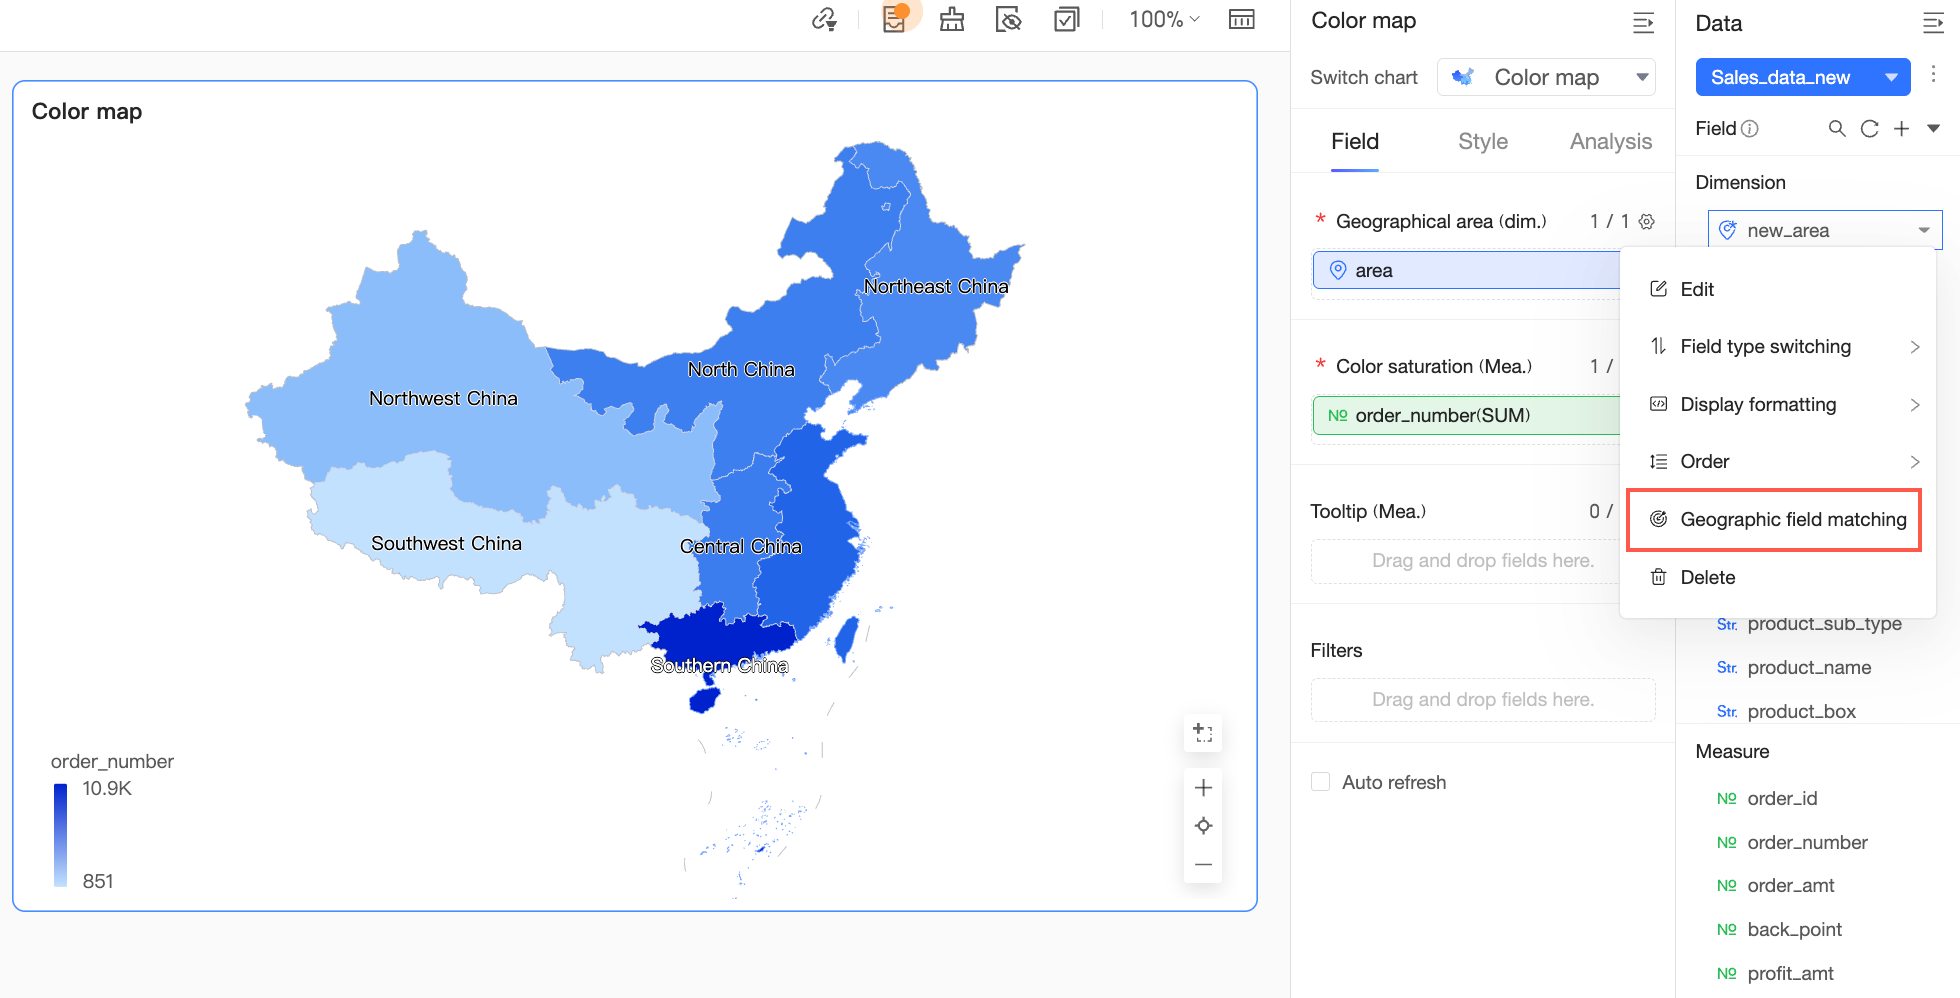
Create a group dimension

For detailed instructions, see Create a group dimension.
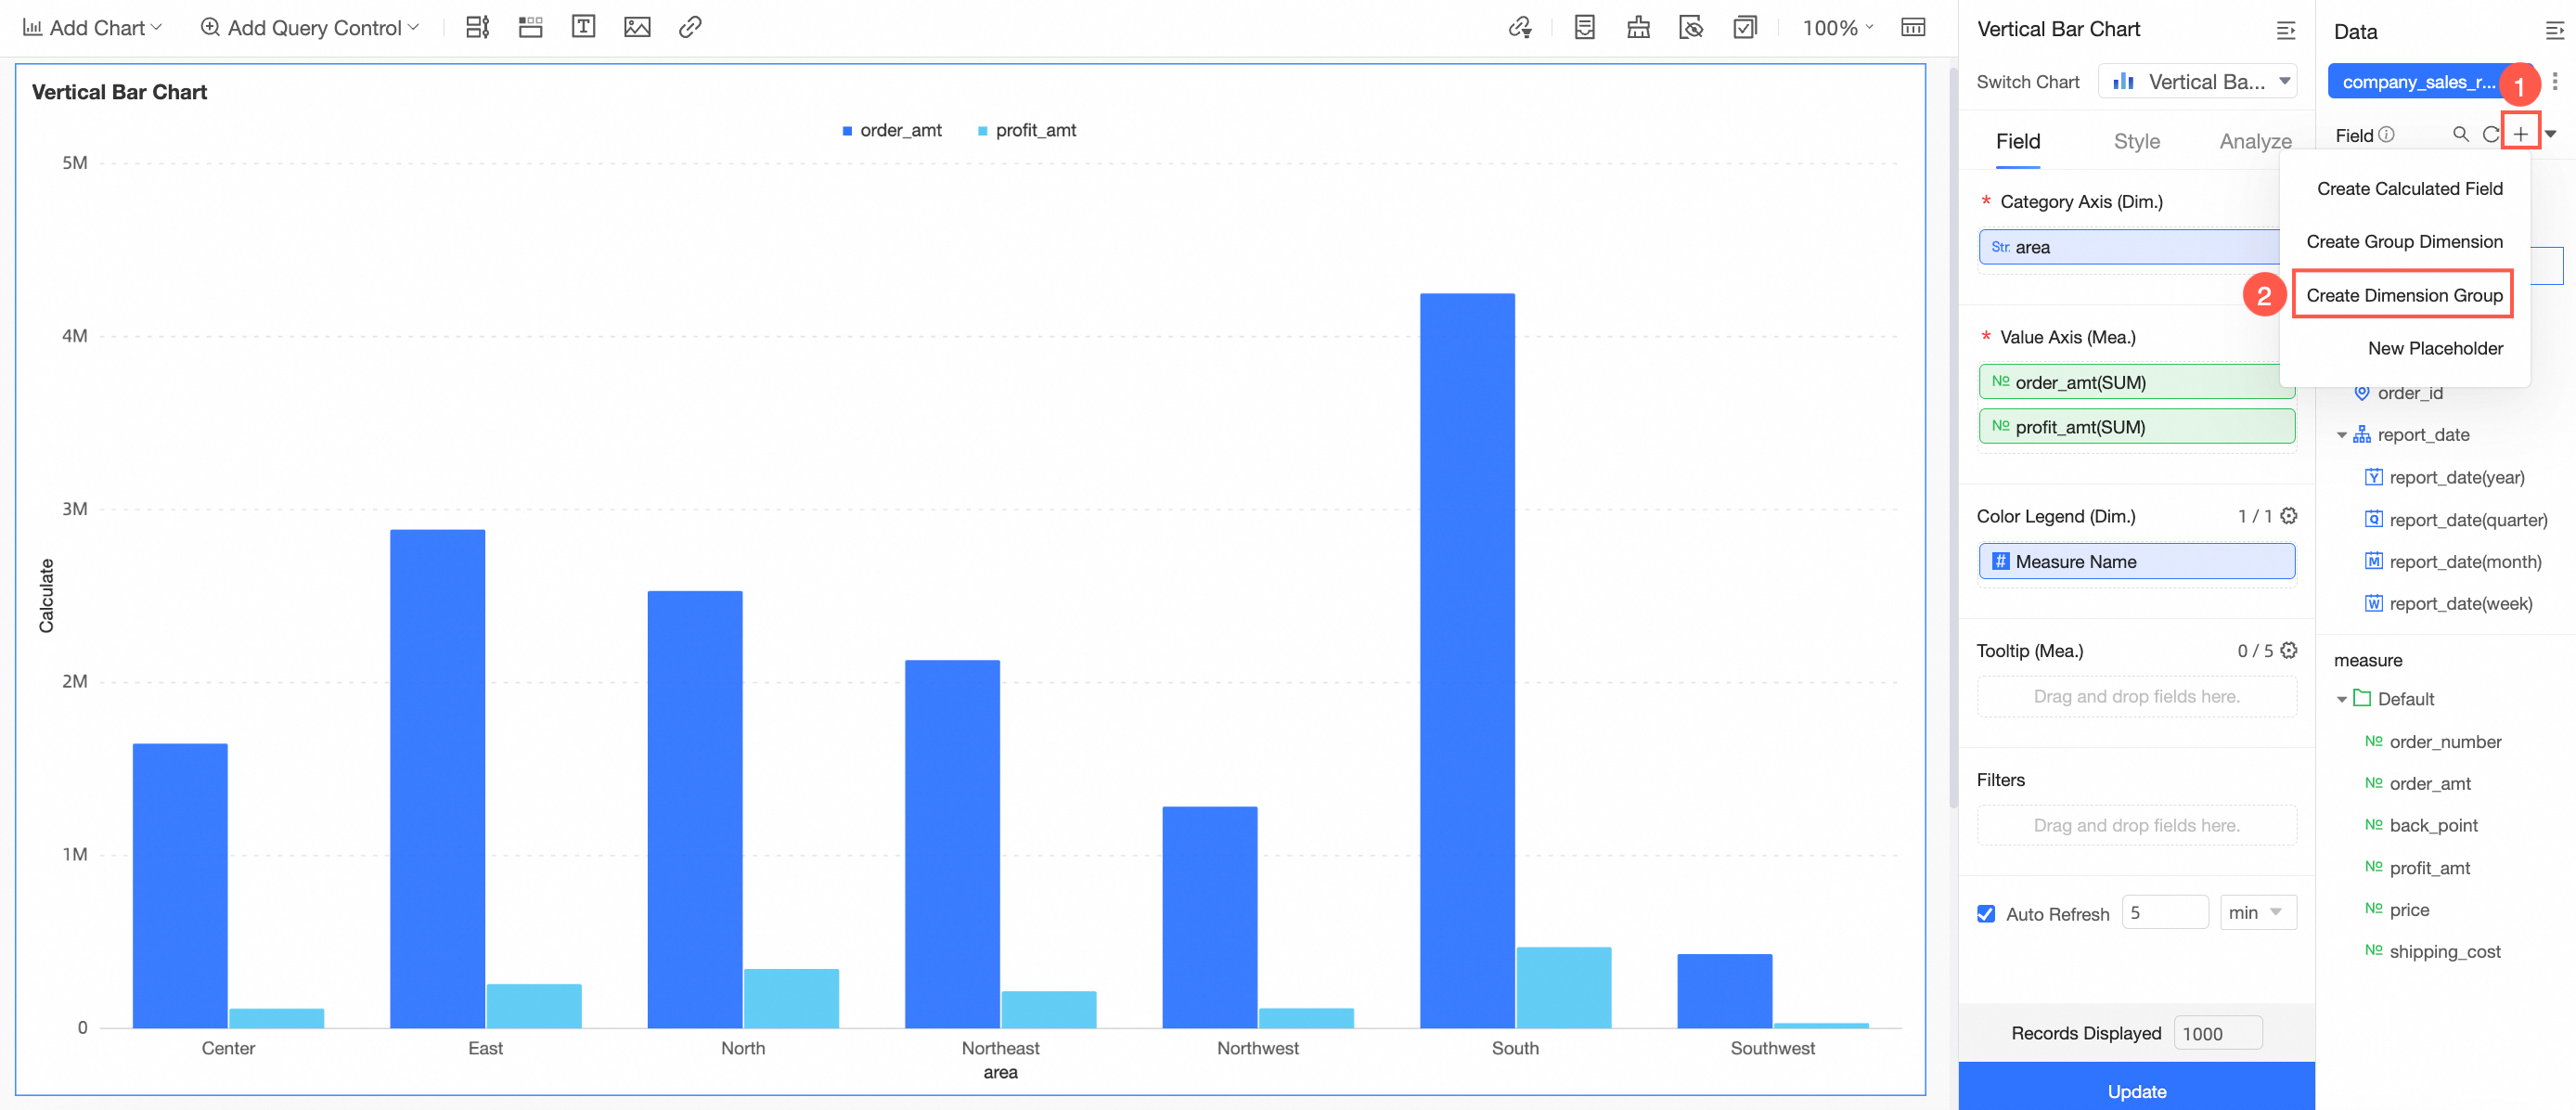
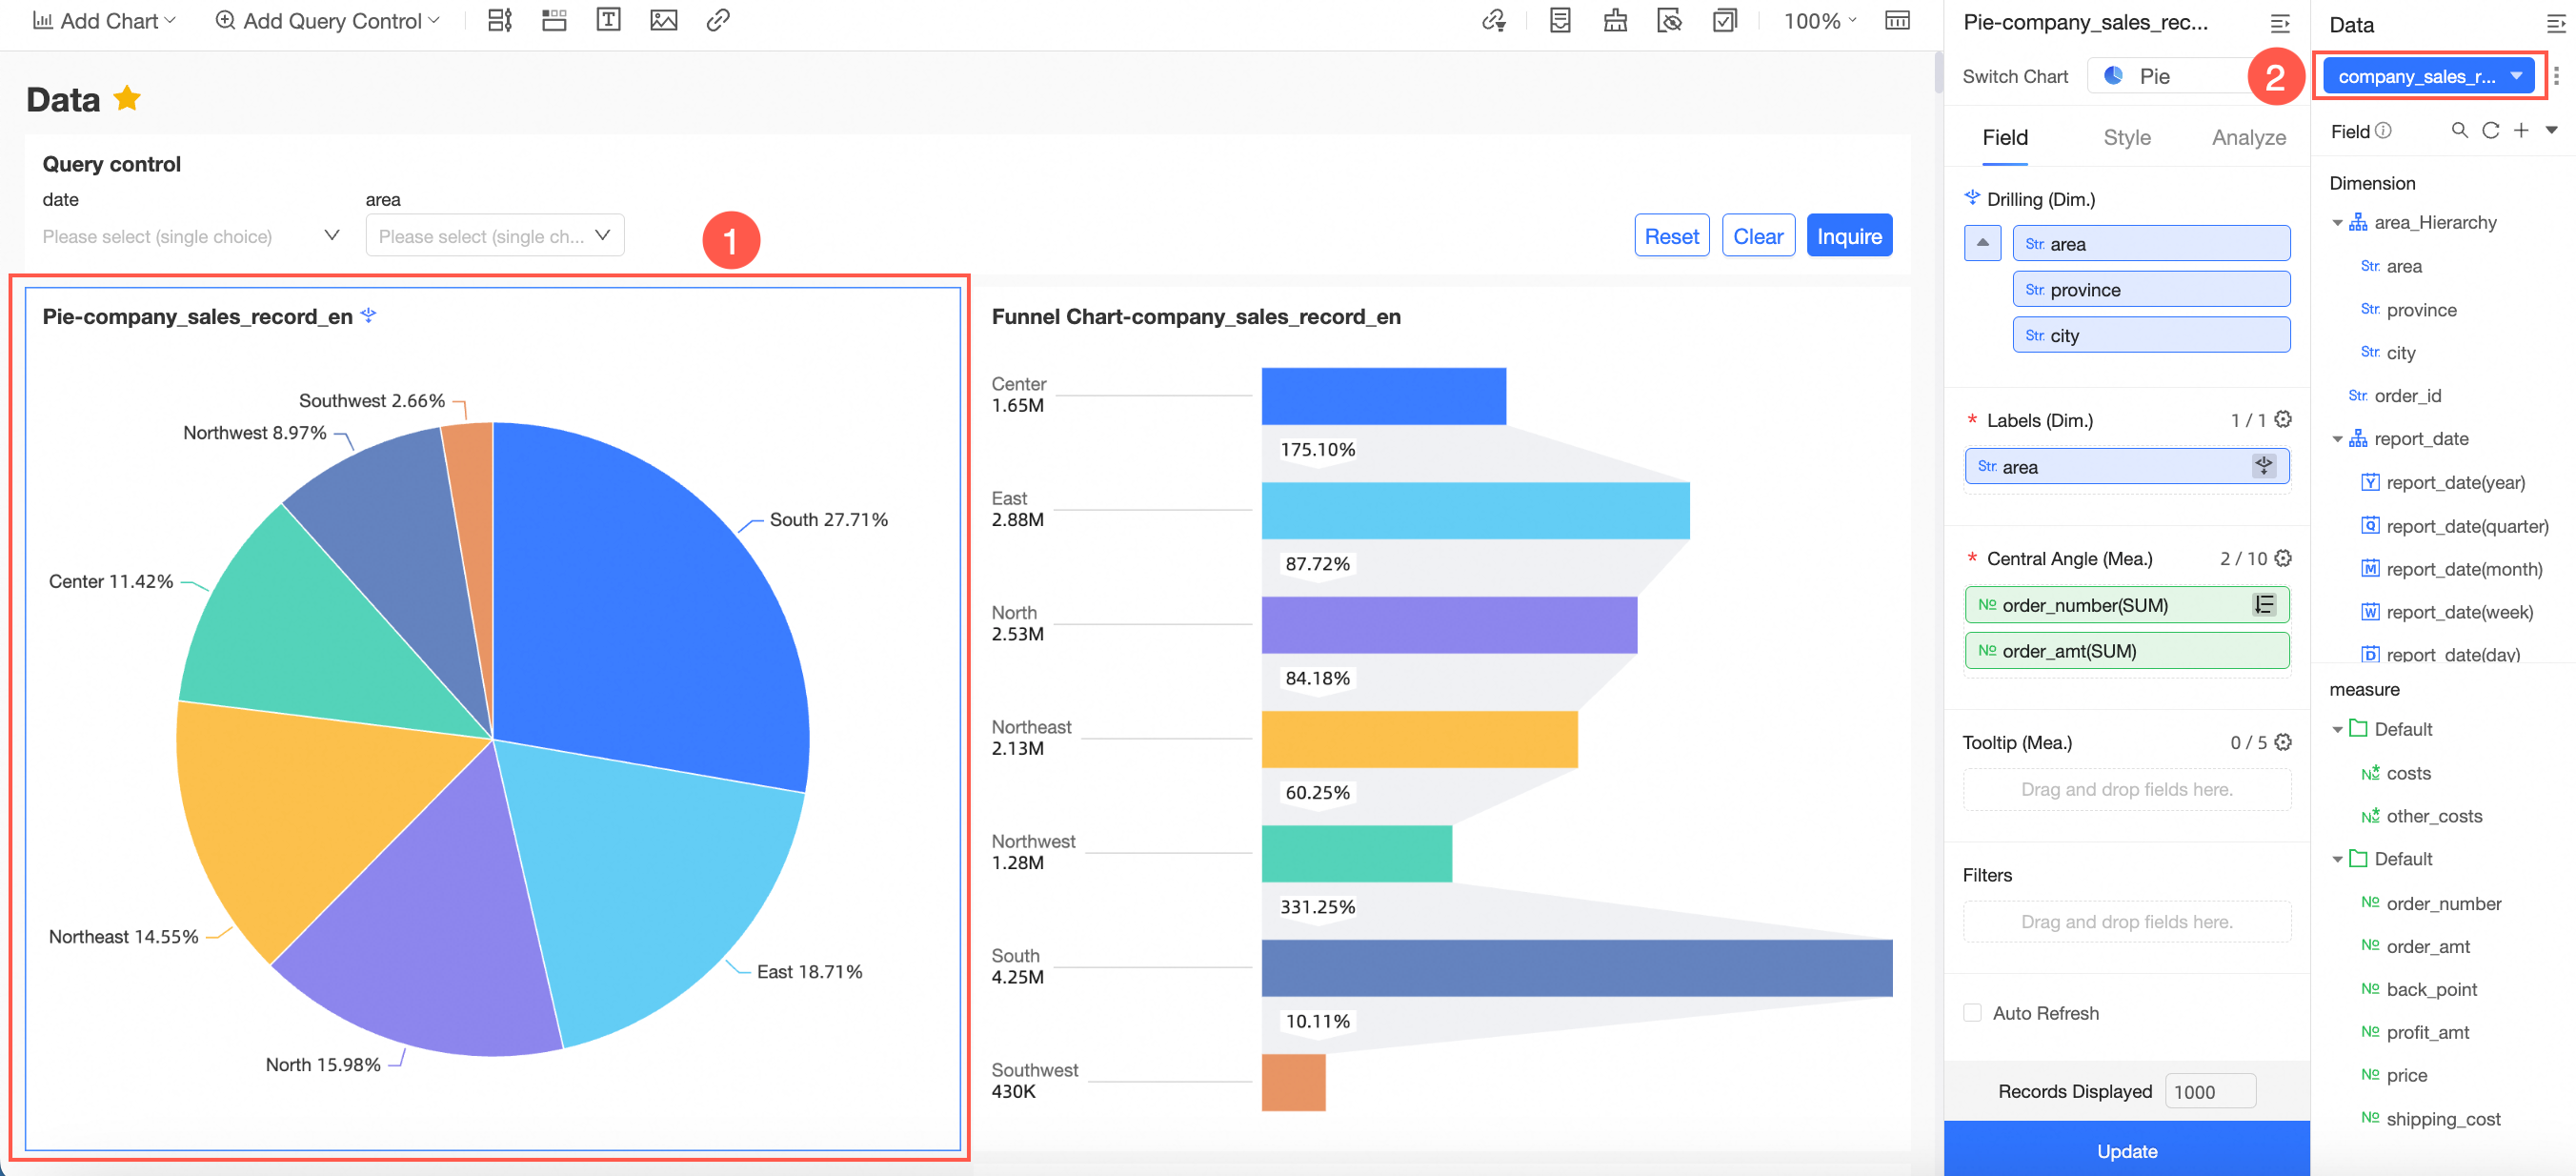
Create a dimension group
Follow the steps in the figure to open the Create Dimension Group page.
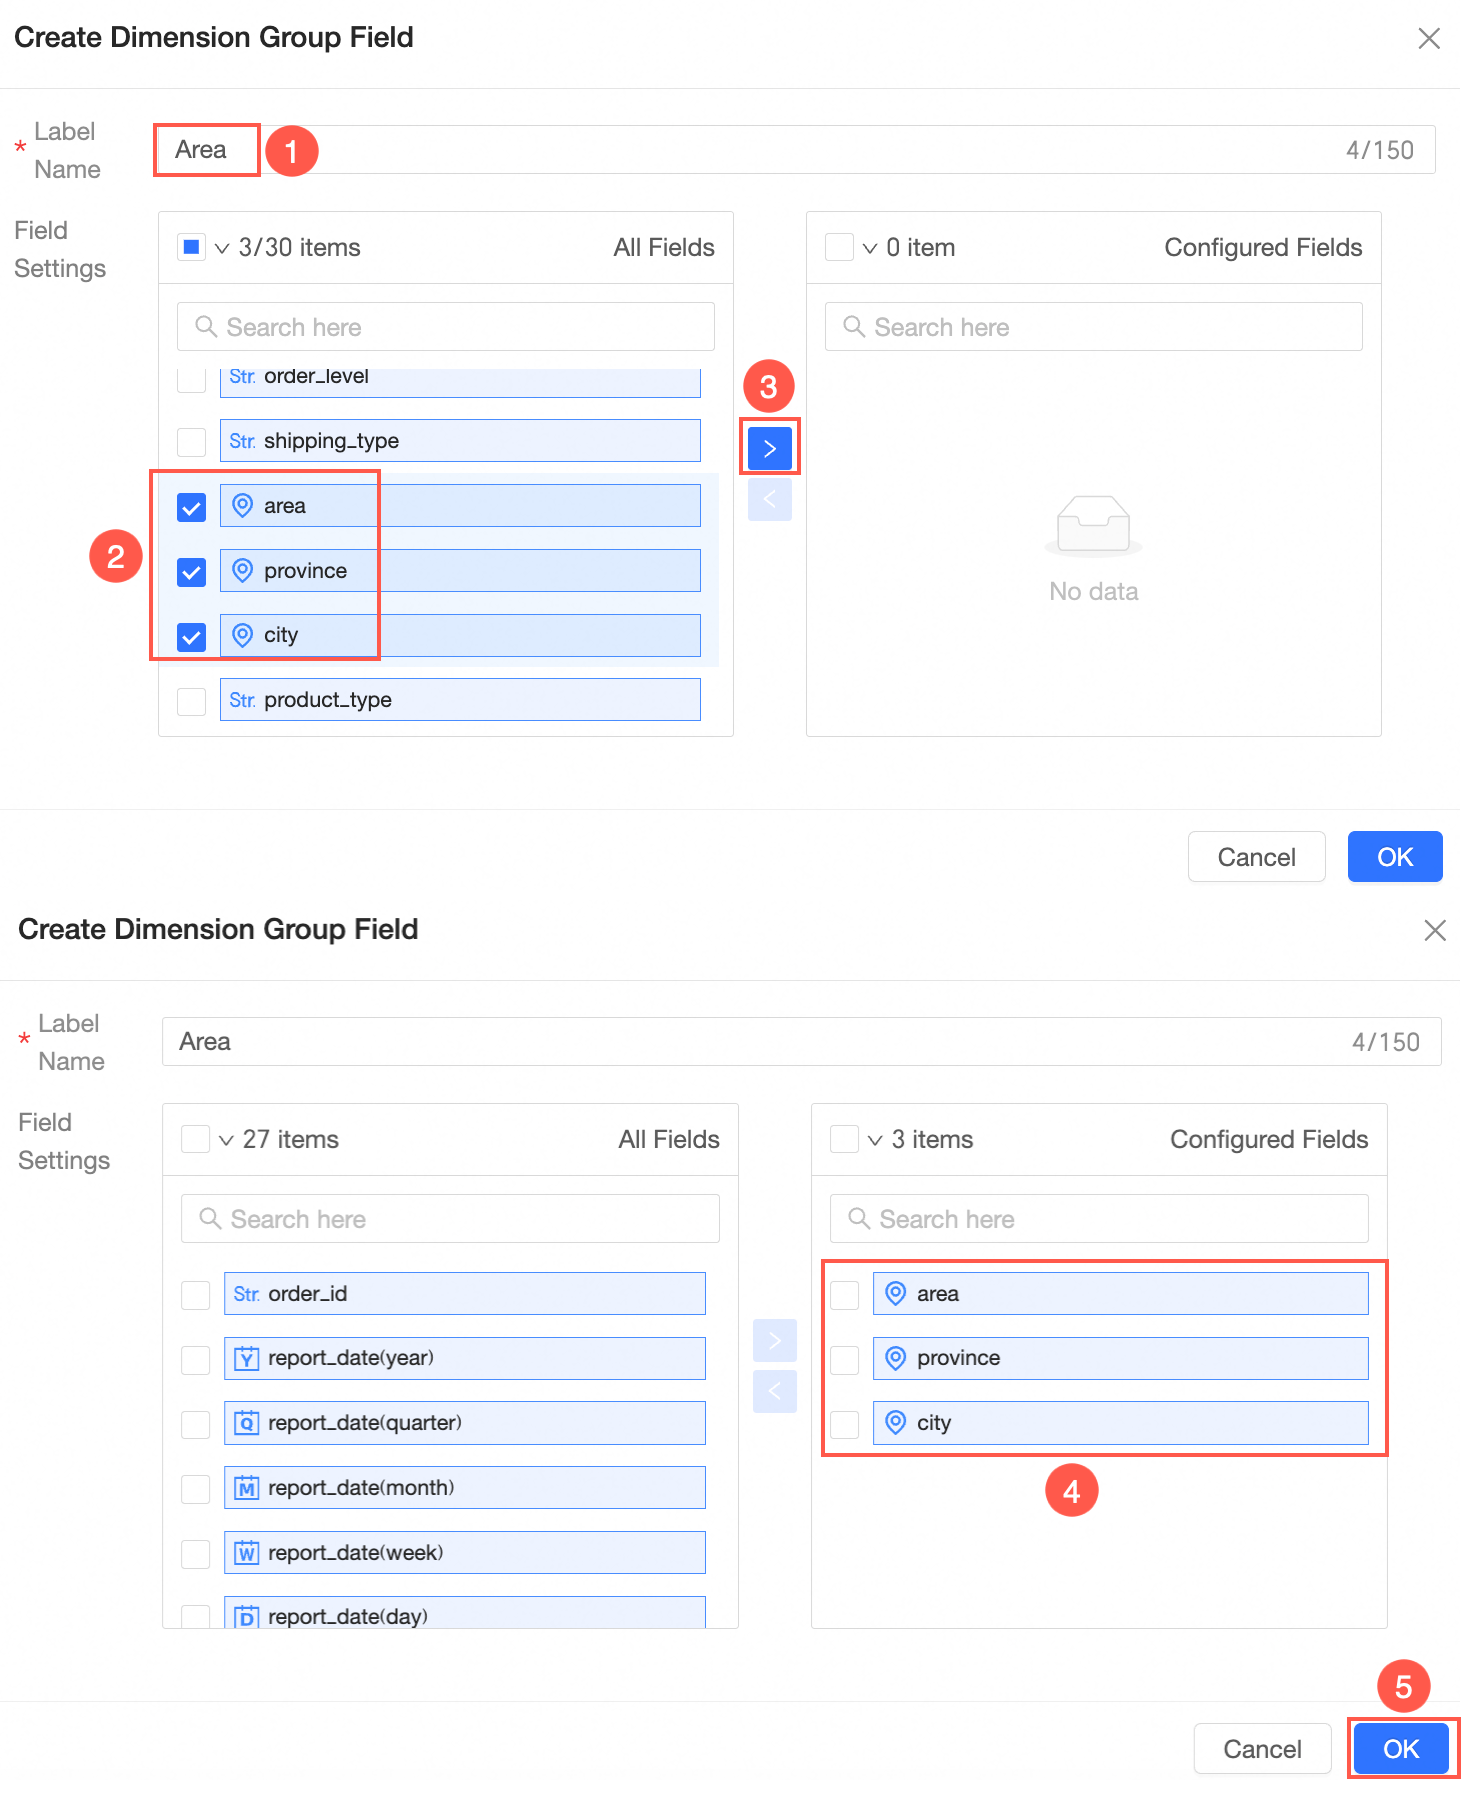
Follow the steps in the figure to create a dimension group field.
Drag the new dimension group to the dimension area and click Update.
You can now switch between the fields in the dimension group to view the corresponding data.
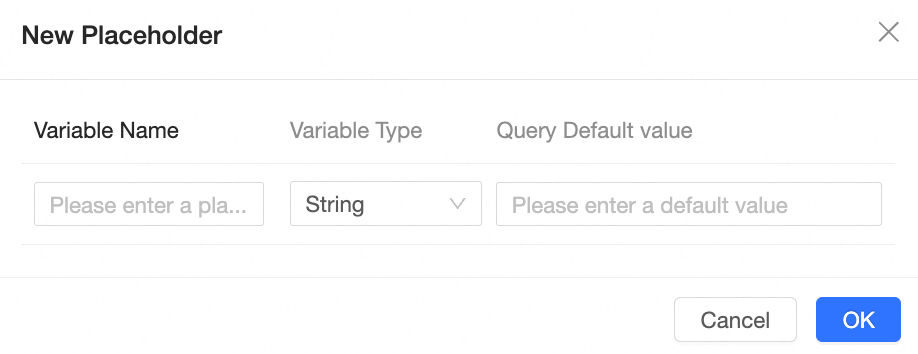
Create a placeholder
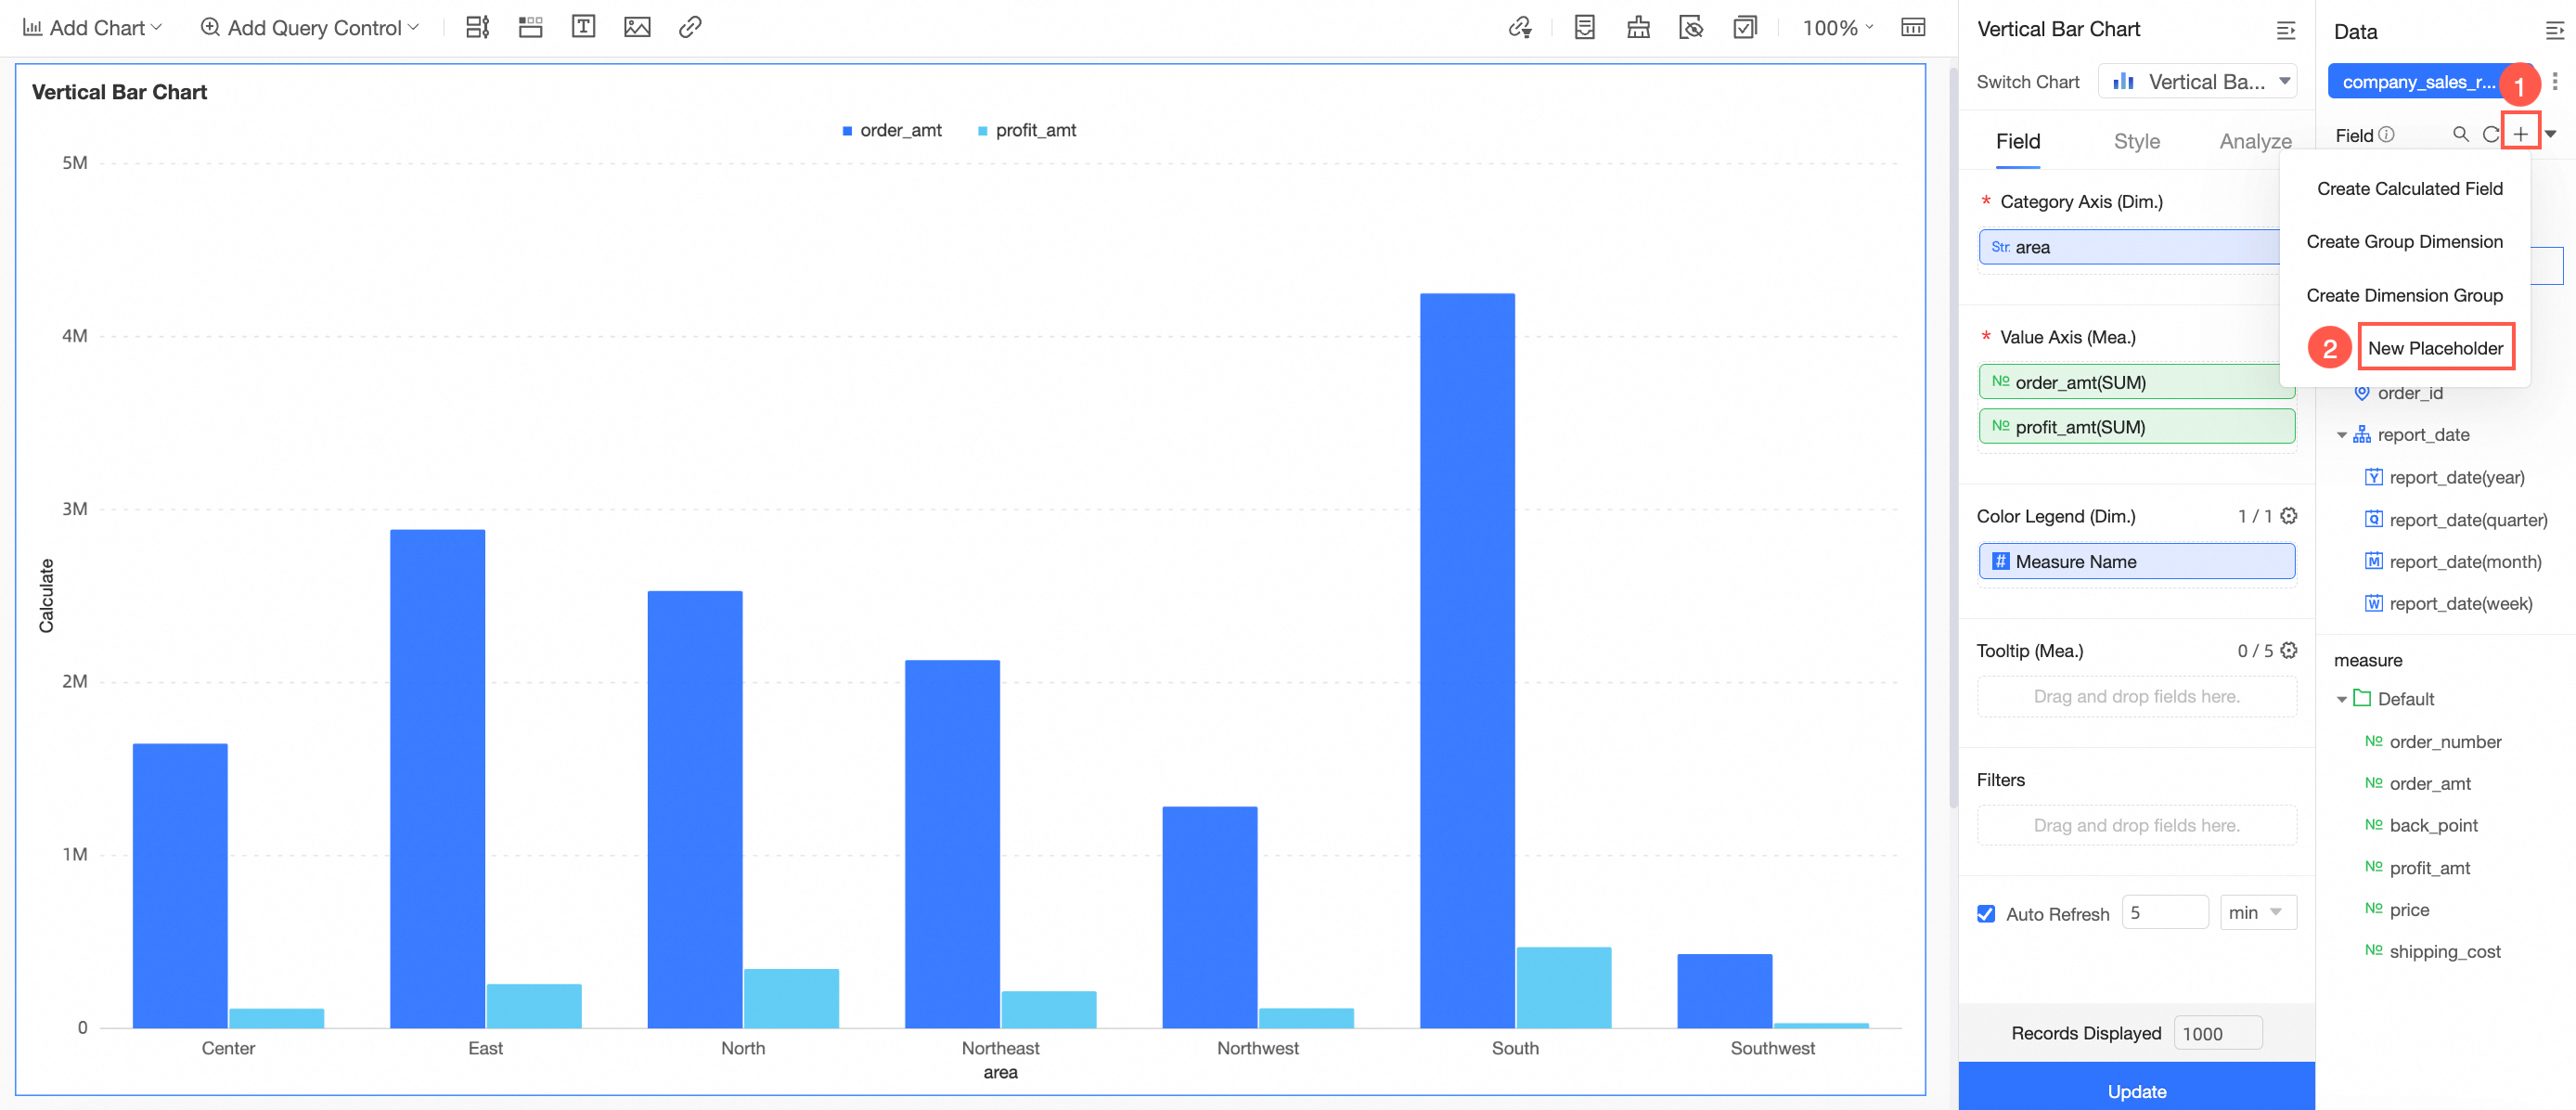
On the Create Placeholder page, you can enter a Variable Name, Variable Type, and Default Query Value.
After the placeholder is created, you can associate it with a query control.
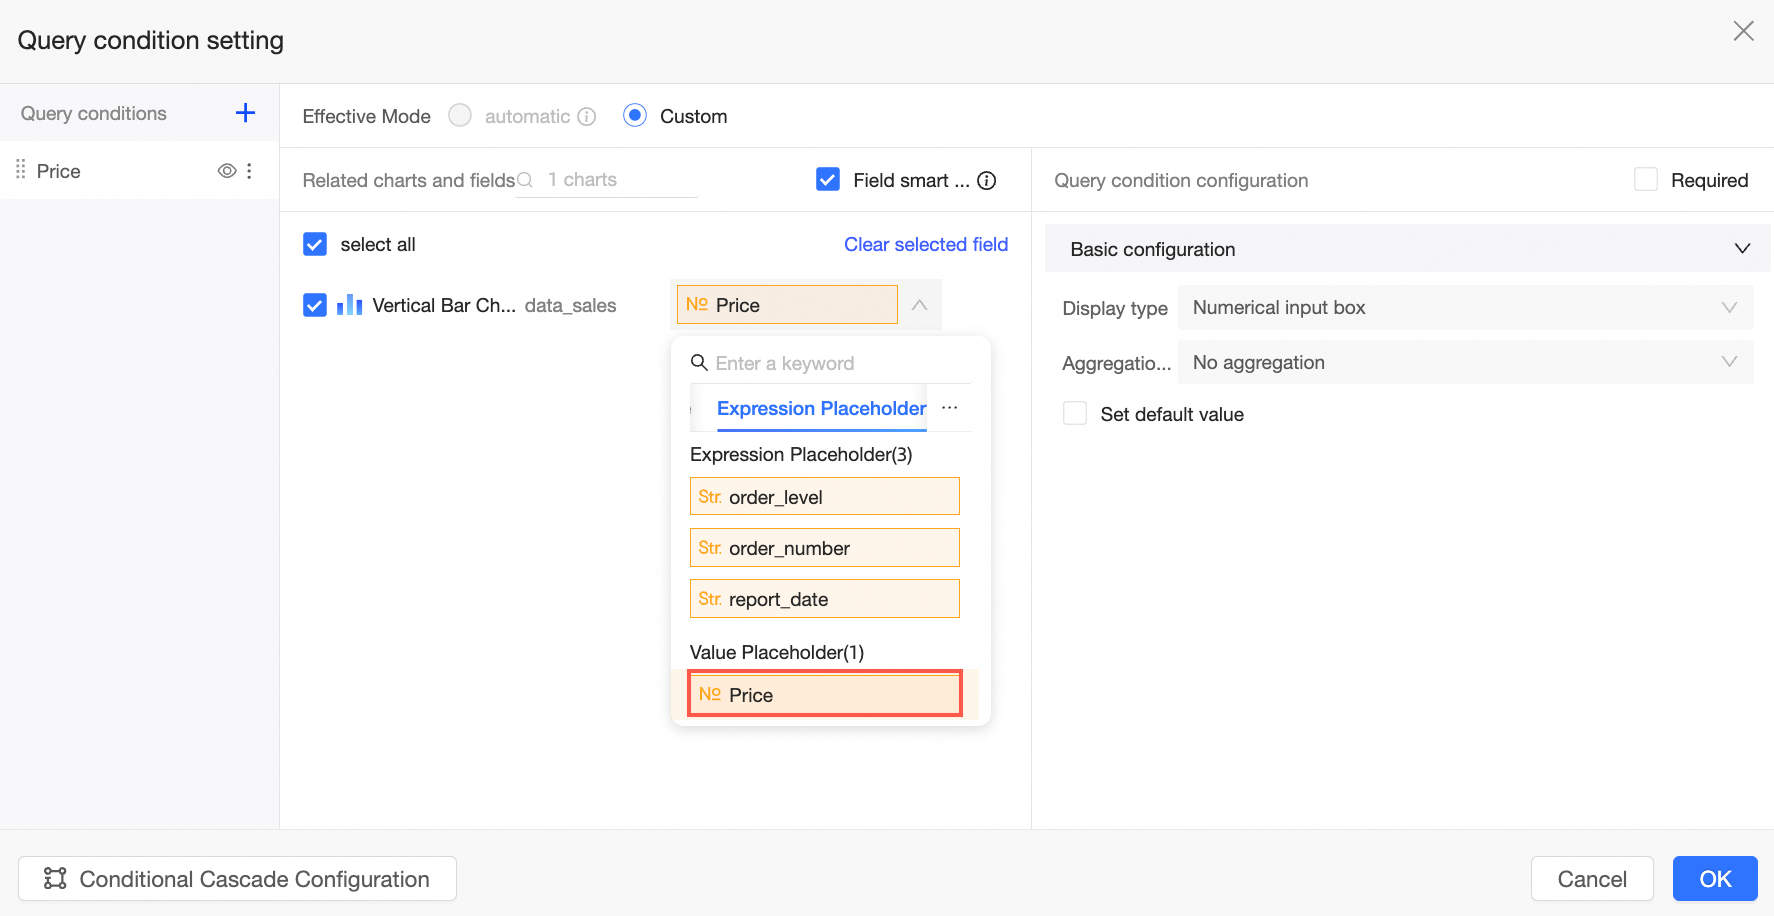
For detailed instructions and use cases, see Placeholders.
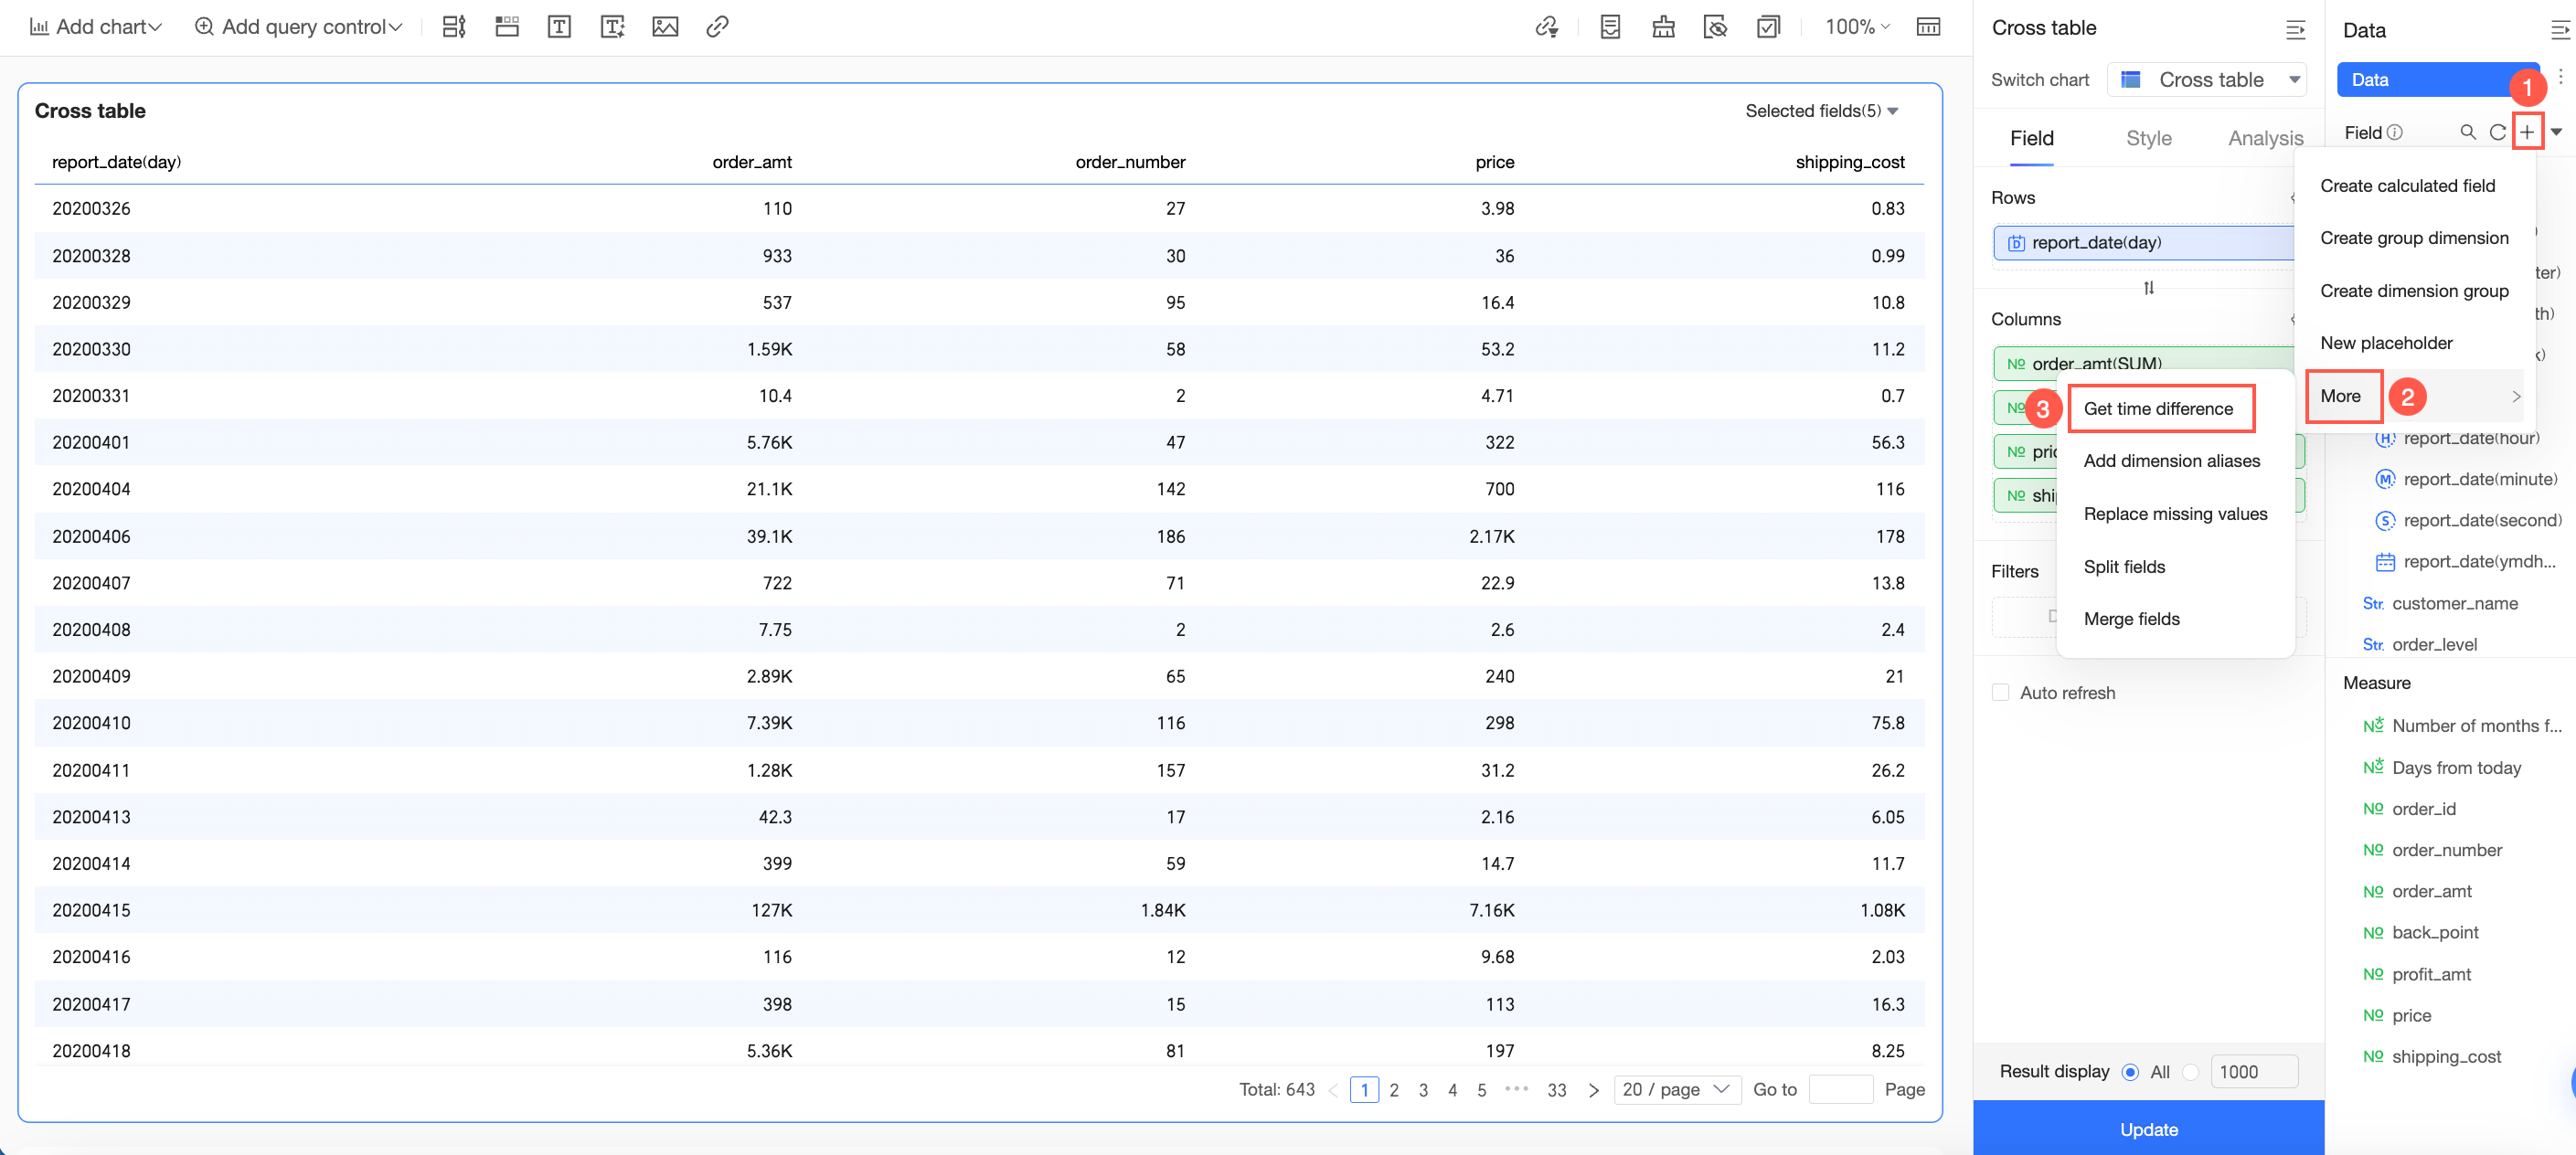
Get time difference
Calculate the time difference between two date fields and return a number. Only complete calculation units are counted.
For detailed instructions, see Get time difference.
Add dimension value aliases
Create aliases for the enumerated values of a text field.

For detailed instructions, see Add an alias for dimension values.
Replace missing values
Replace null values and empty strings with other content. This function modifies the data itself, not just the display style.

For detailed instructions, see Replace missing values.
Split field
Split a text field into multiple fields based on a delimiter.

For detailed instructions, see Split field.
Merge fields
Merge multiple text fields into a single new field with a connector.
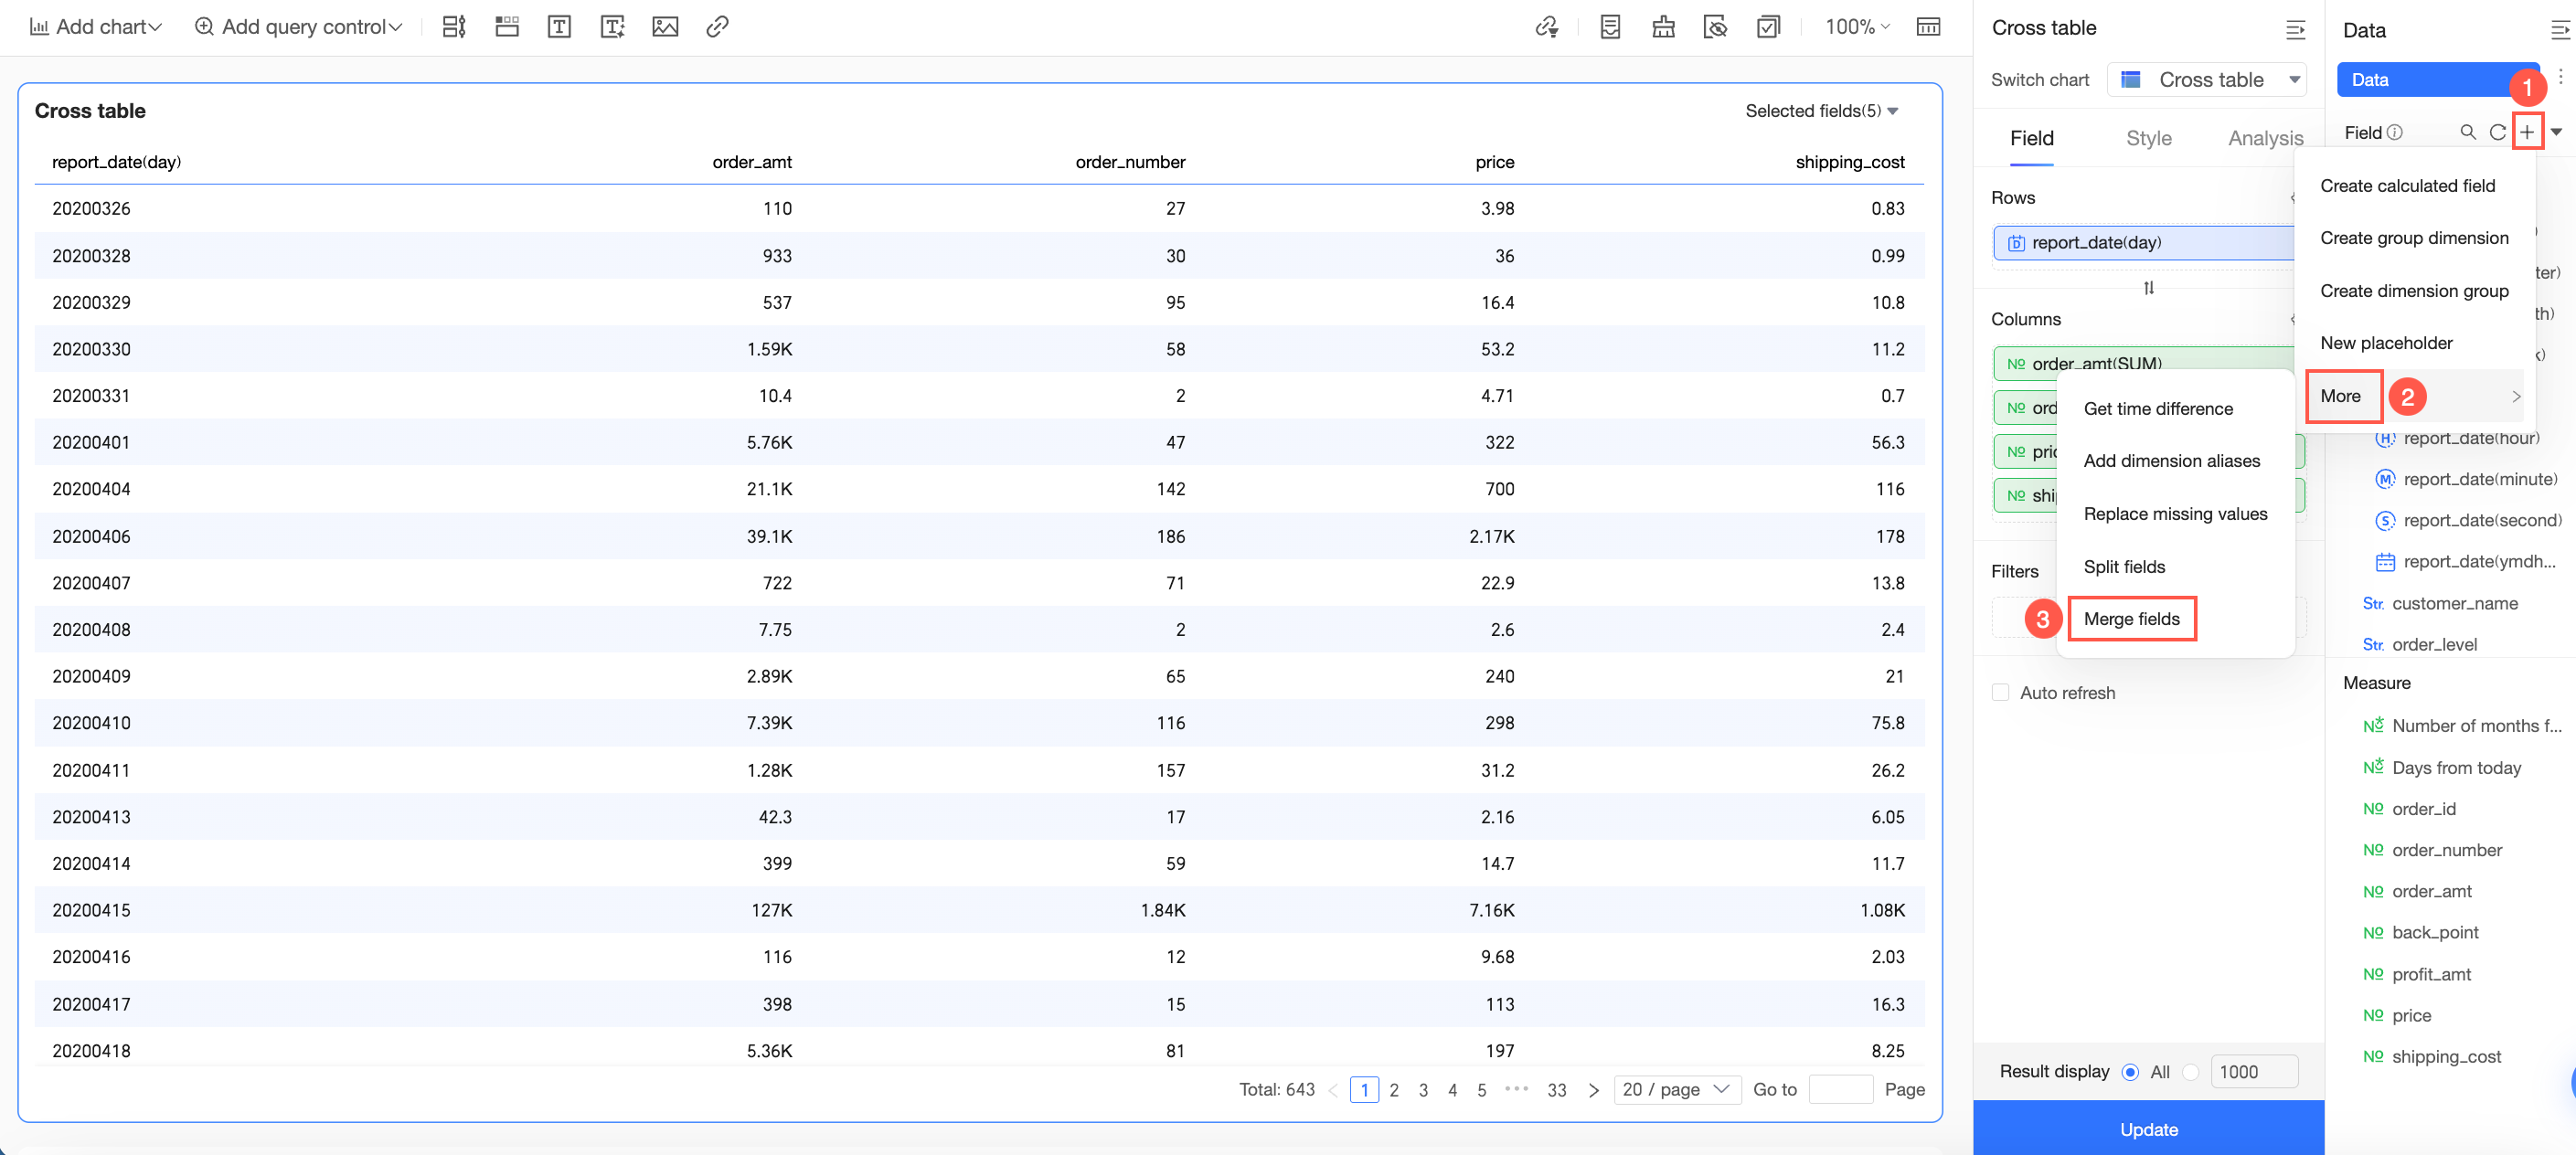
For detailed instructions, see Merge fields.
Change dataset
Replacement entry point
After you click the switch box, you can switch between used datasets and all datasets. This action clears the field configuration.
If you want to replace the dataset while retaining the field configuration, click the
icon to replace the current dataset.
For detailed instructions, see Replace a dataset.
Create a dataset
Upload local file
Use a local file as a source table to create a chart.
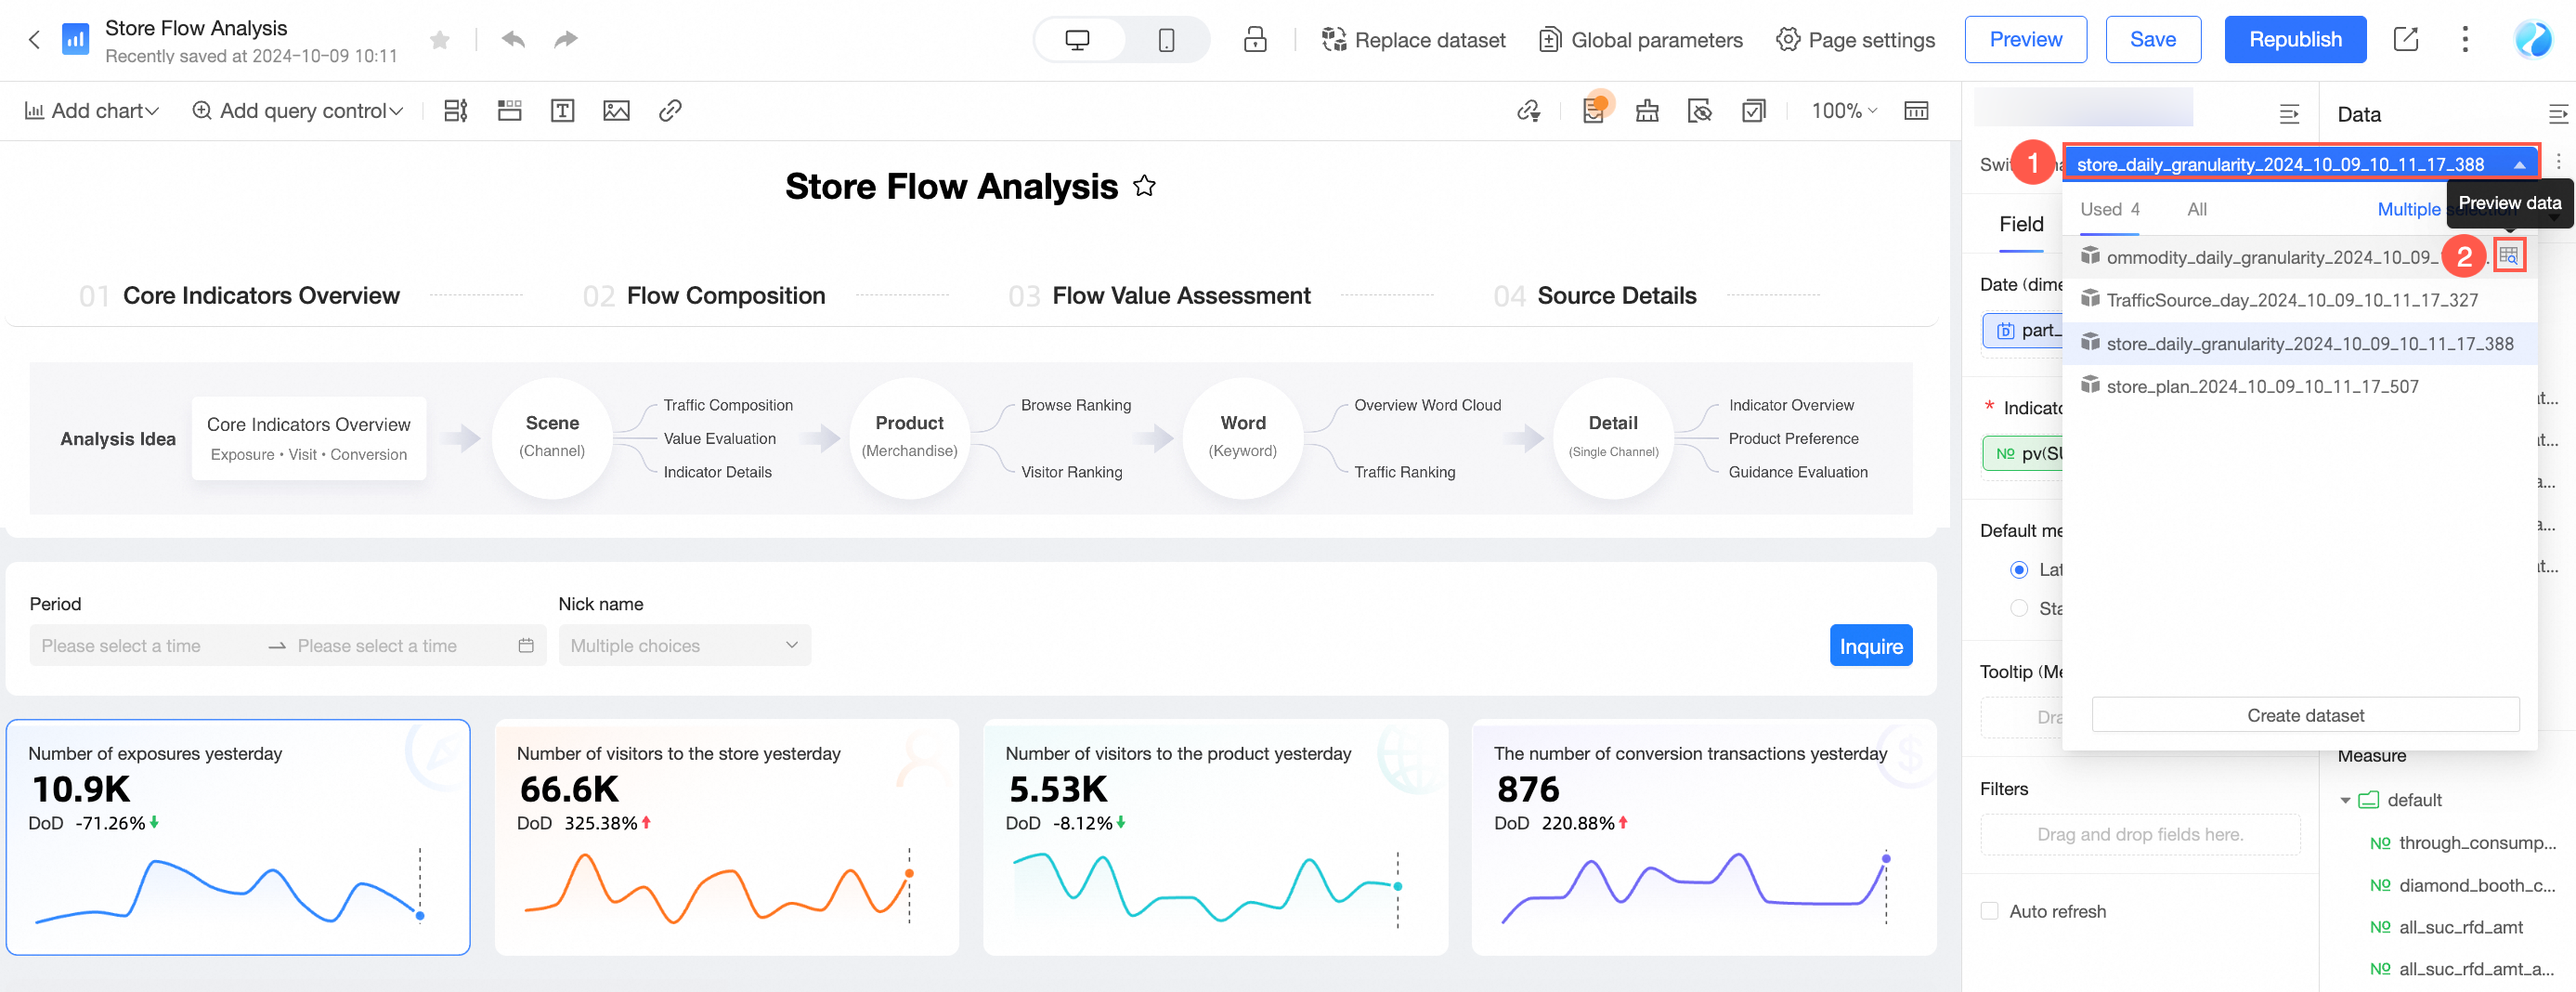
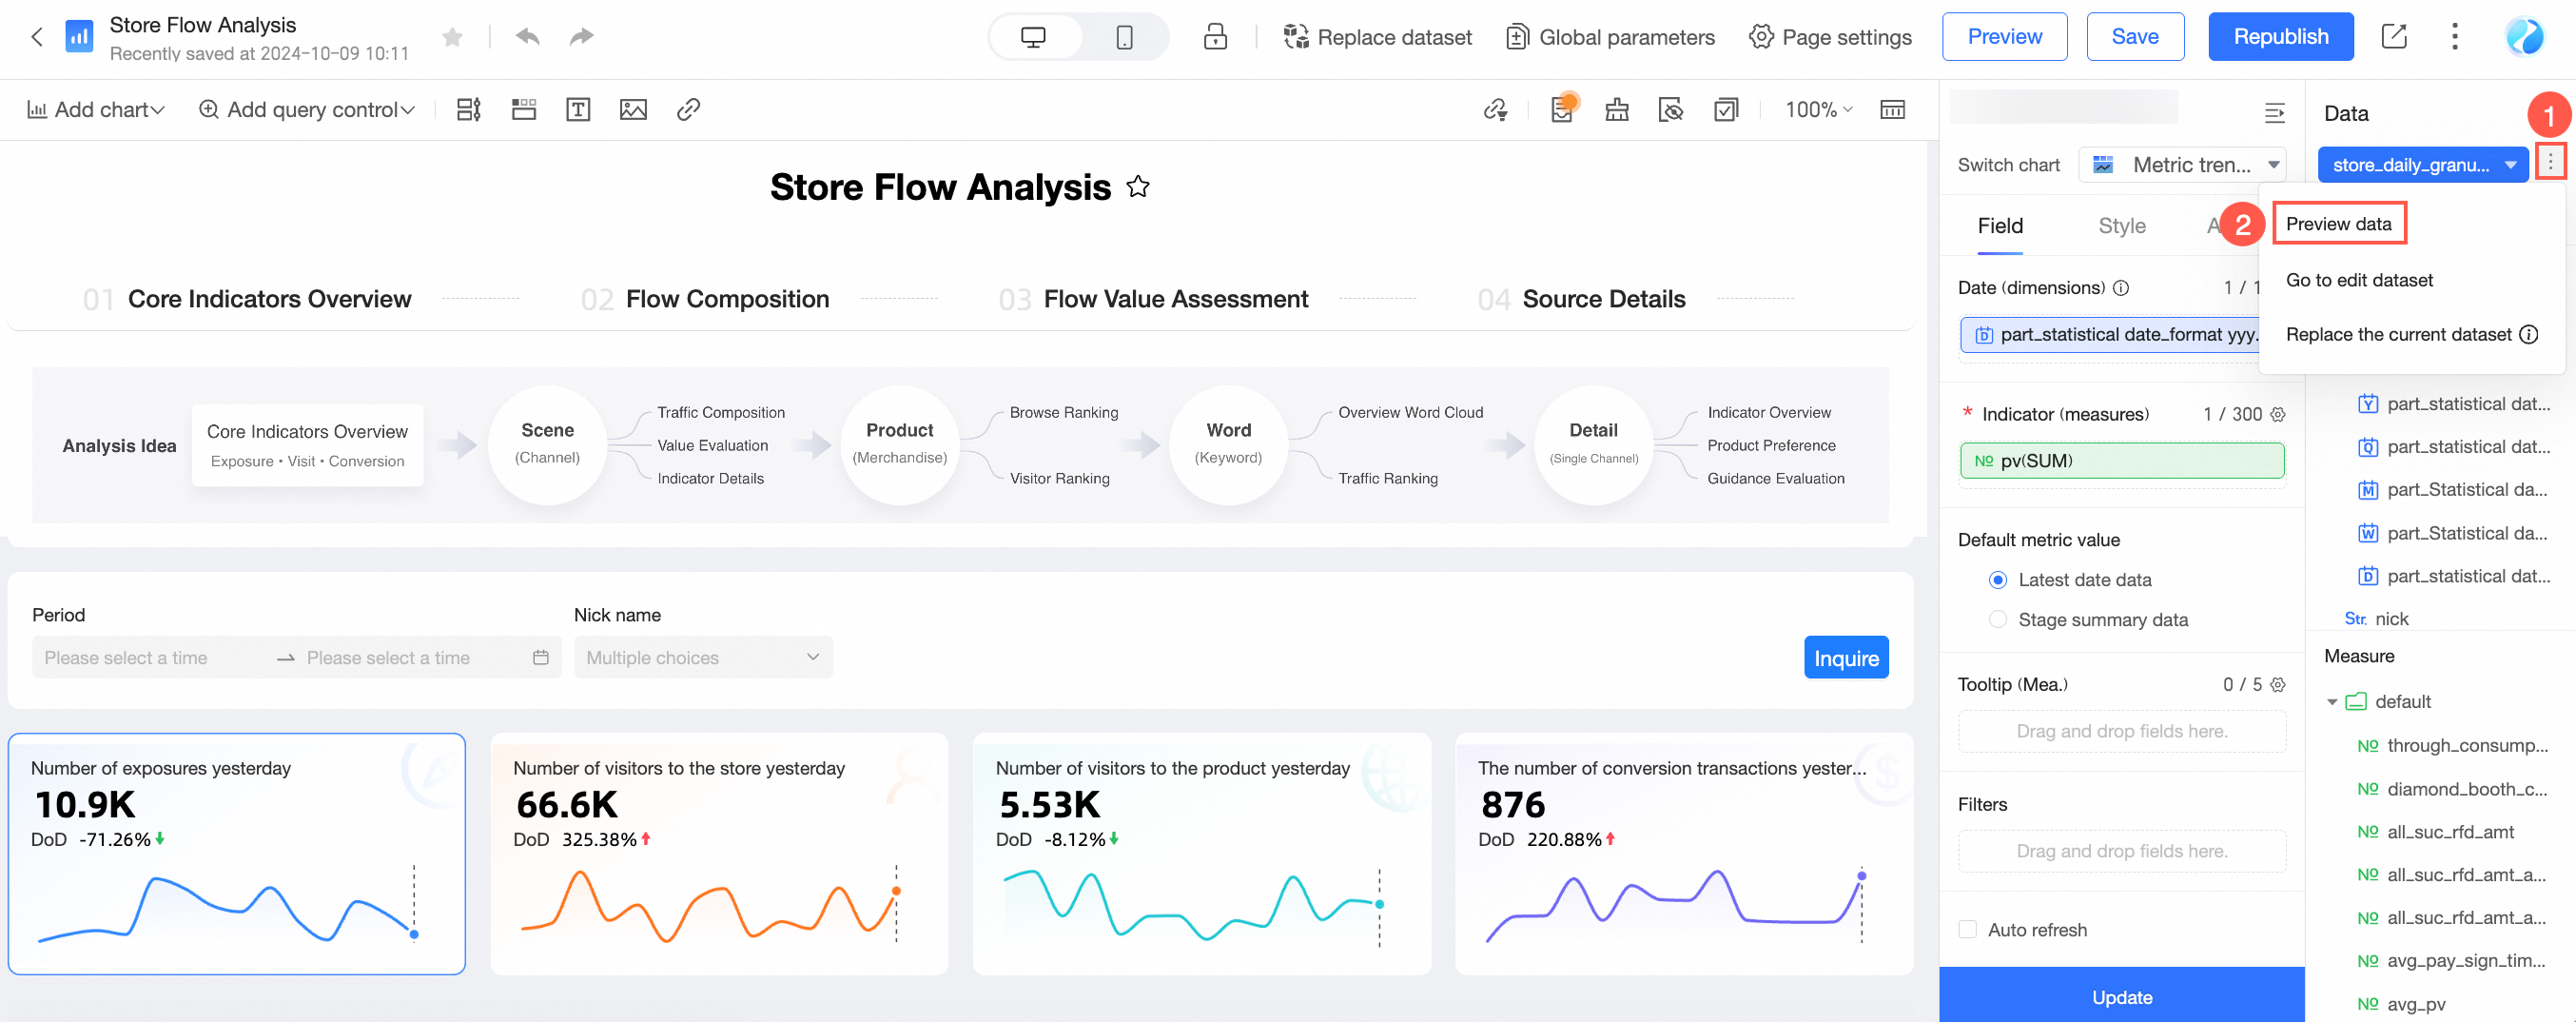
Preview dataset data
You can preview data in two ways:
Entry point 1:
Entry point 2:
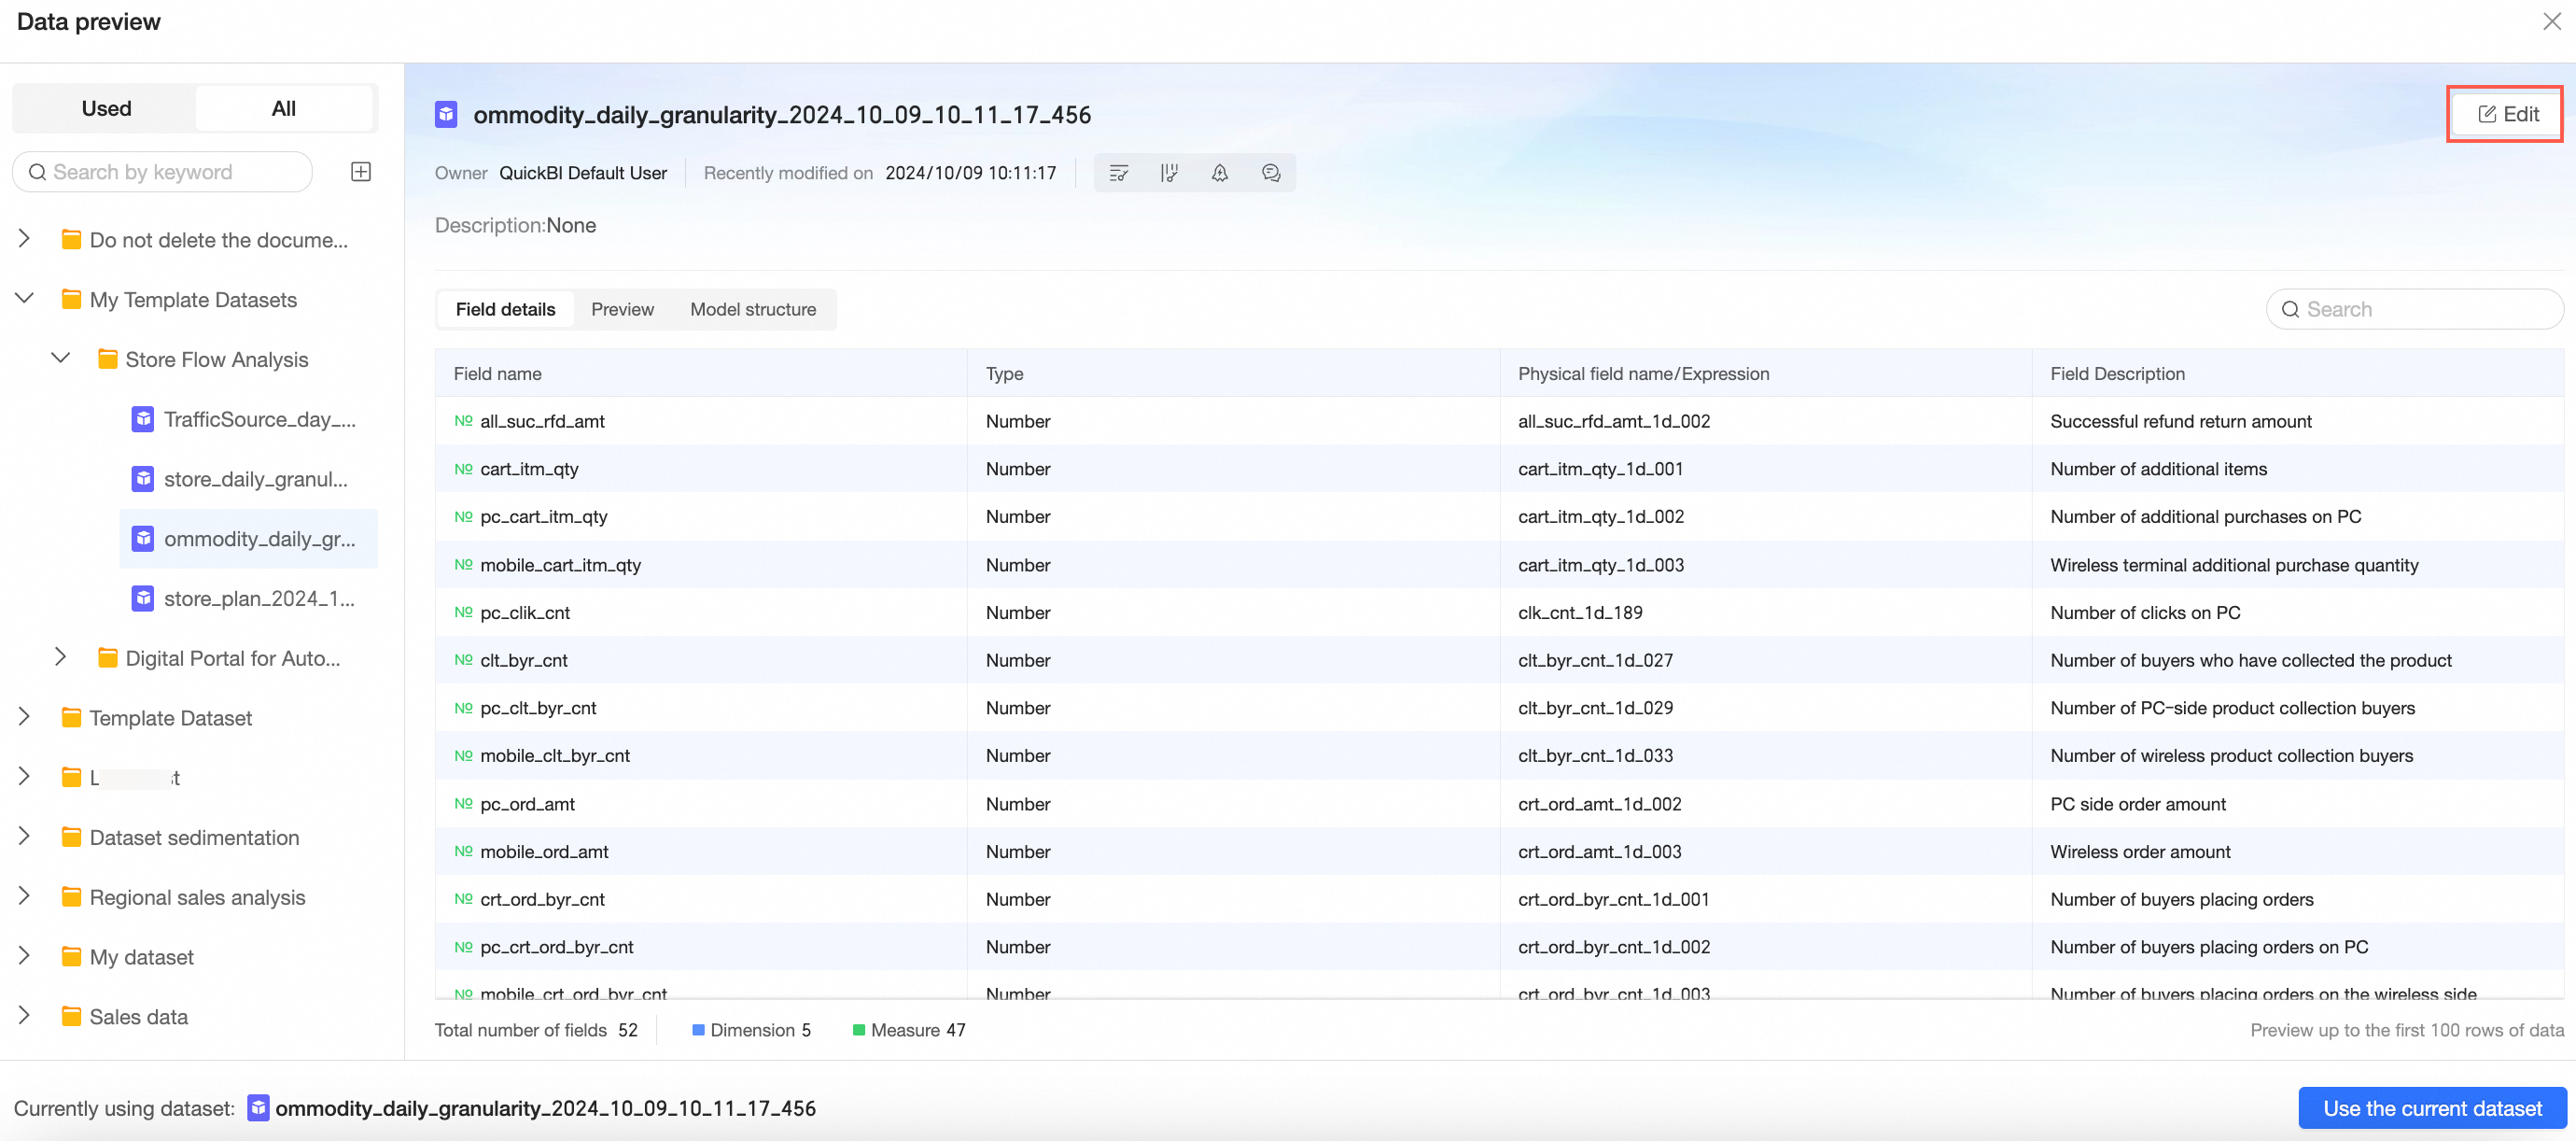
In the data preview interface, you can view the field details for both used and all datasets, preview data, and view the model structure. For more information, see Create a dataset.
Click the Edit icon in the upper-right corner to go to the dataset editing page.
For more information, see Create a dataset.
Click Use Current Dataset in the lower-right corner to switch to the currently previewed dataset.
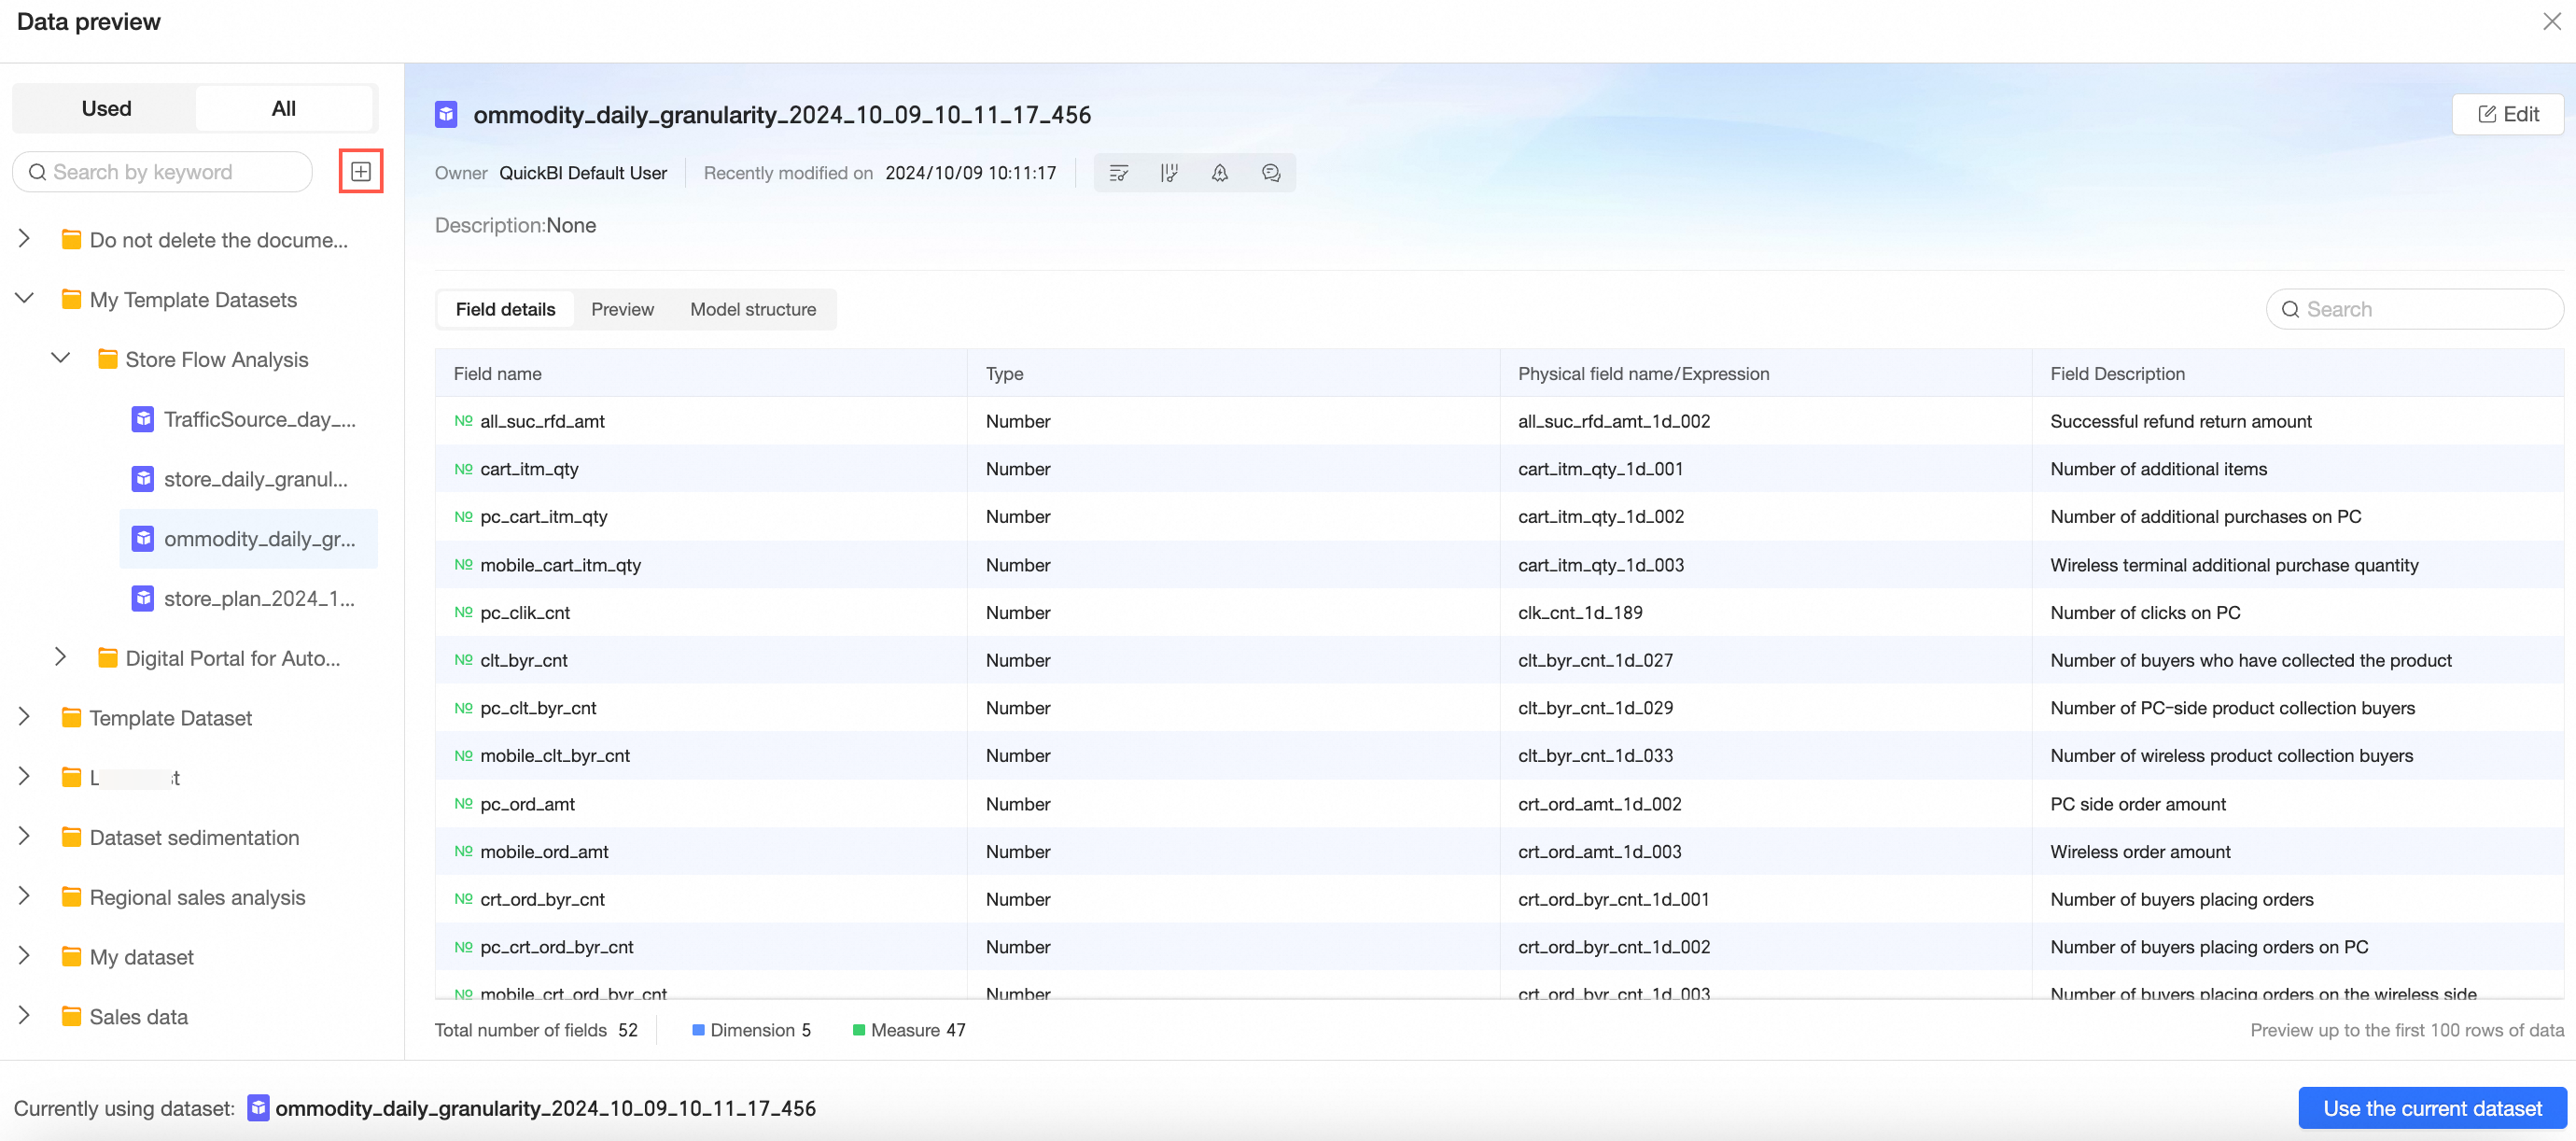
NoteThis action clears the previously used fields. If you want to retain the field configuration, you can click the
icon and select Replace current dataset. For more information, see Replace a dataset.Click the
icon in the list of all data sources on the left to go to the Create Dataset page.For more information, see Create a dataset.

Edit dataset

For example, when you need to create a map-based chart, you must change the geographic dimension field to geographic information.
For more operations on editing datasets, see Create a dataset.