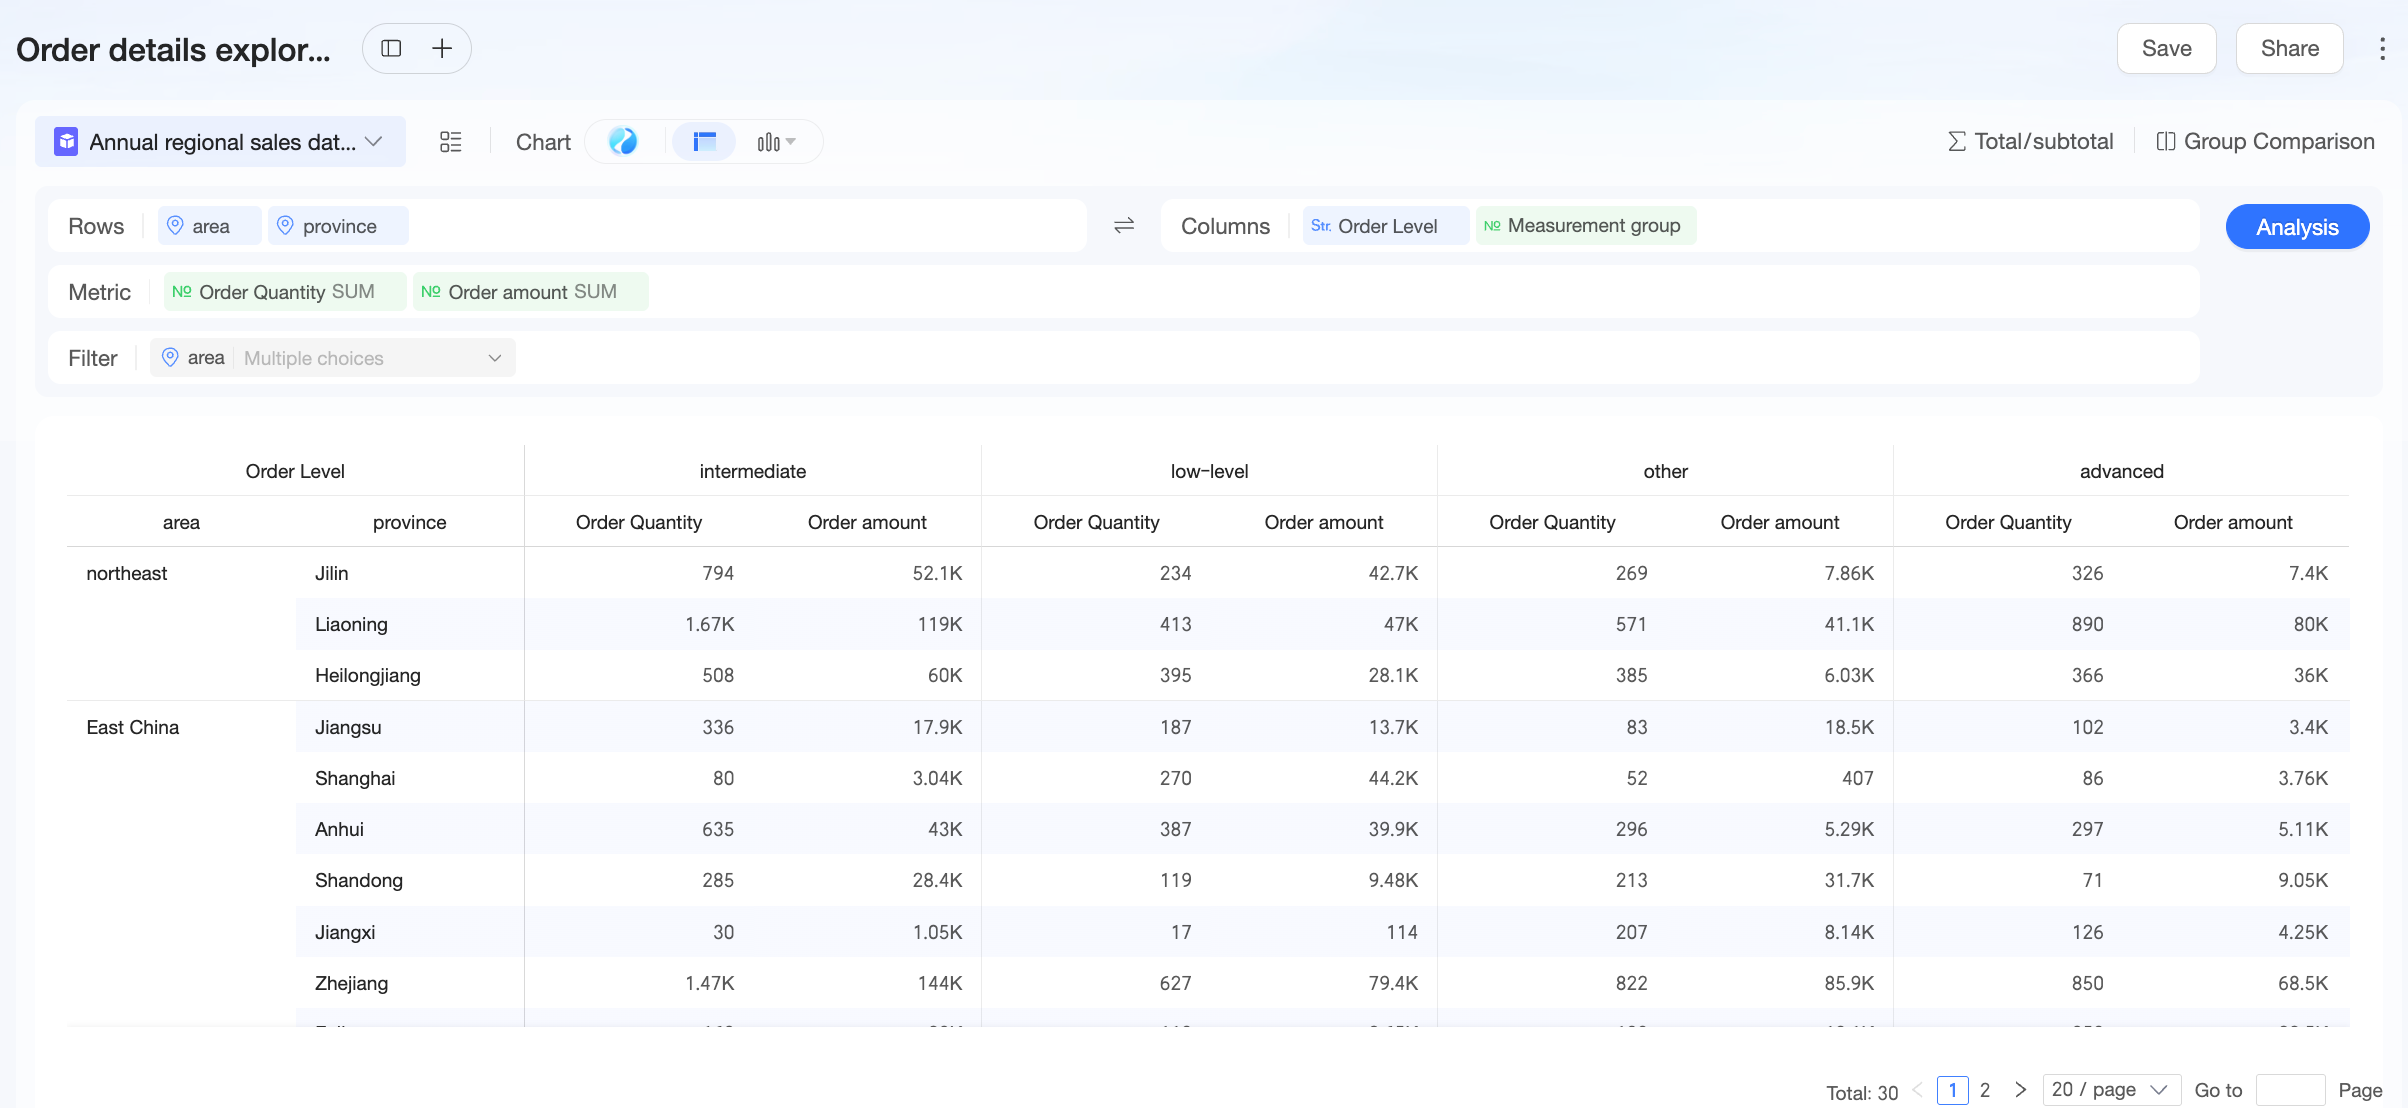
Exploration lets you move beyond the fixed views of traditional reports. Select any dataset you can access in your organization and configure dimensions, measures, and filters for in-depth data analysis.
Dataset selection
-
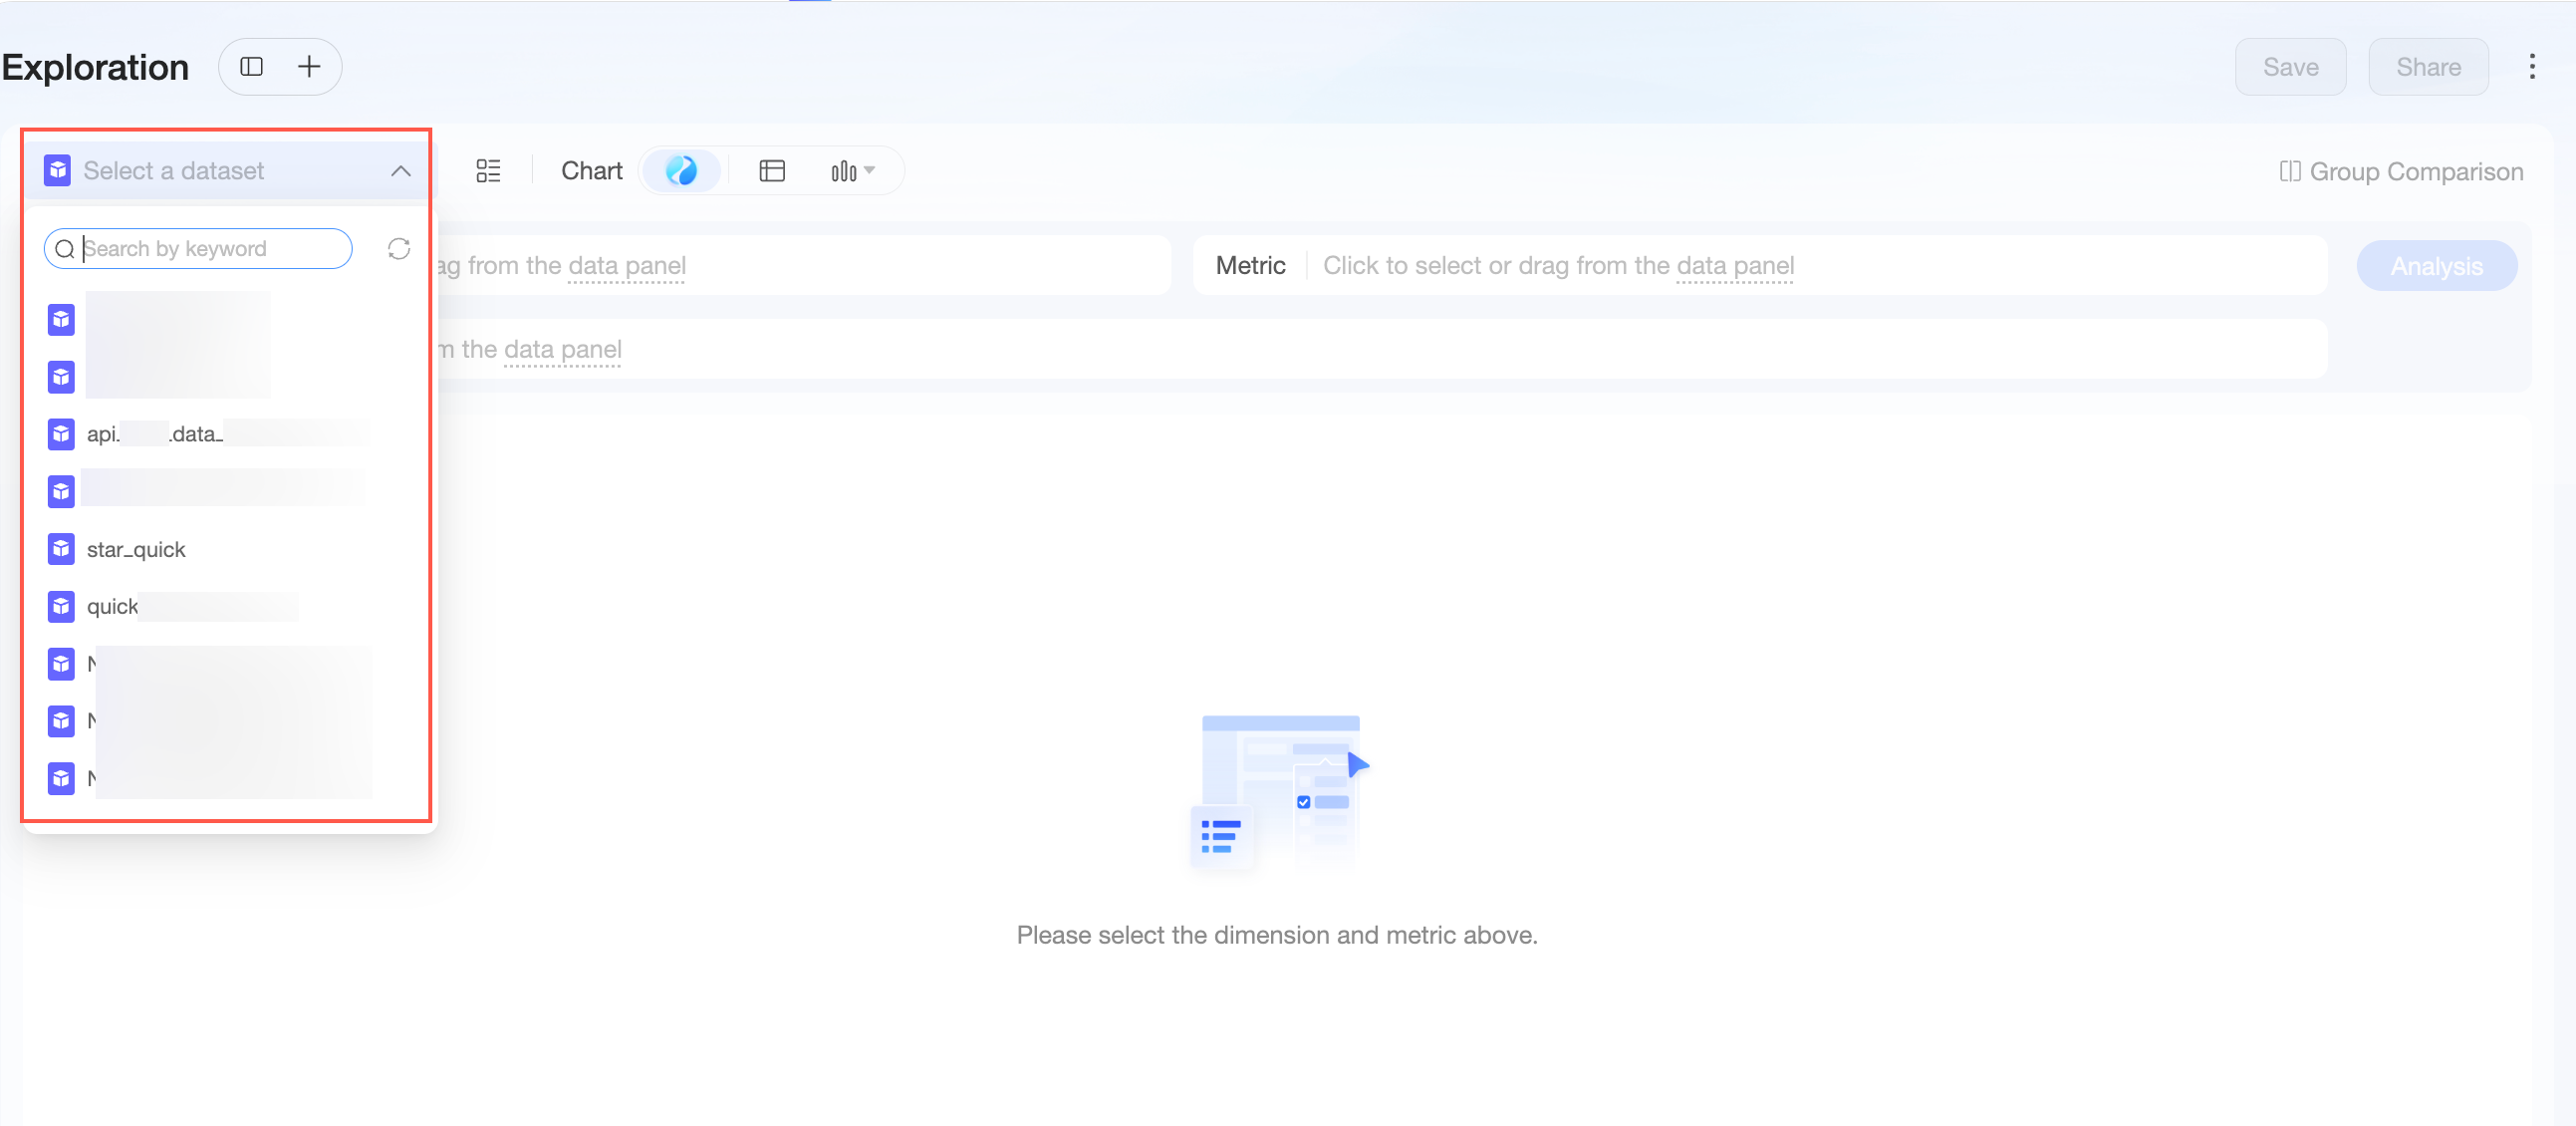
On the Exploration page, select the dataset you want to analyze from the drop-down list. This list displays all datasets you can access across all workspaces in your current organization.
-
Hover over a dataset and click the
 icon on the right to Preview data.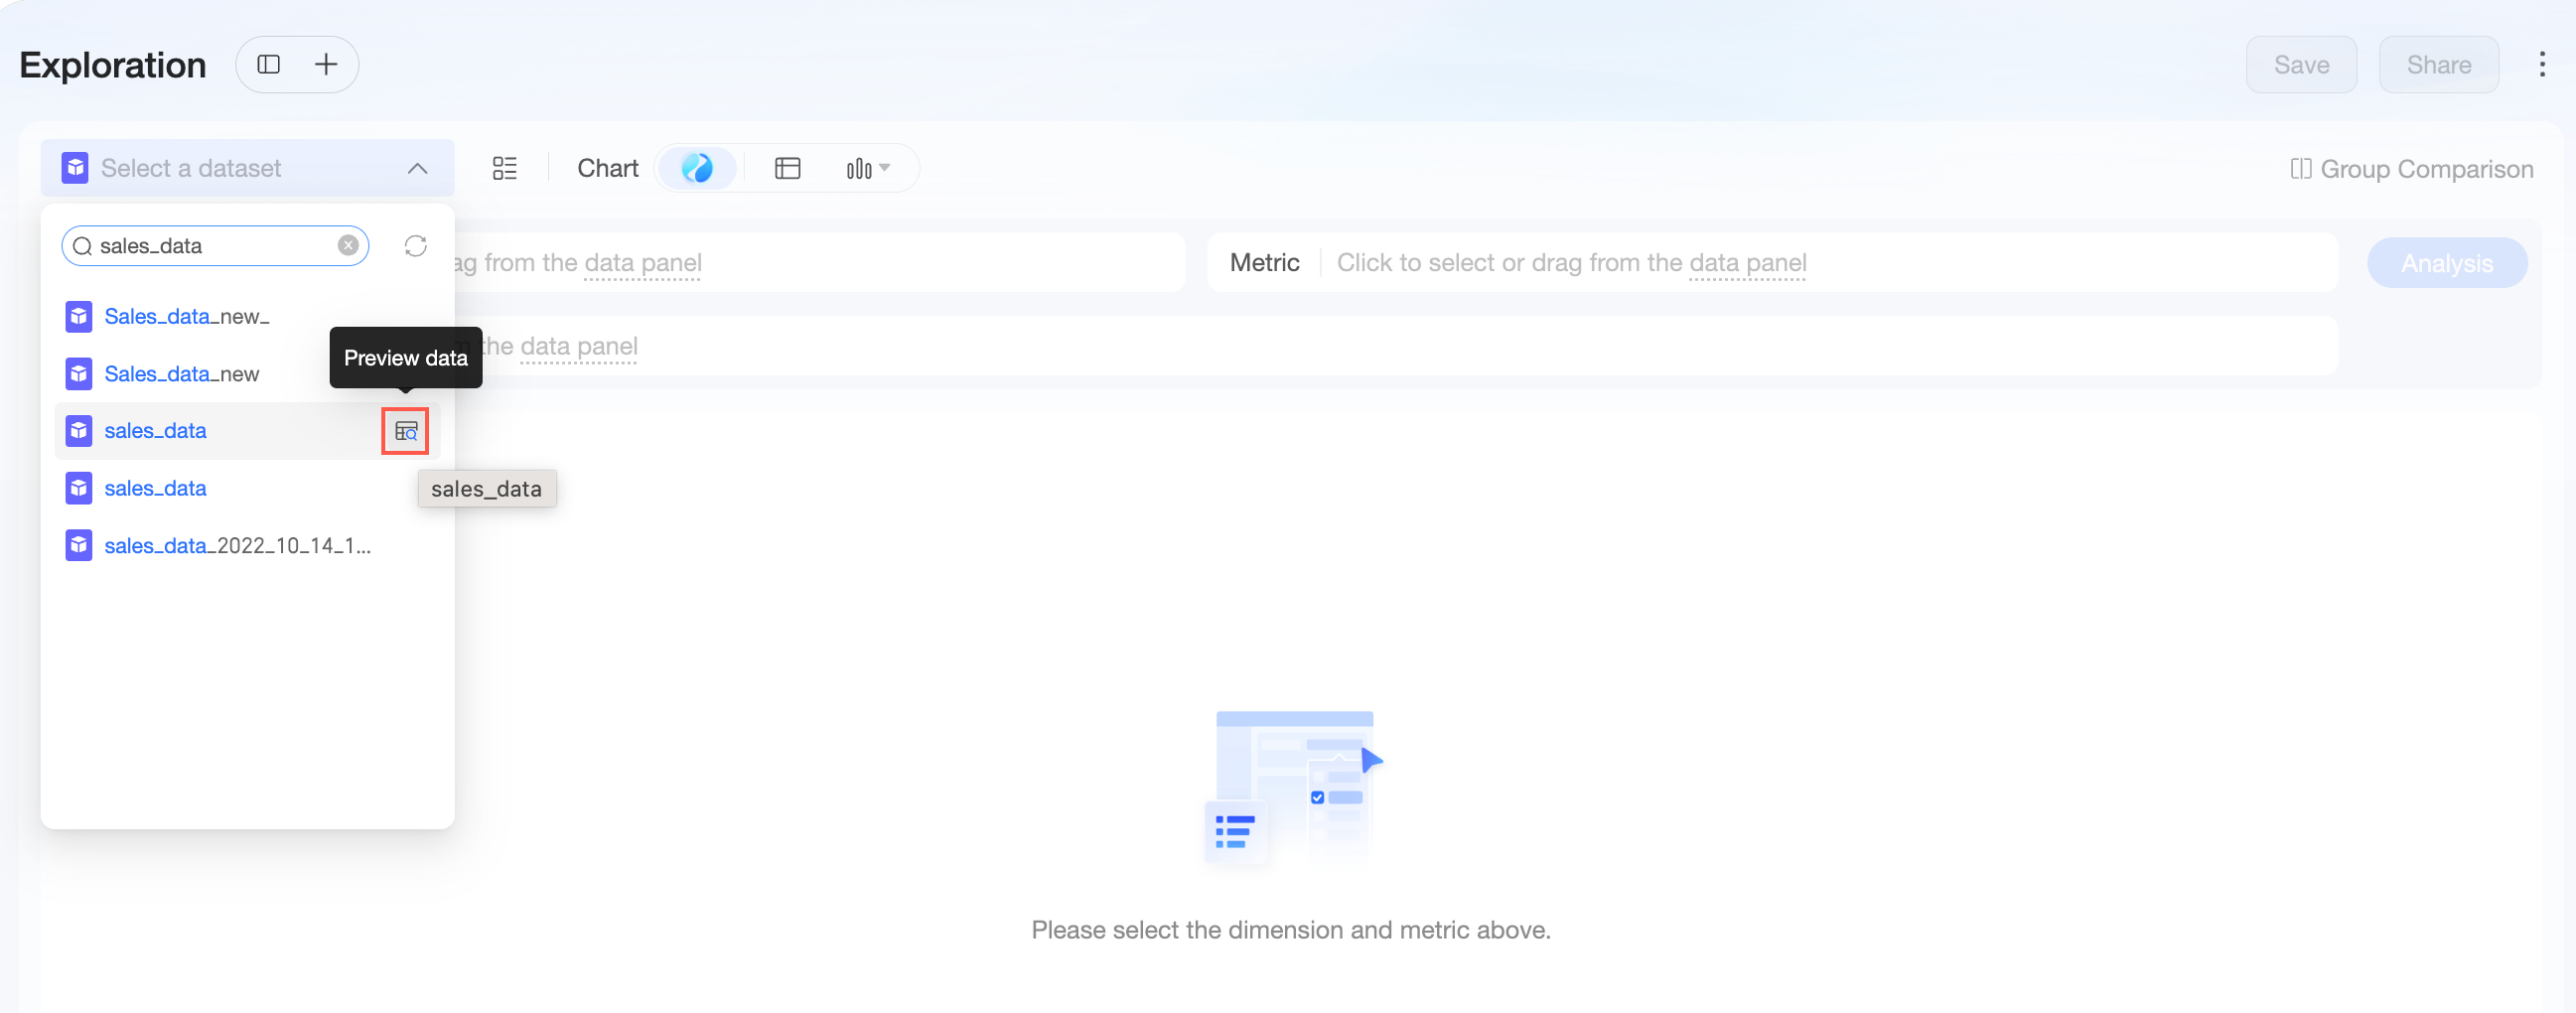
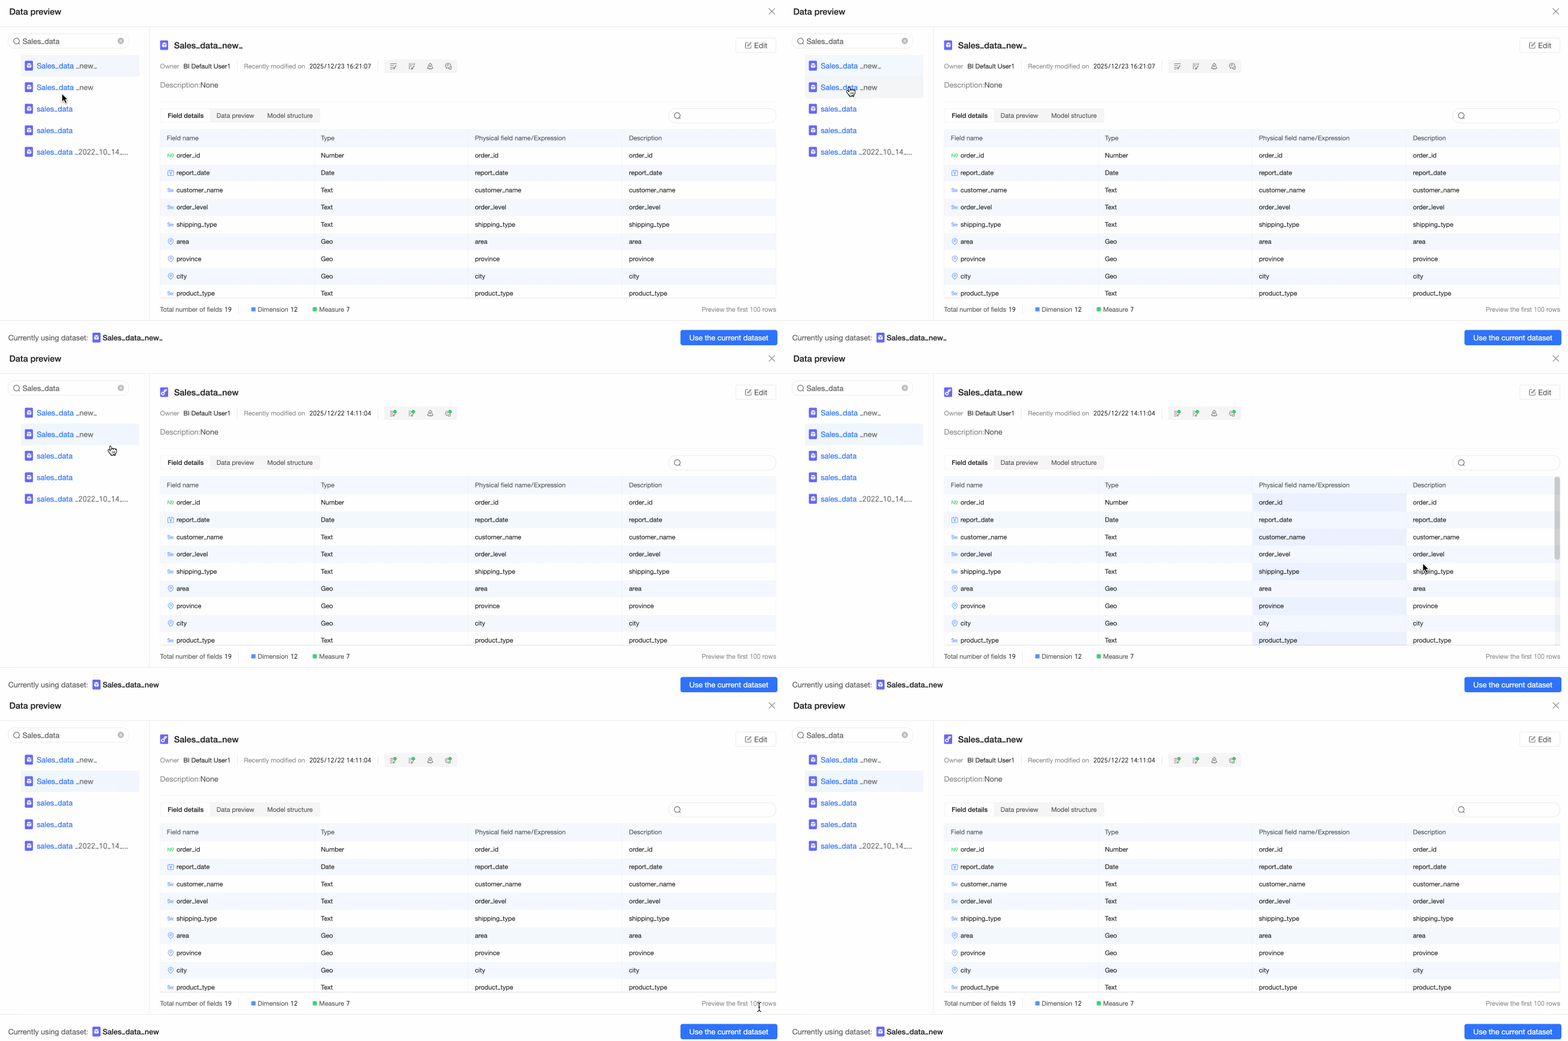
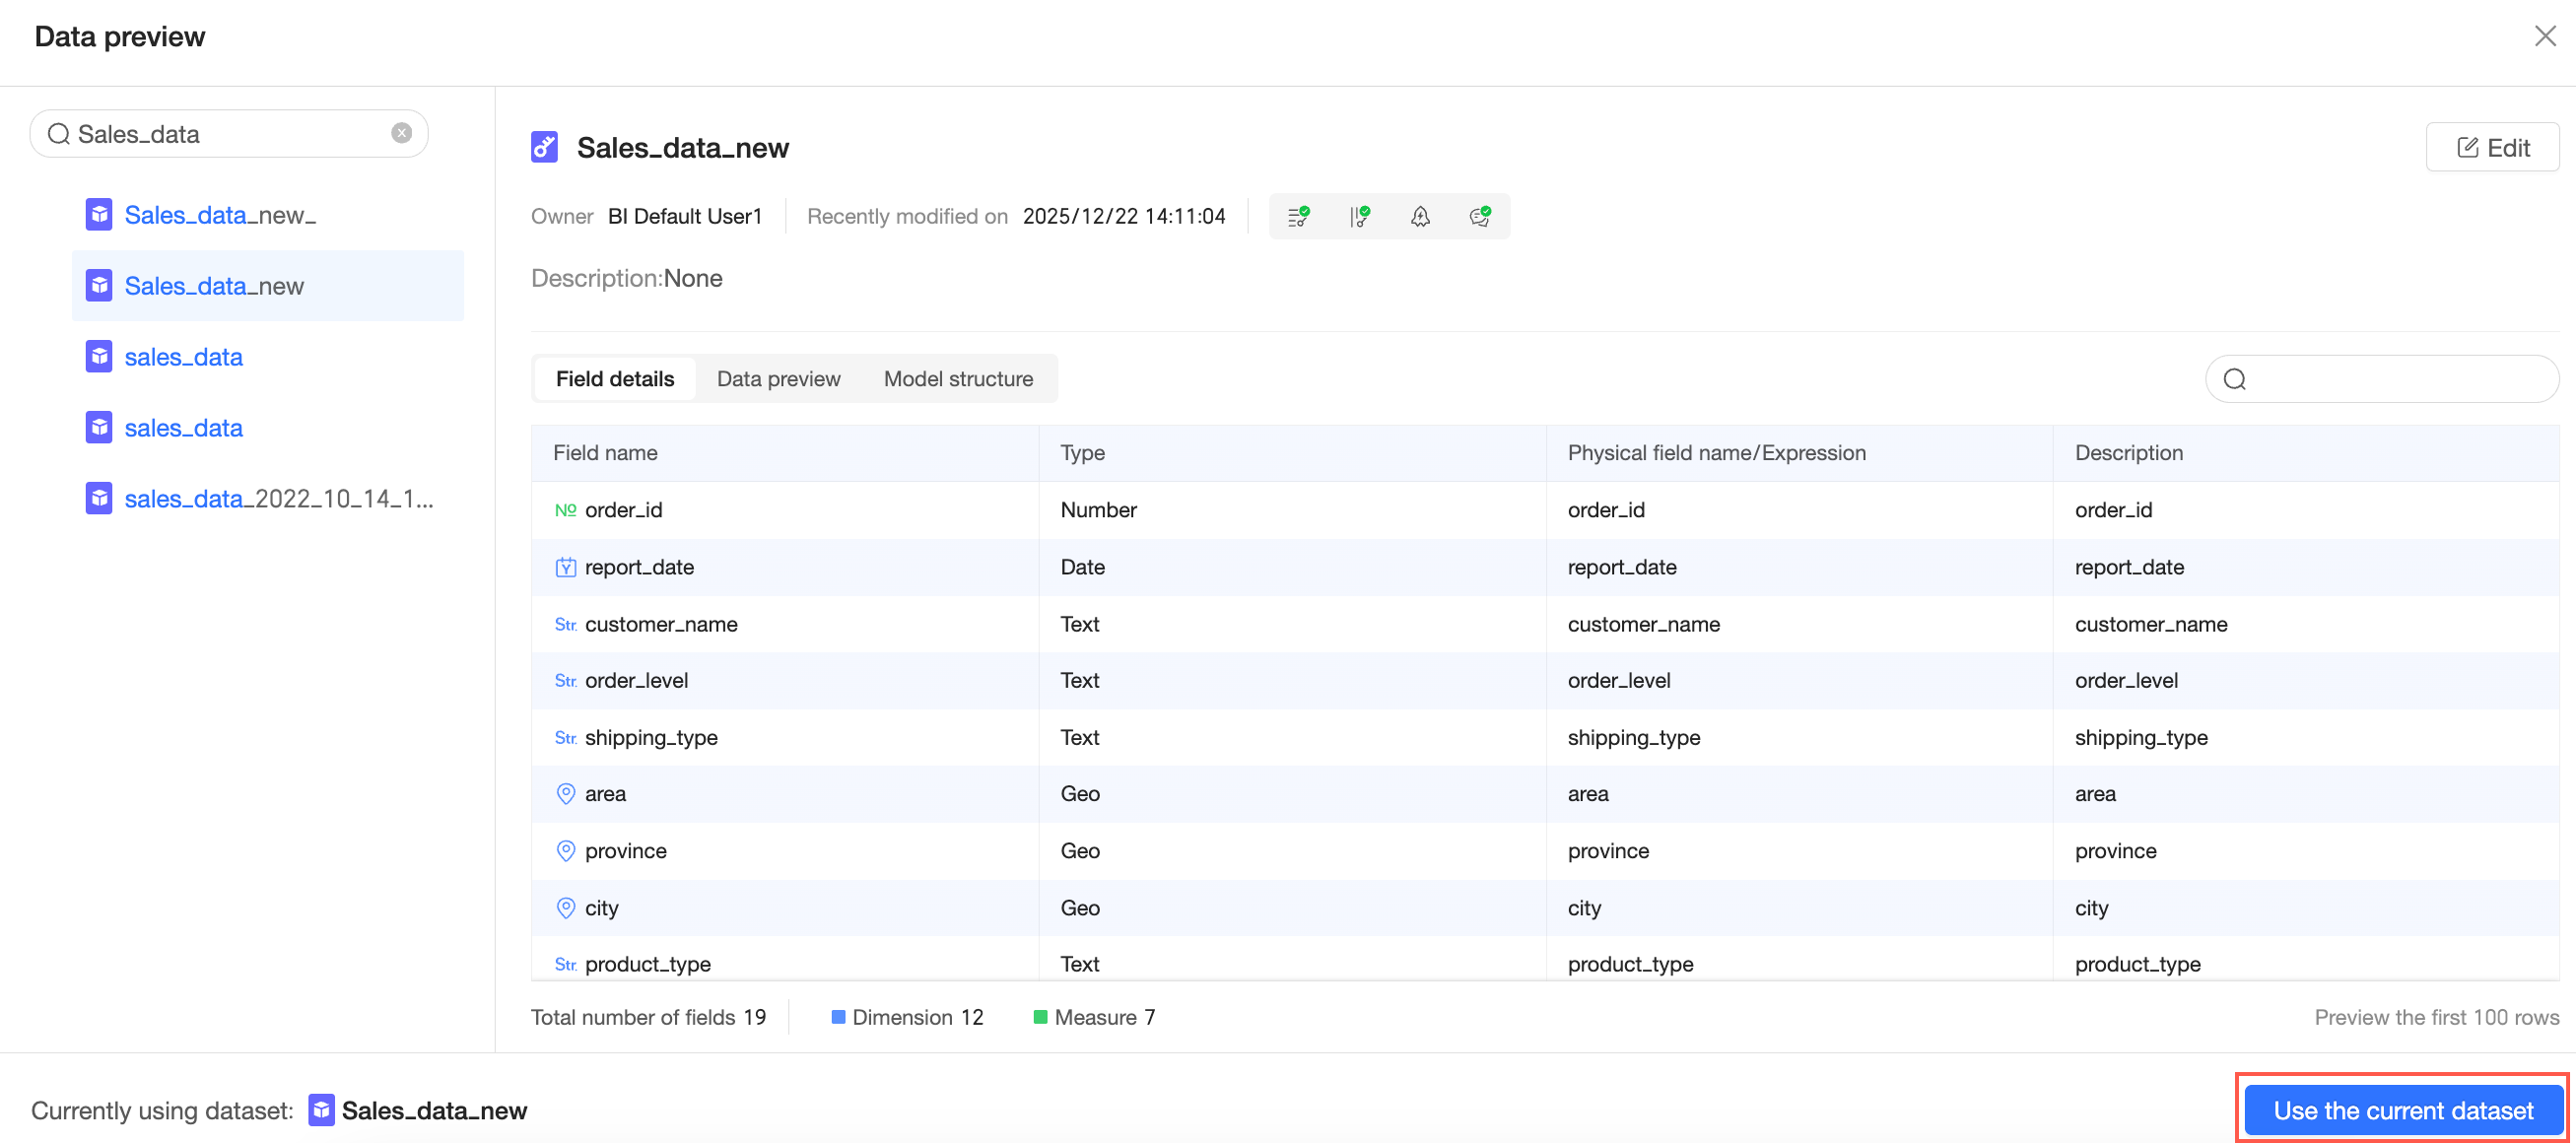
The data preview window shows the dataset's field details, a preview of its data, and its model structure.
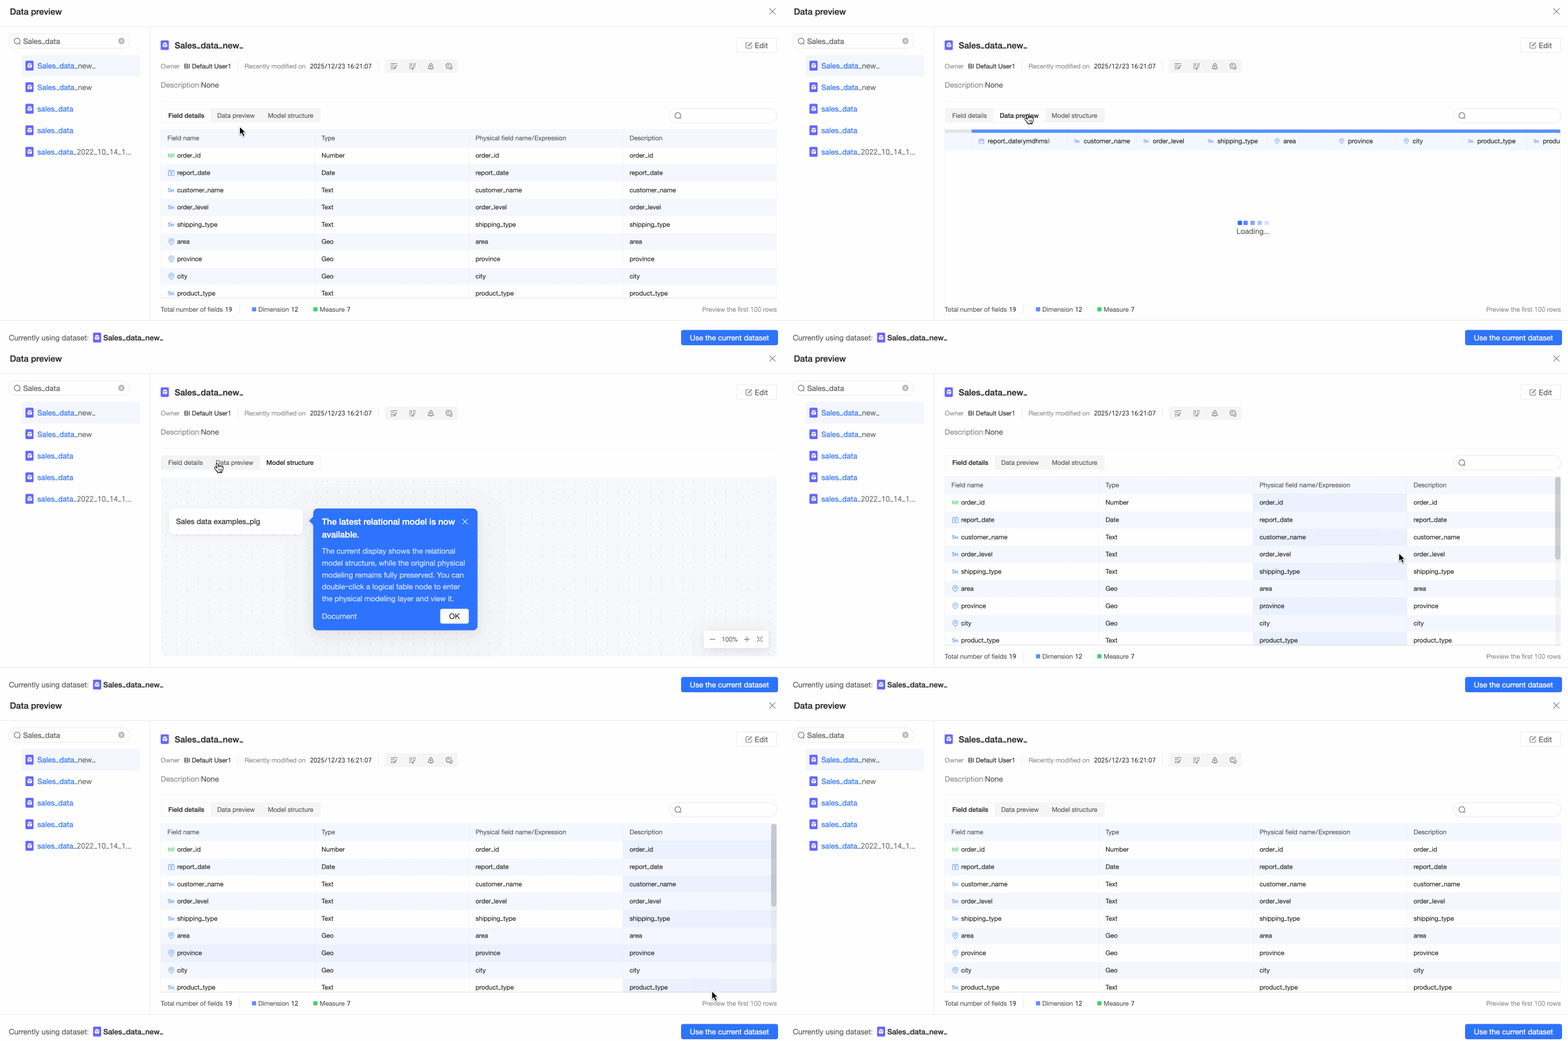
You can switch to other datasets to preview their data.
Click Use this dataset in the lower-right corner of the window to select the current dataset for your Exploration.

-
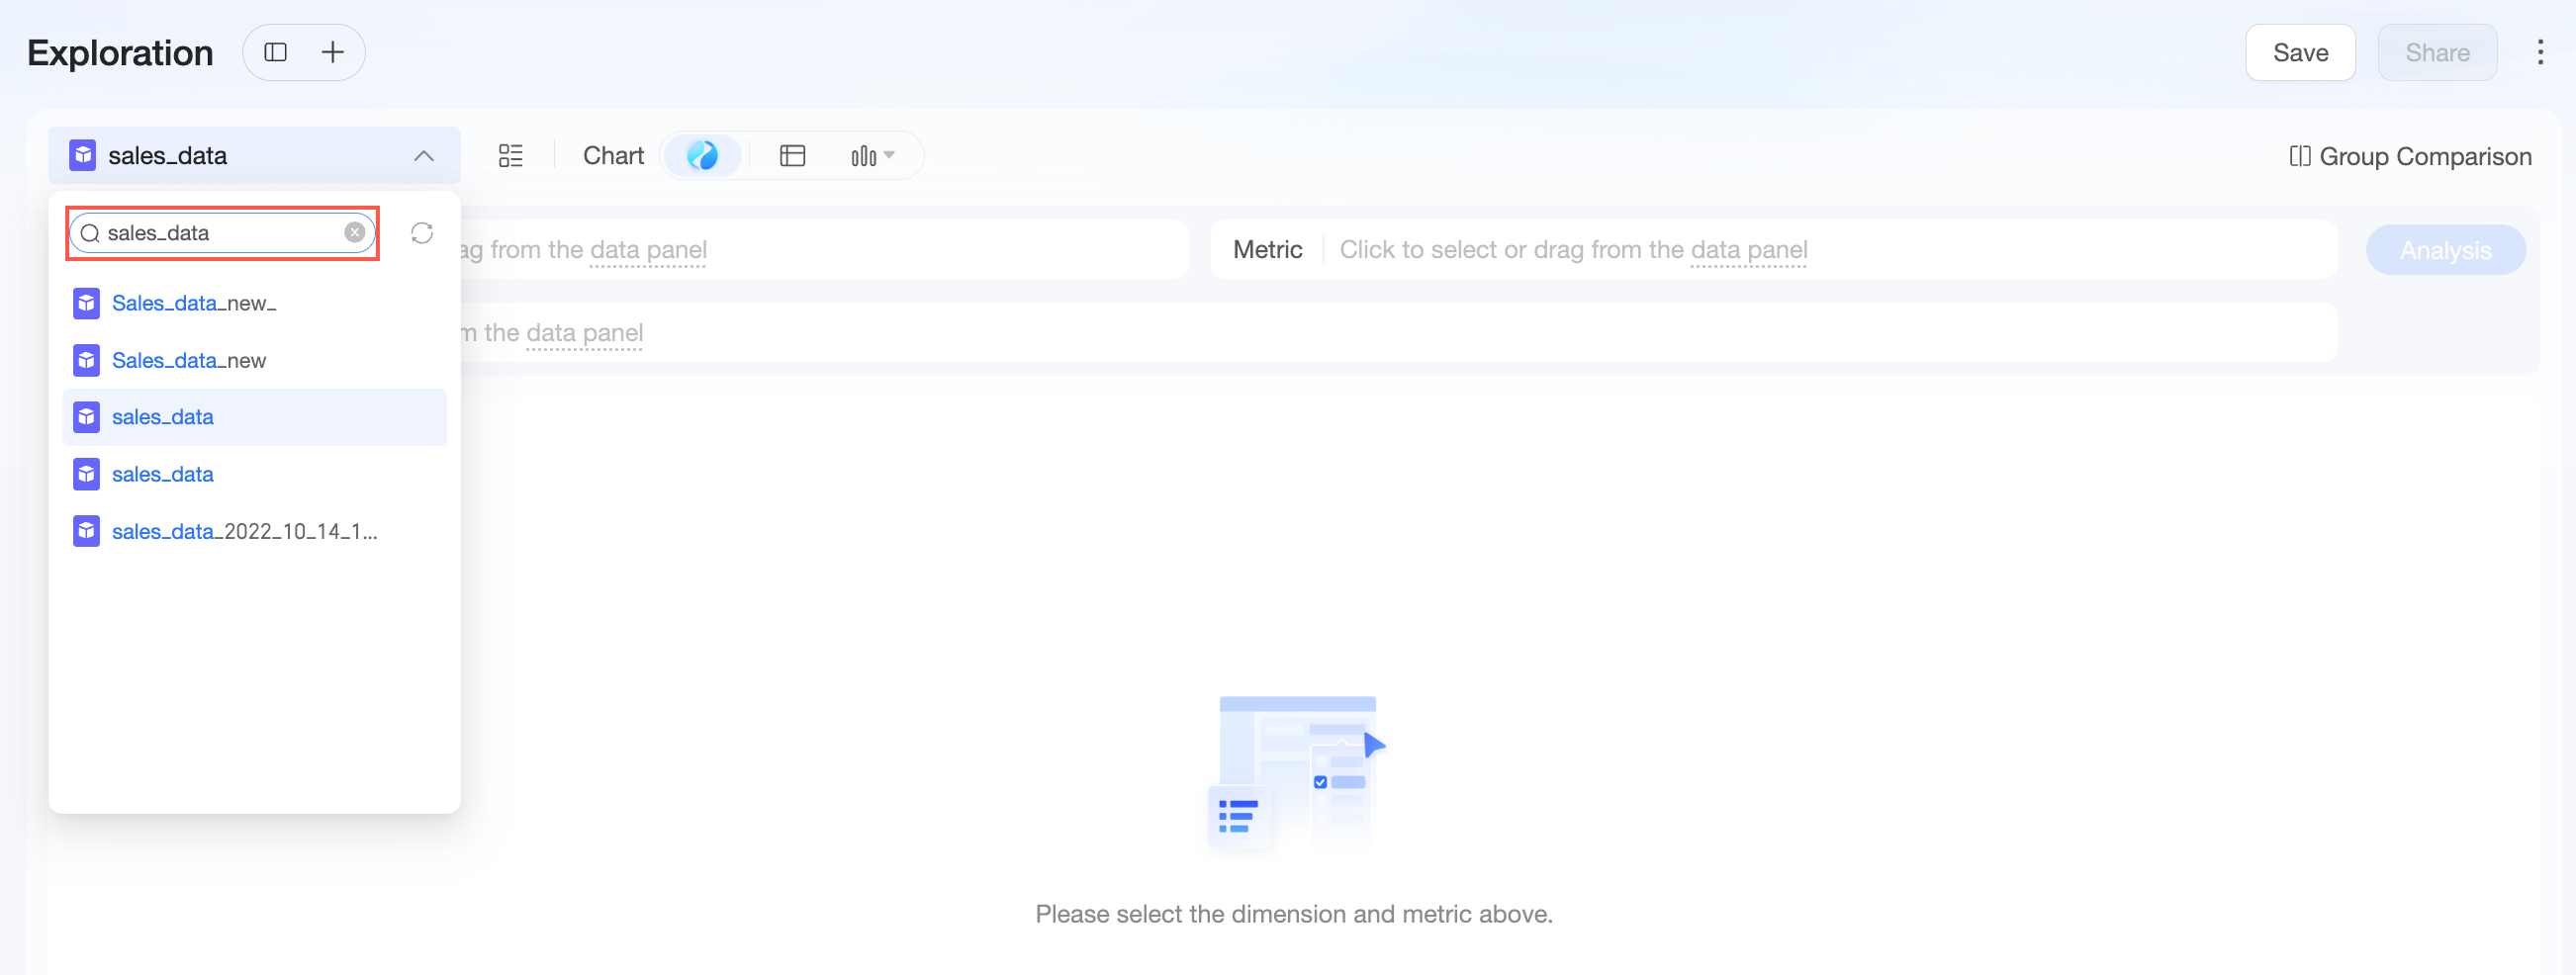
You can search for datasets.
-
Click the
icon to refresh the dataset list.
 icon to refresh the dataset list.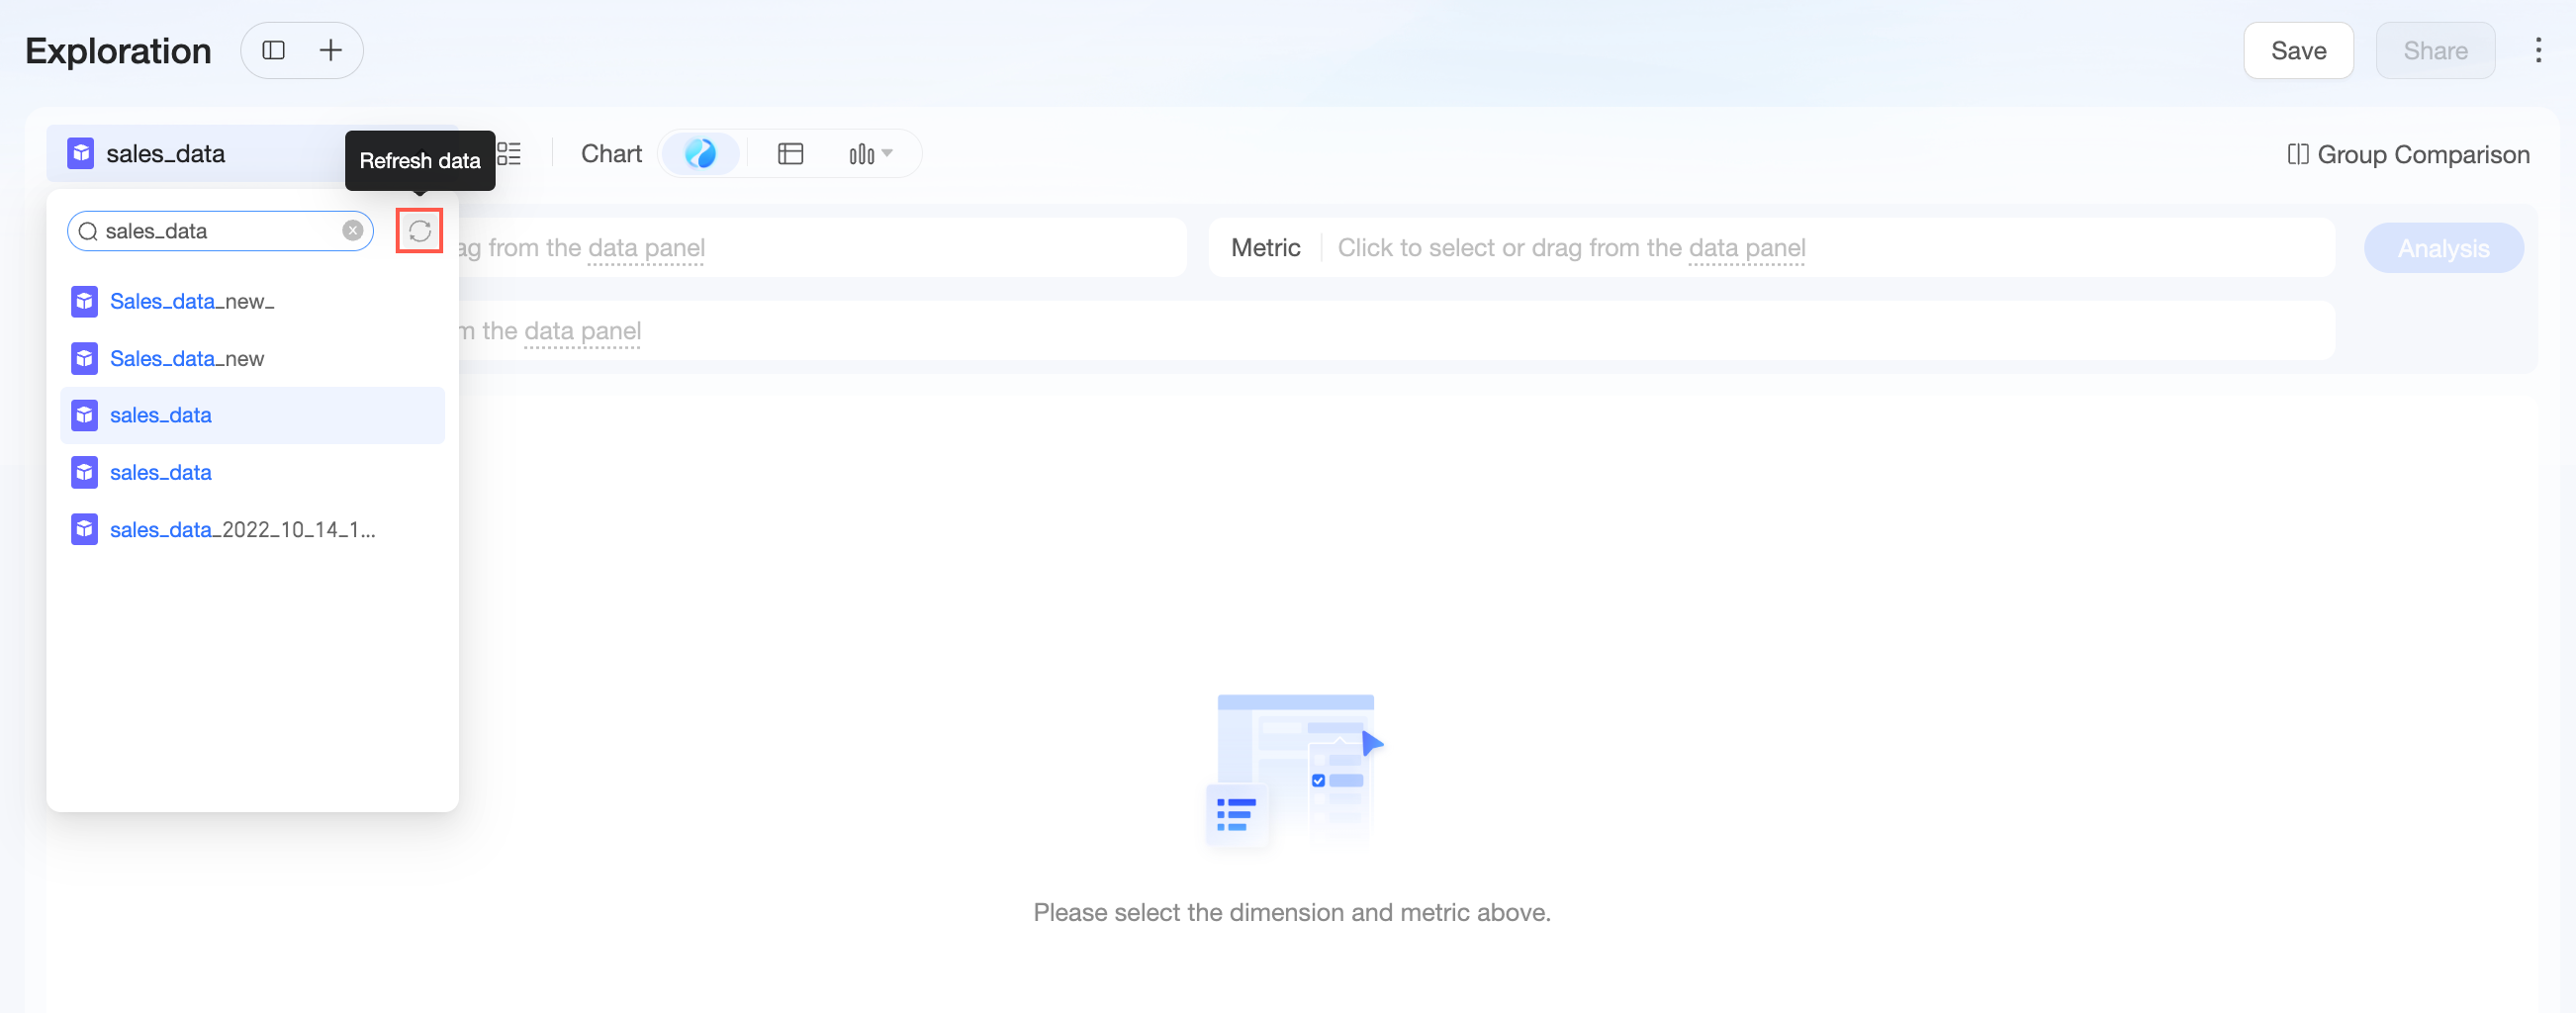
Visualization selection
Intelligent recommendation mode
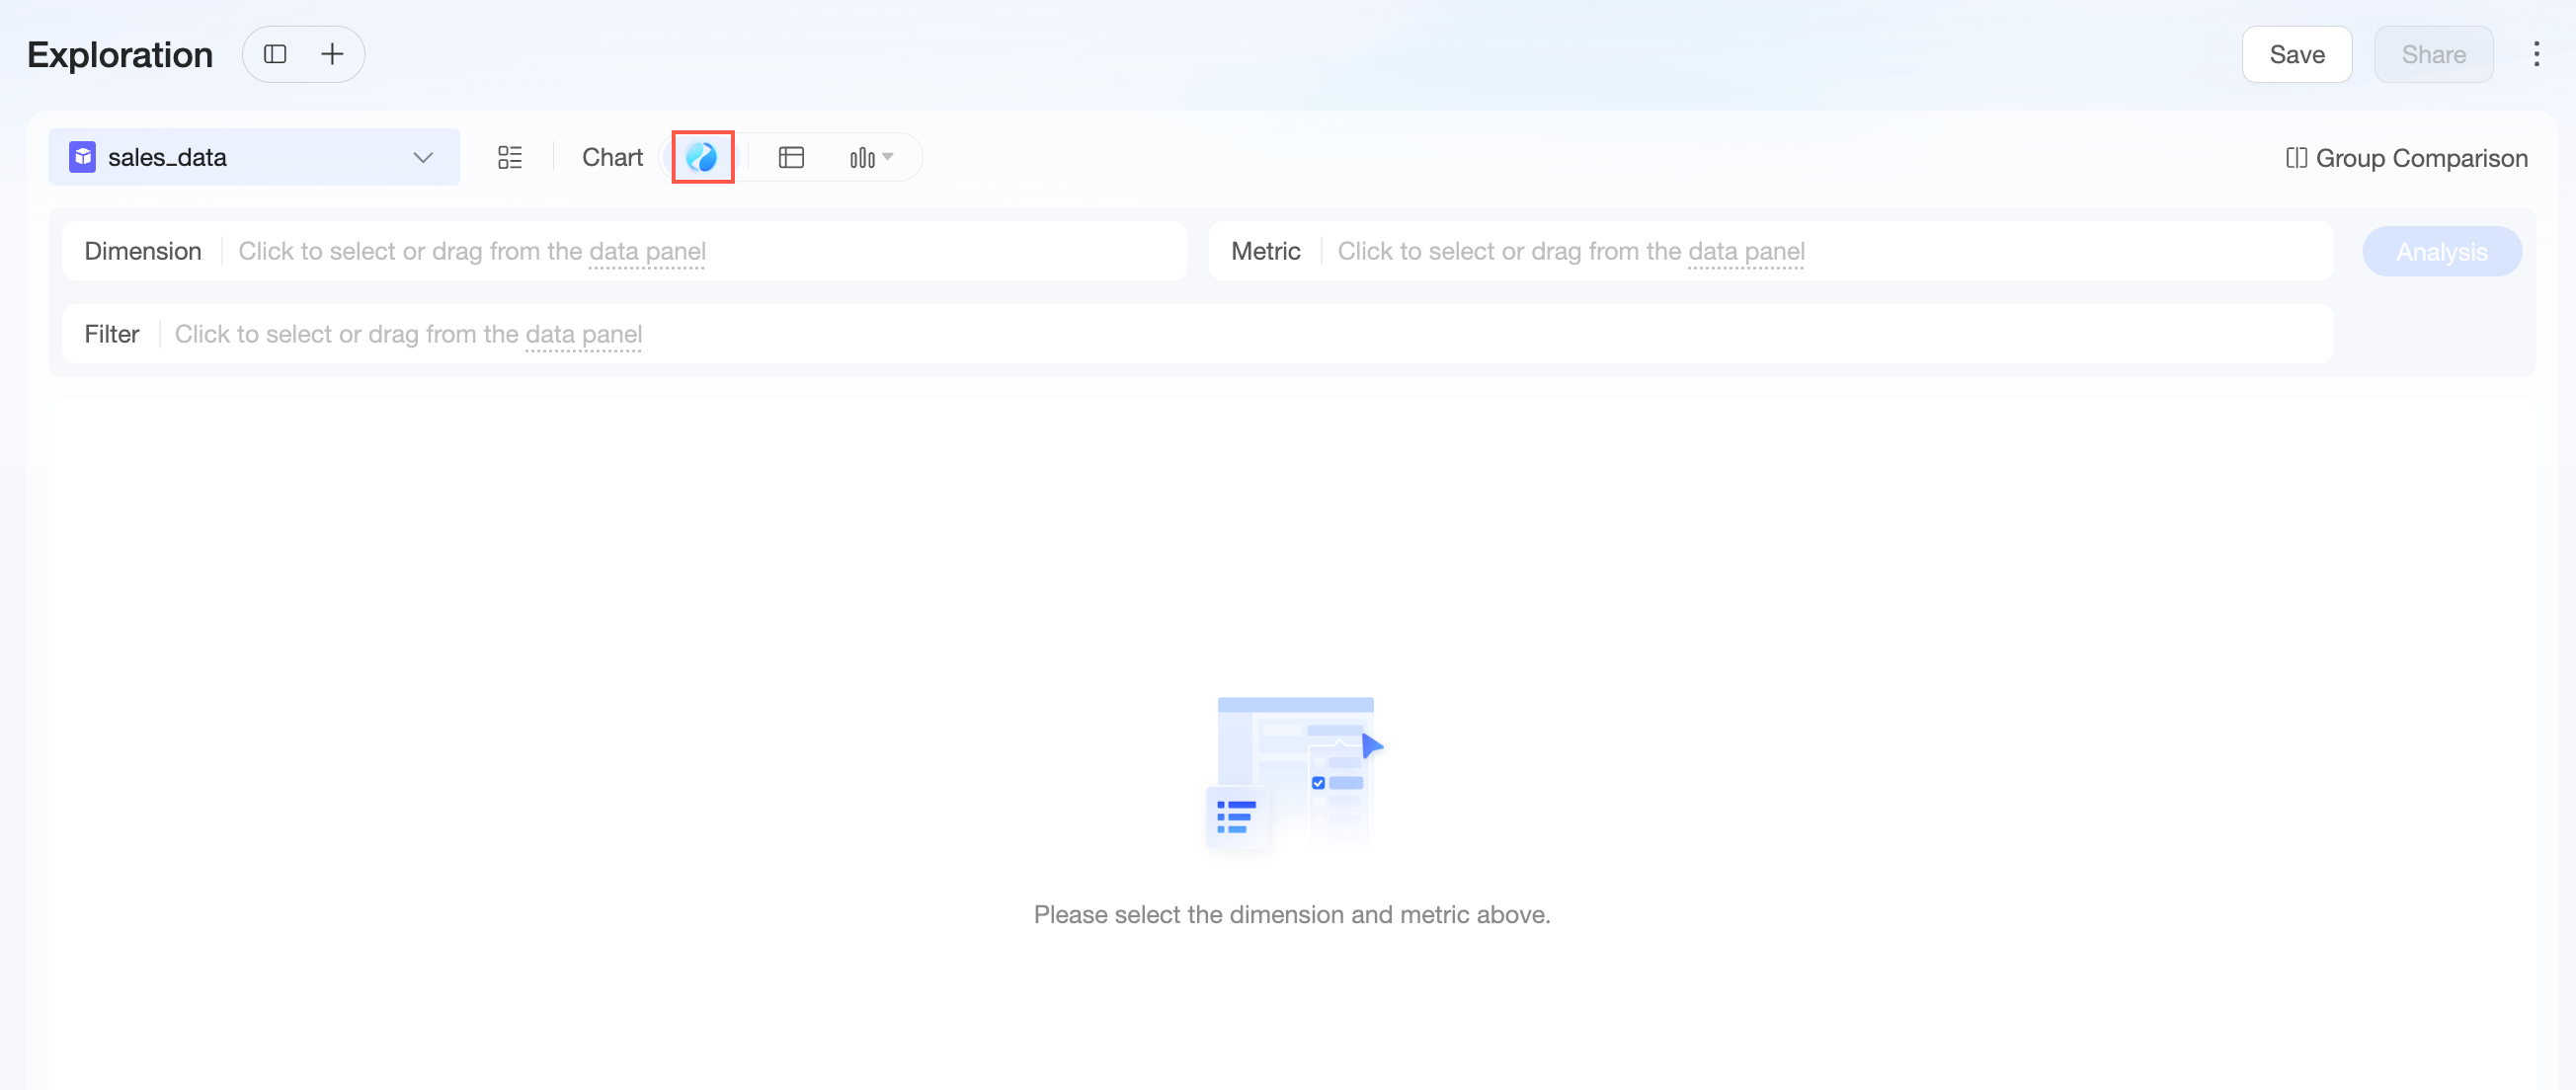
By default, charts use intelligent recommendation mode. The system recommends the optimal chart type based on the dimensions and measures you select. You can then switch to the recommended chart type for further configuration.
Specific chart mode
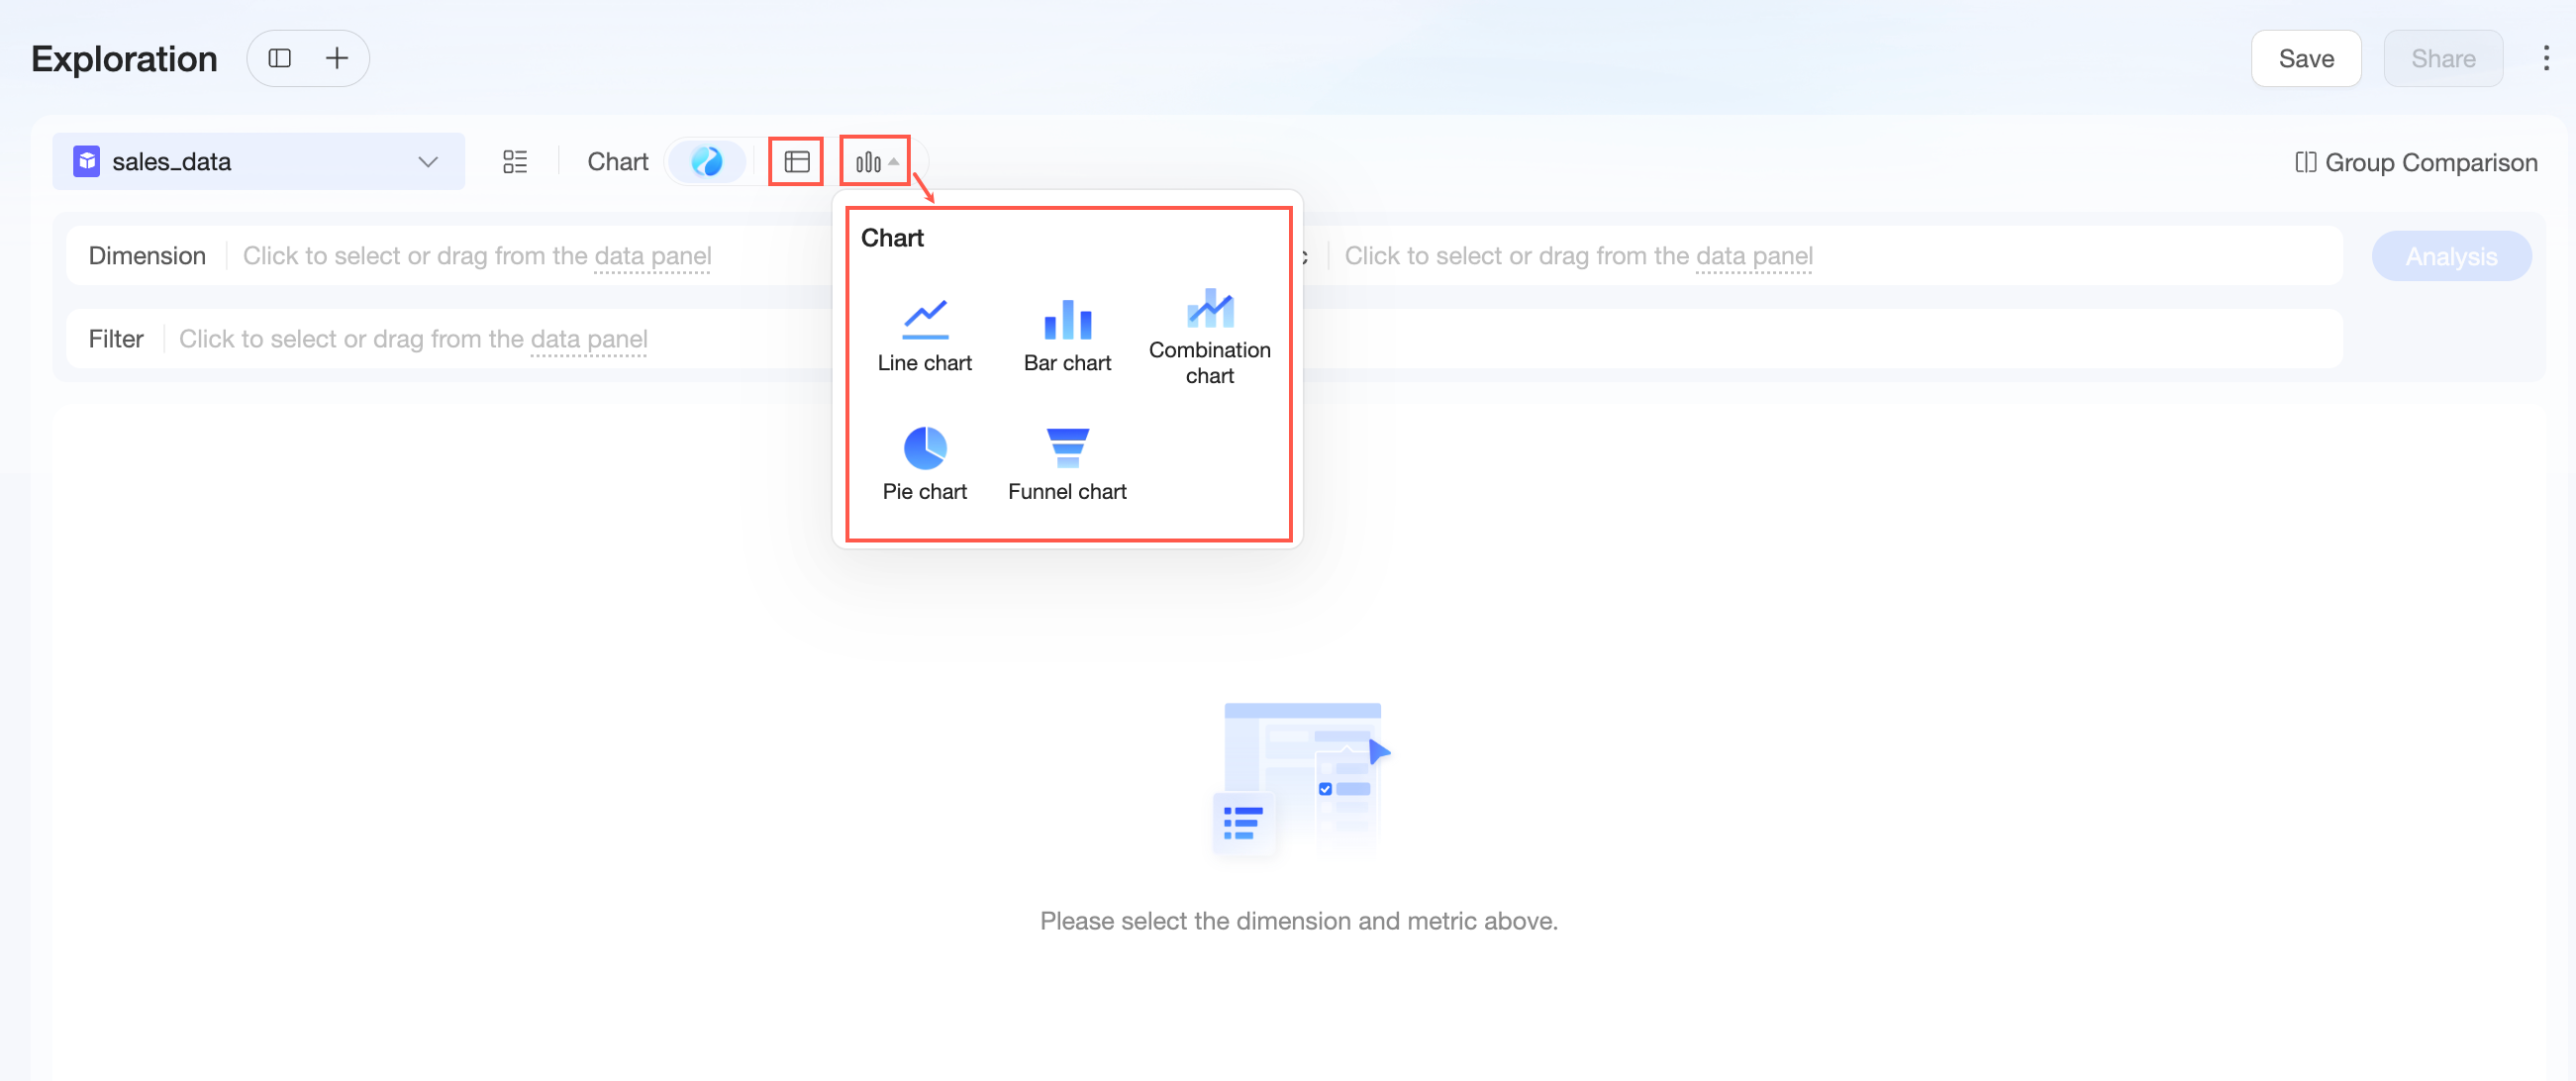
The following chart types are supported: table, line chart, bar chart, pie chart, combo chart, and funnel chart.
-
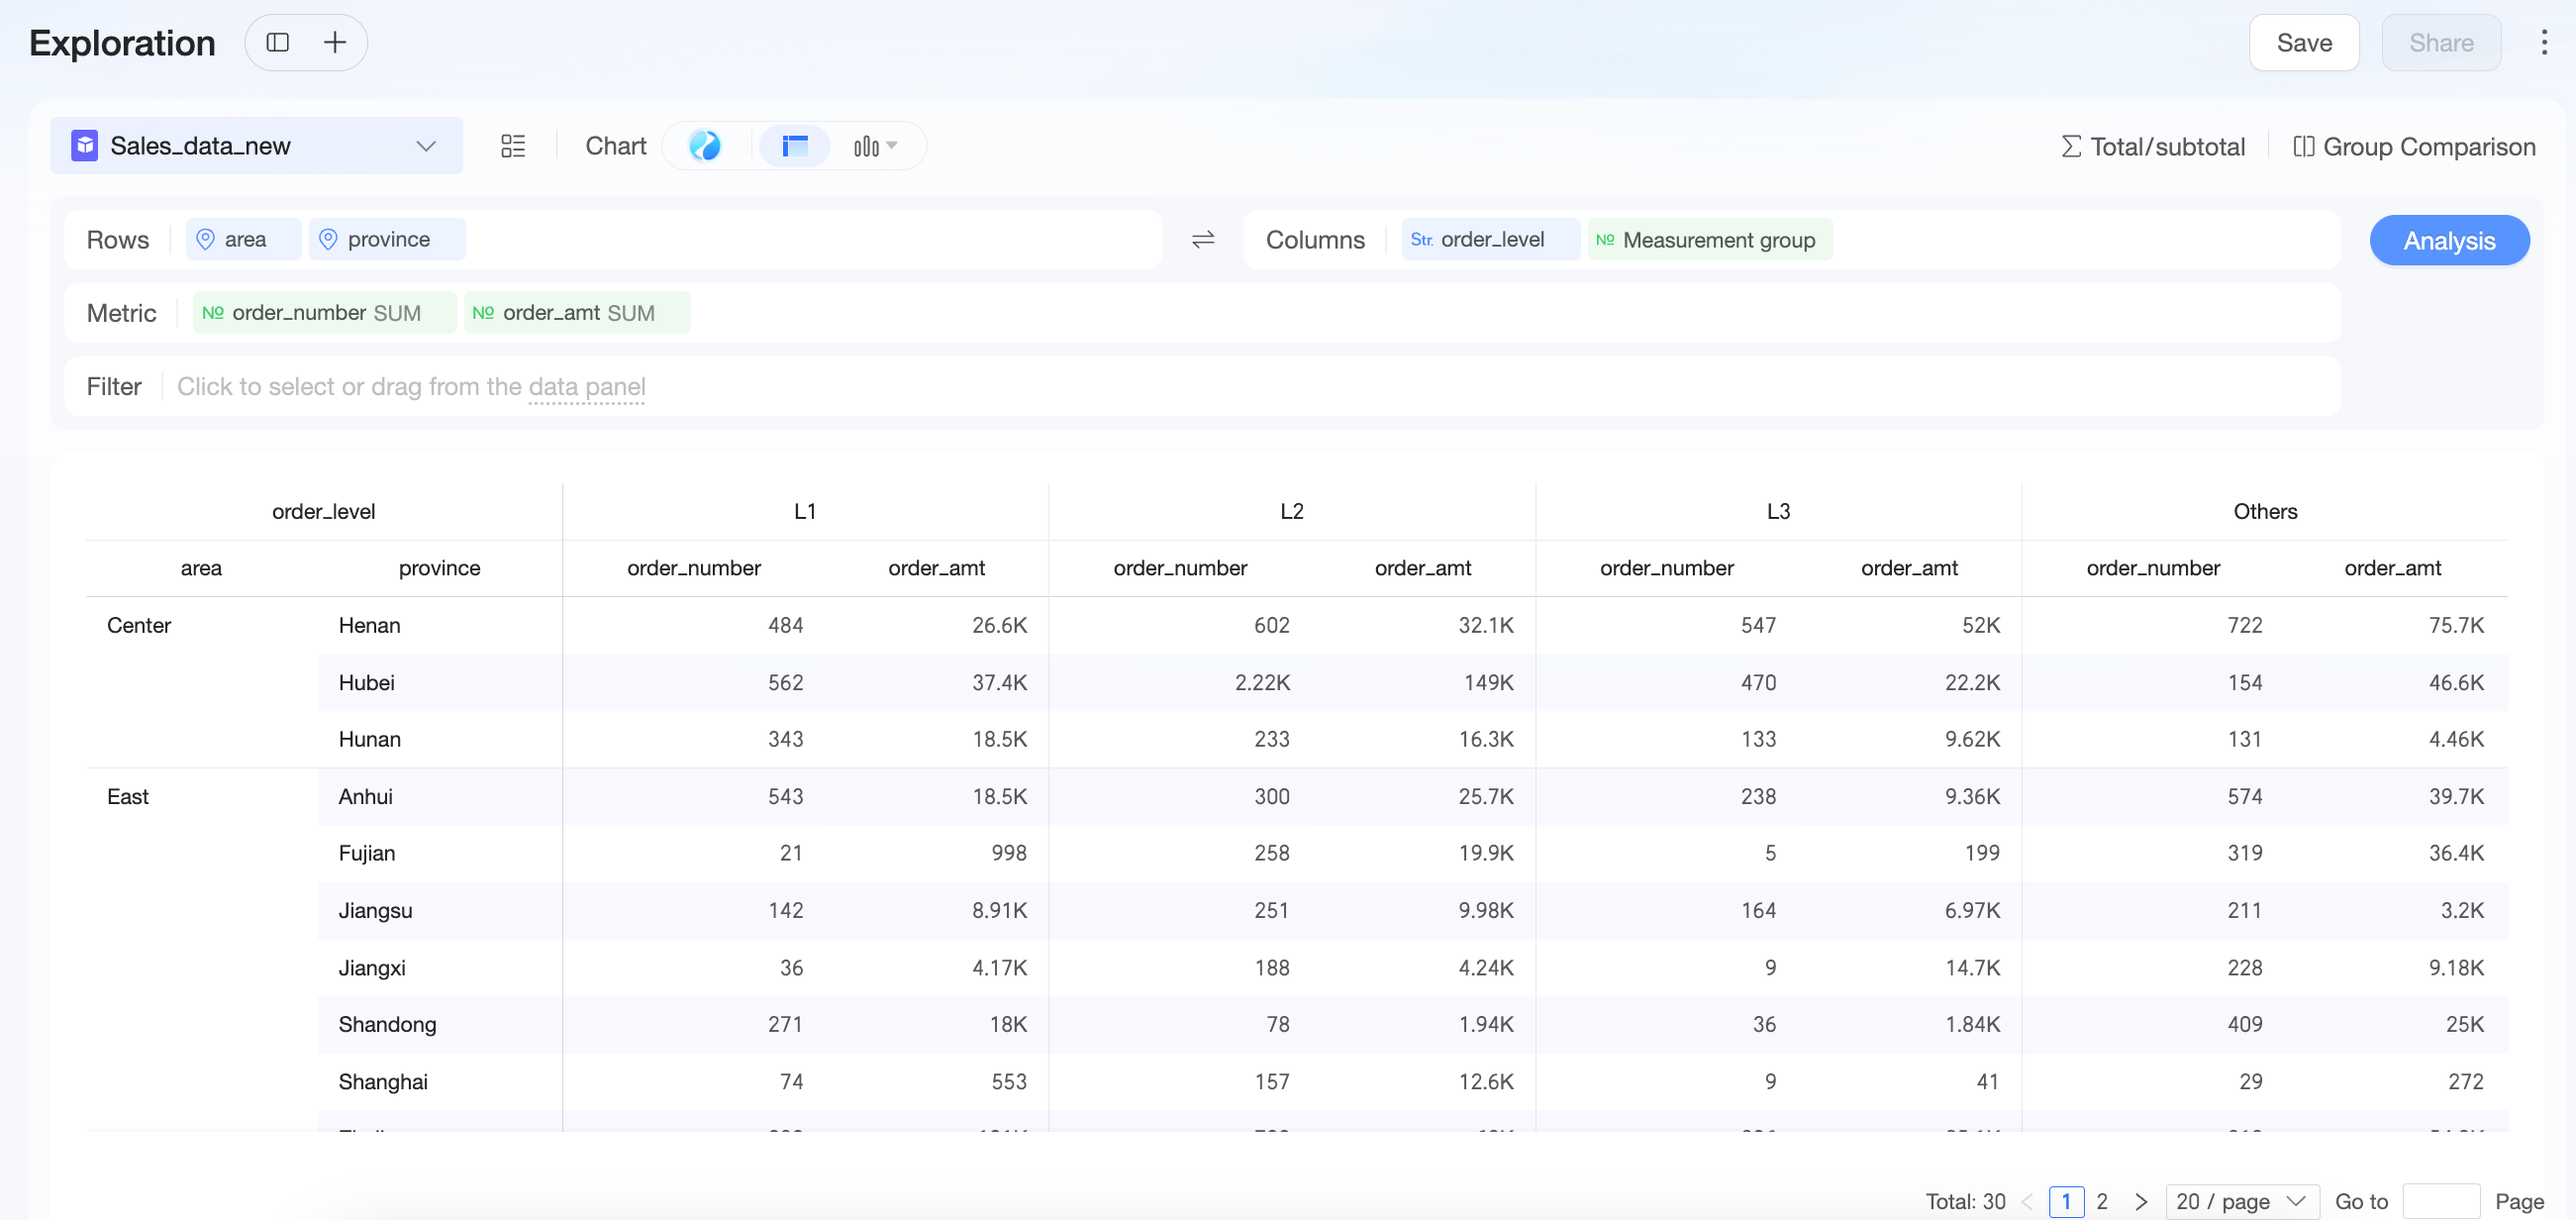
A table requires you to configure rows, columns, measures, and filters. For column fields, you can configure sorting and hide columns. Marquee selection is also supported.
-
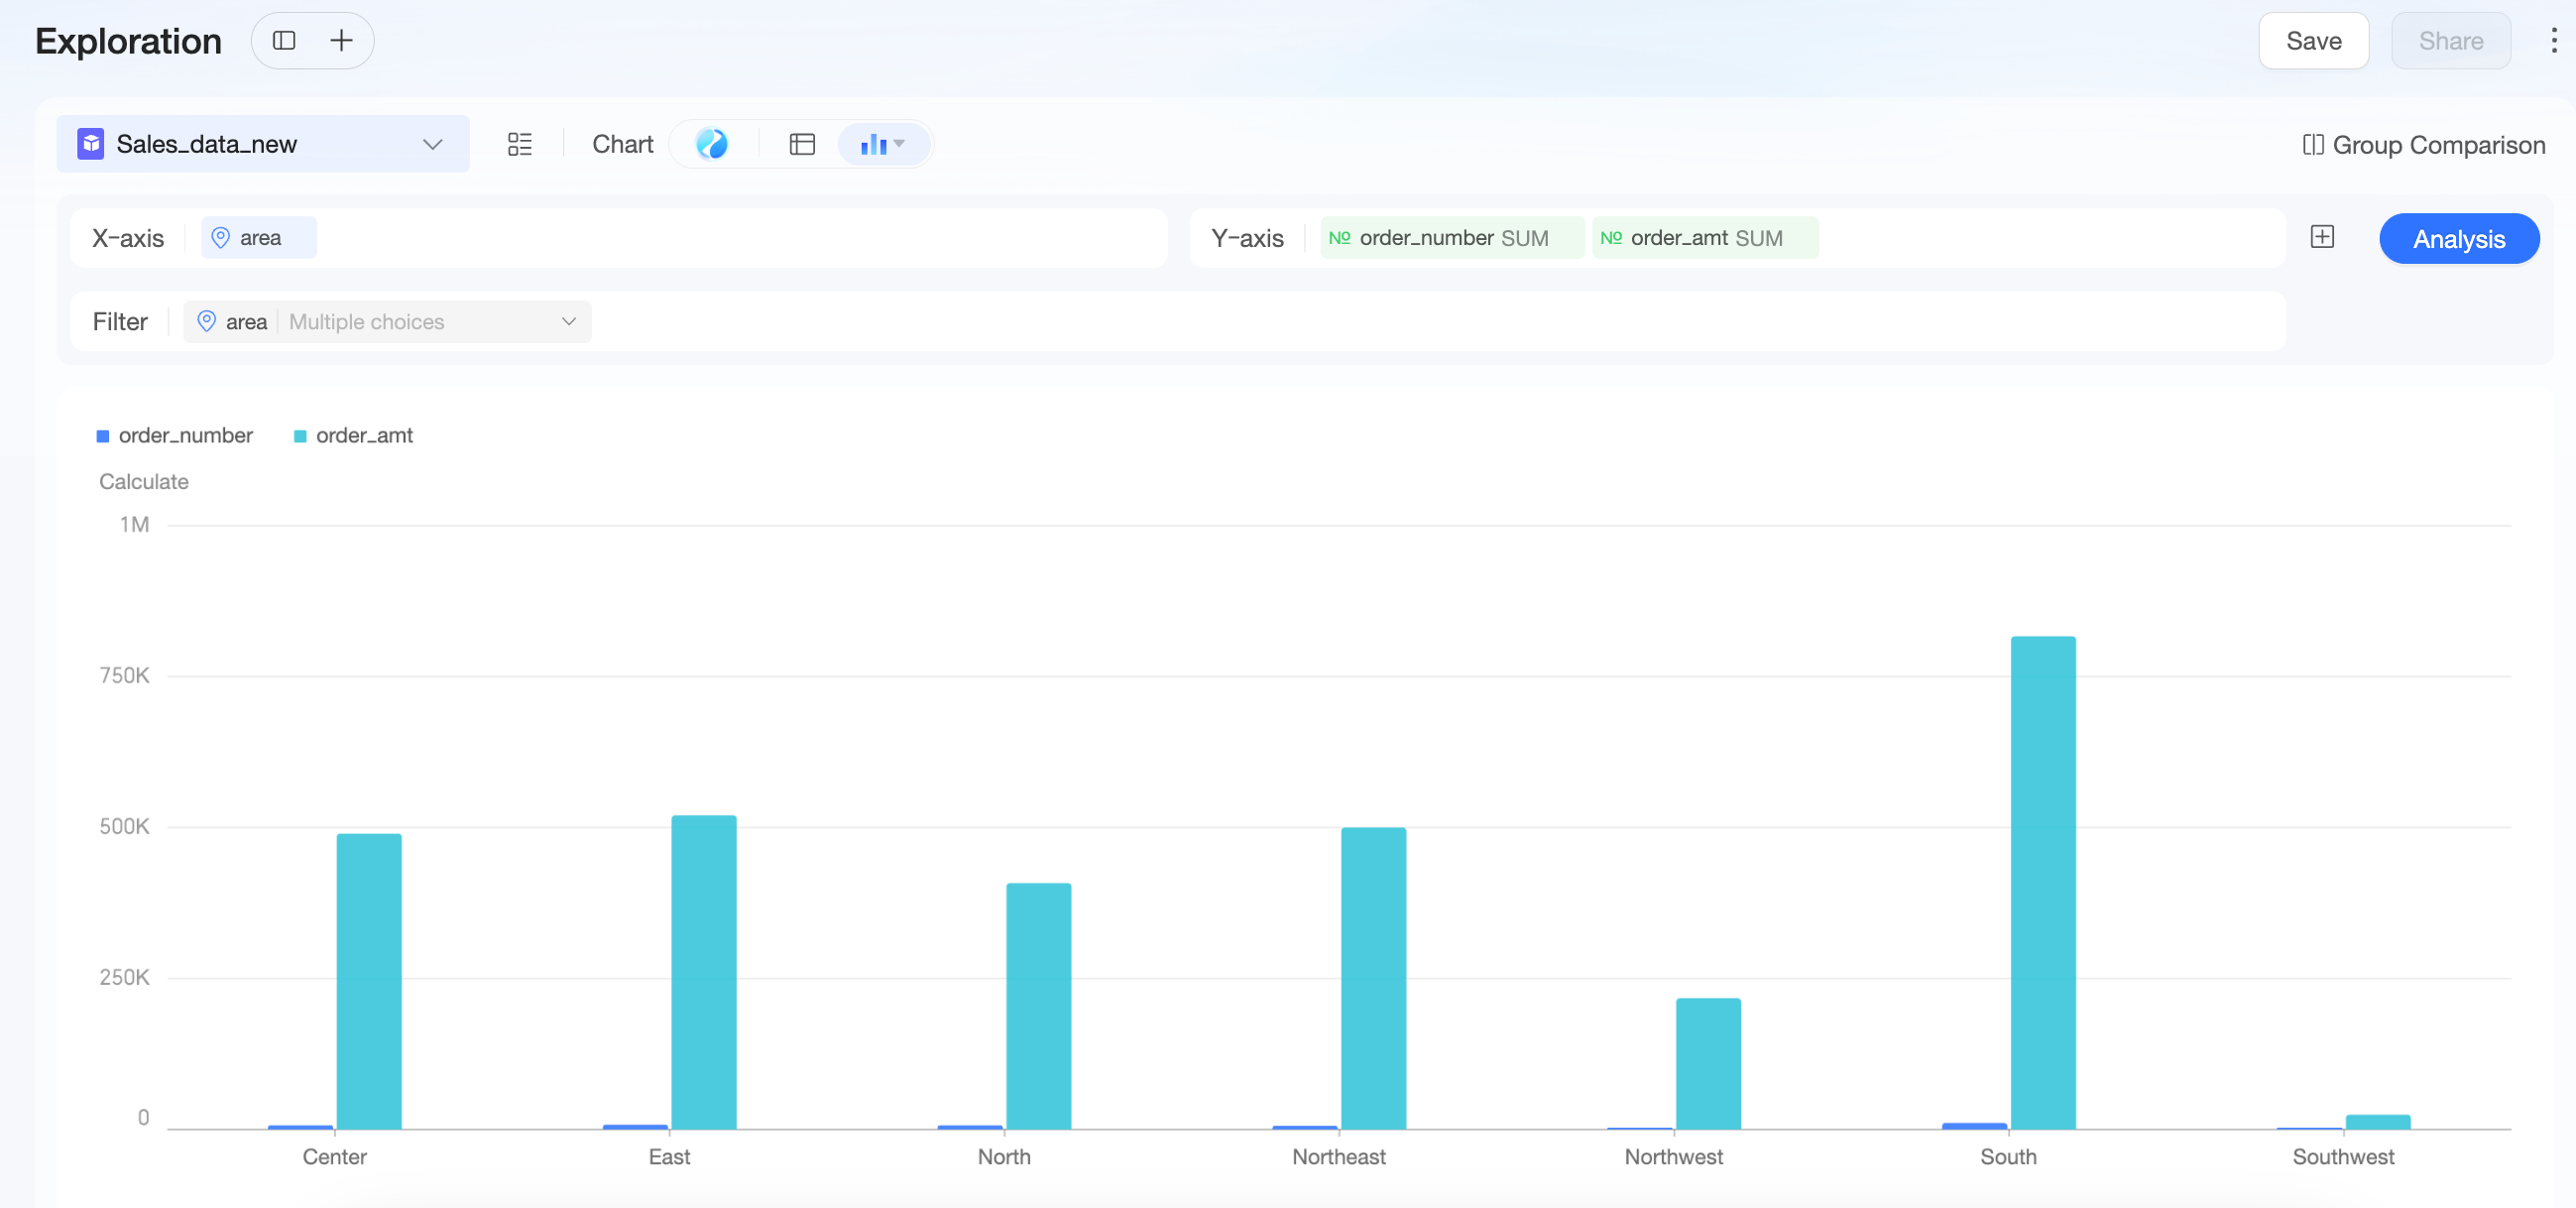
A line or bar chart requires you to configure the X-axis, Y-axis, and filters.
Click the
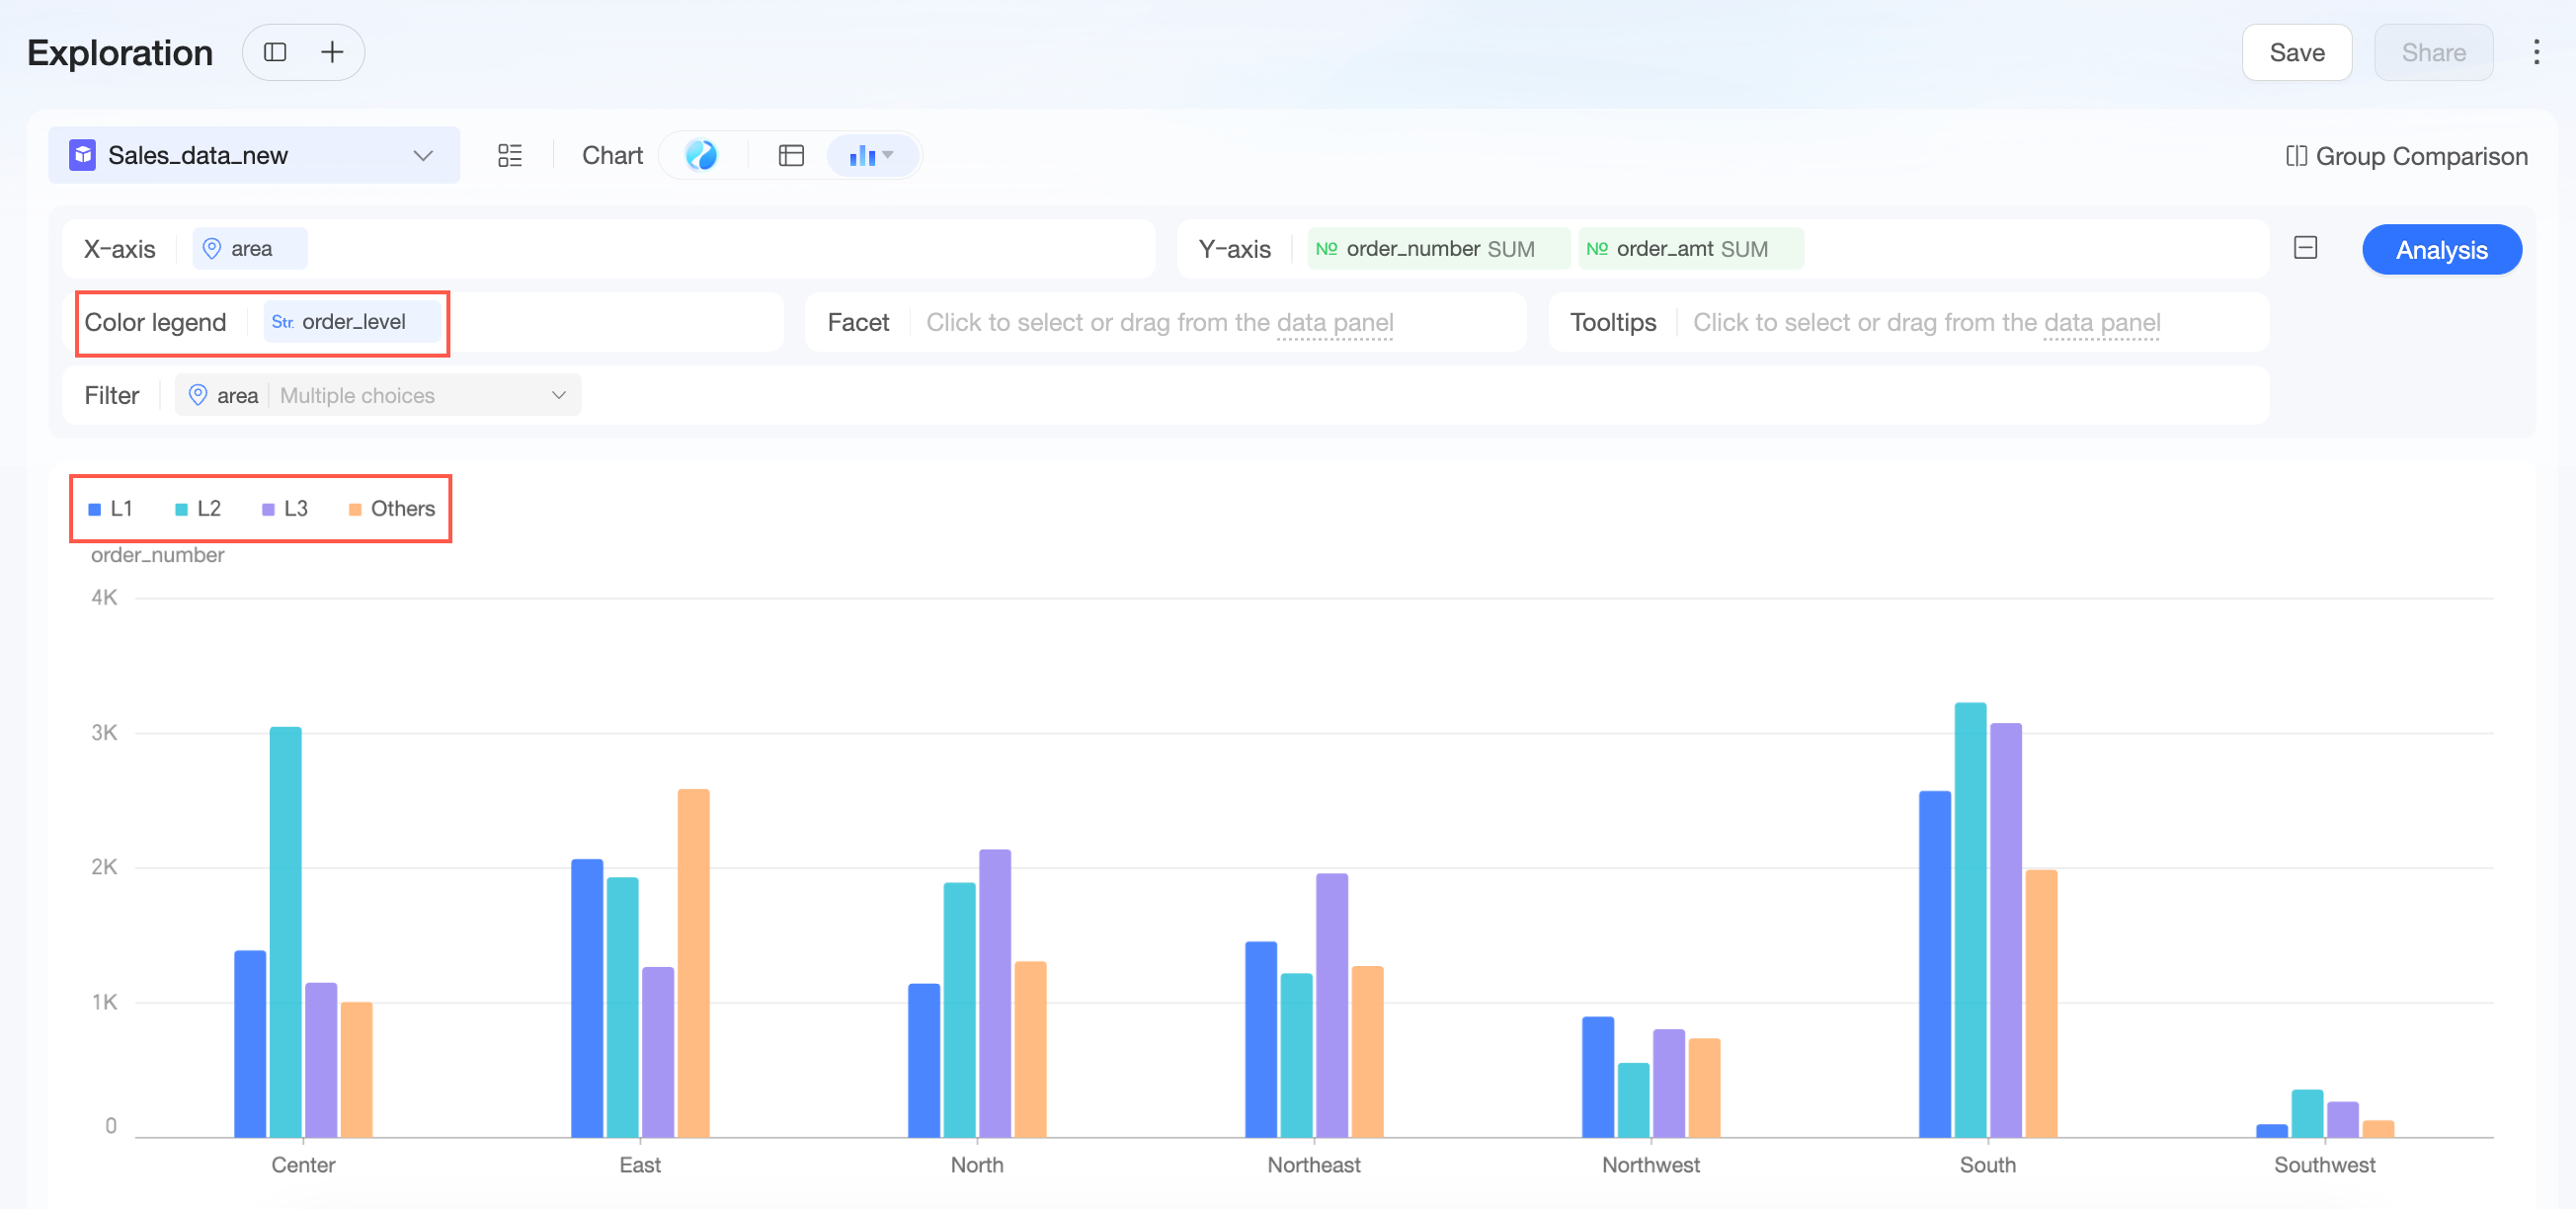
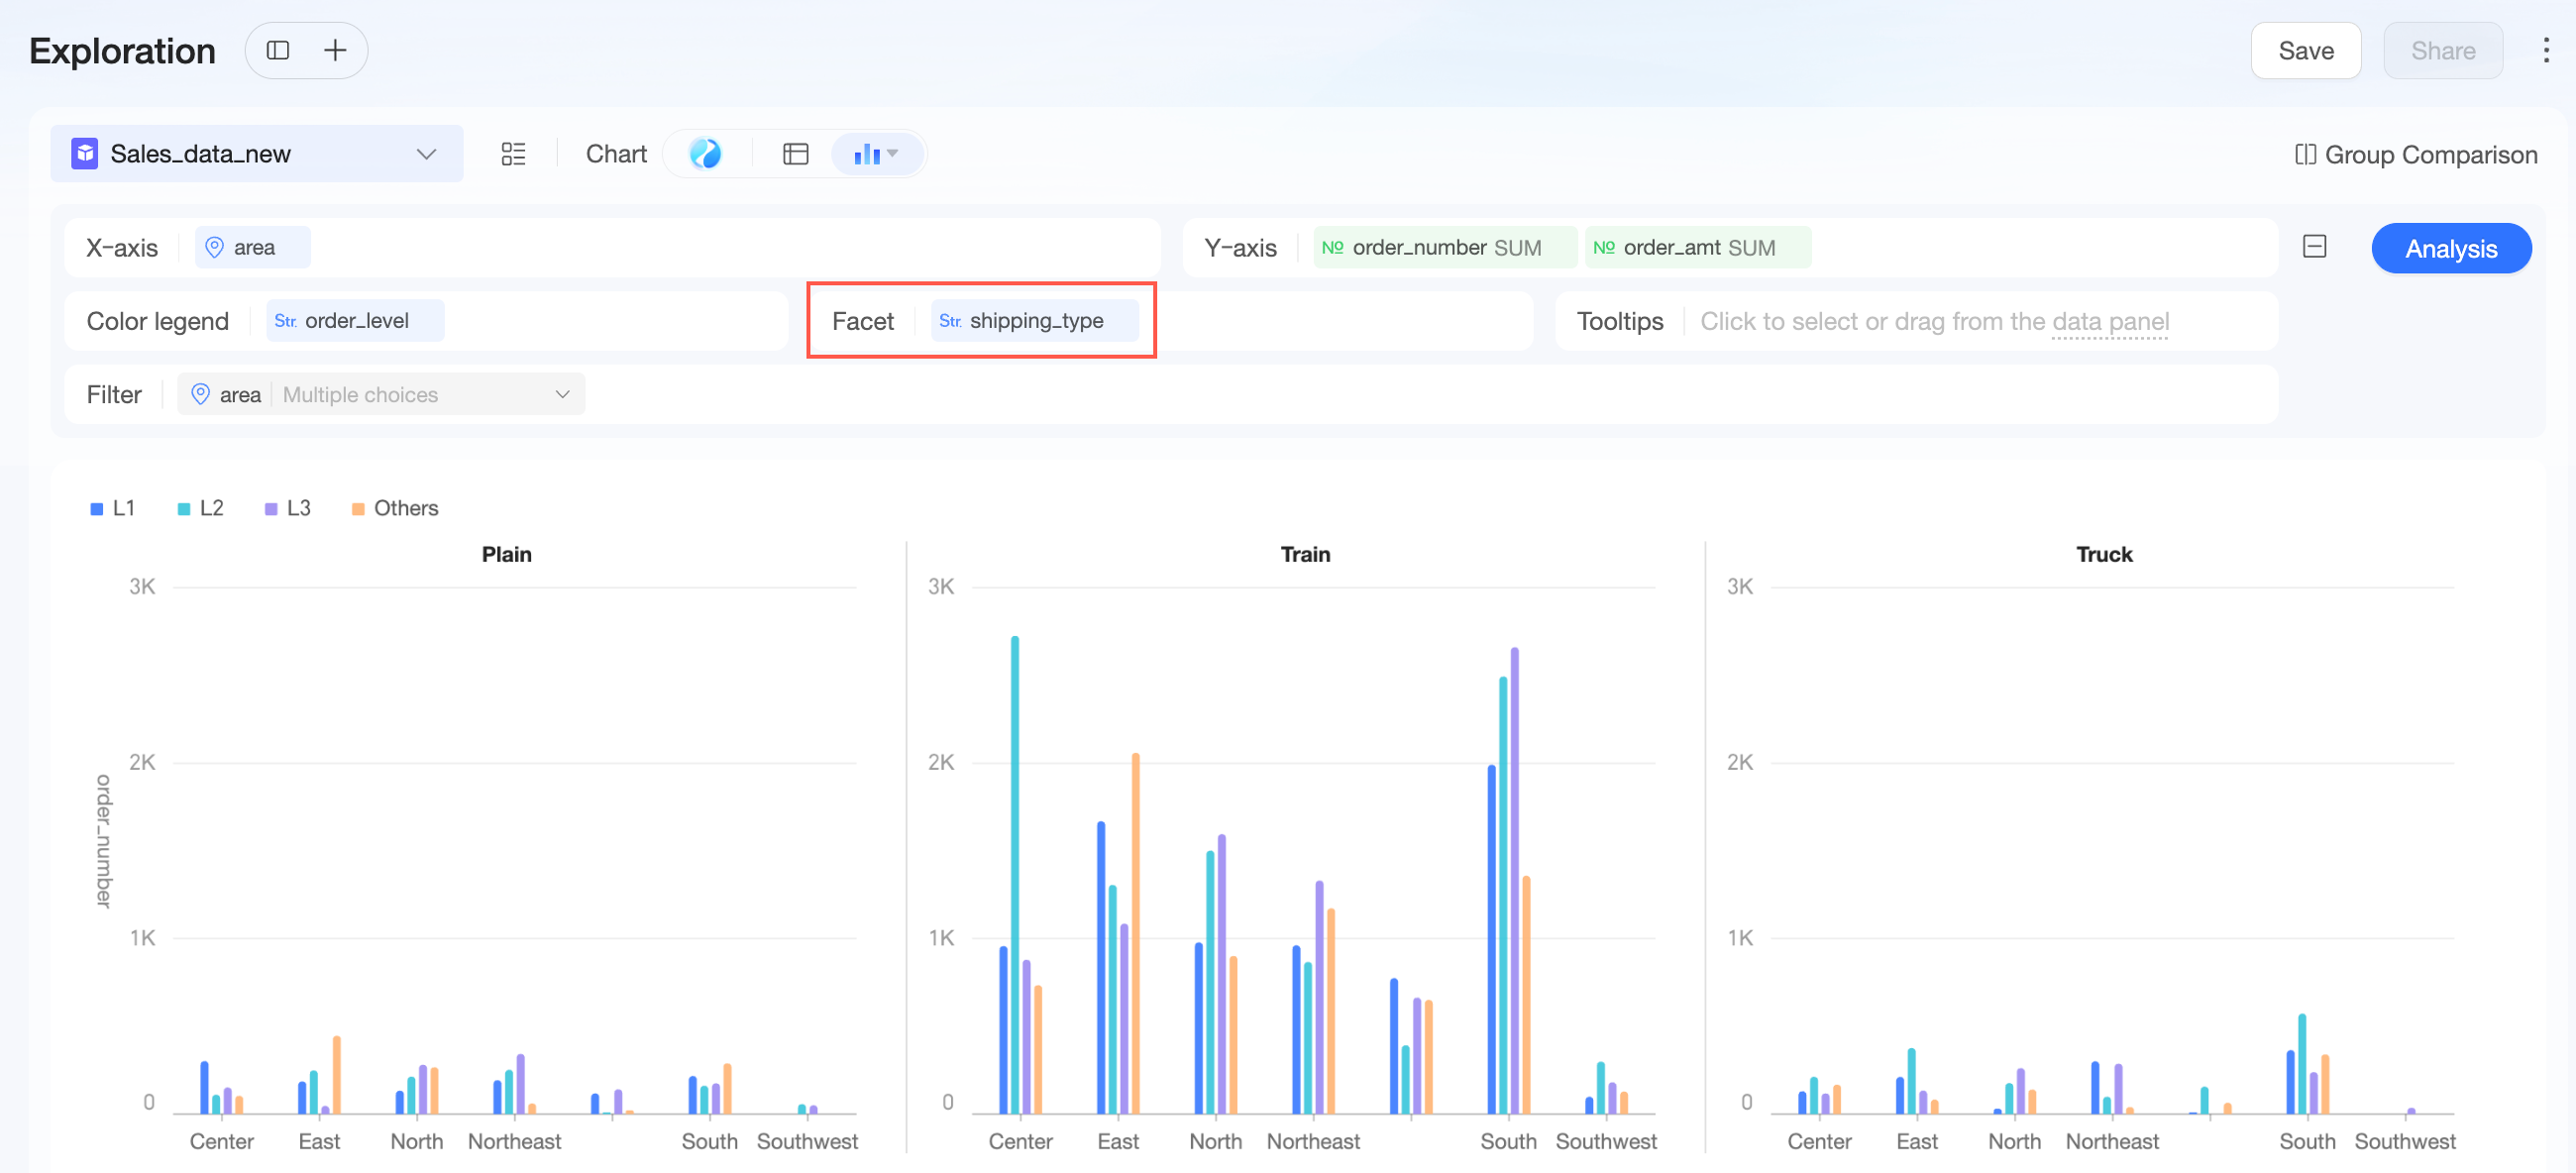
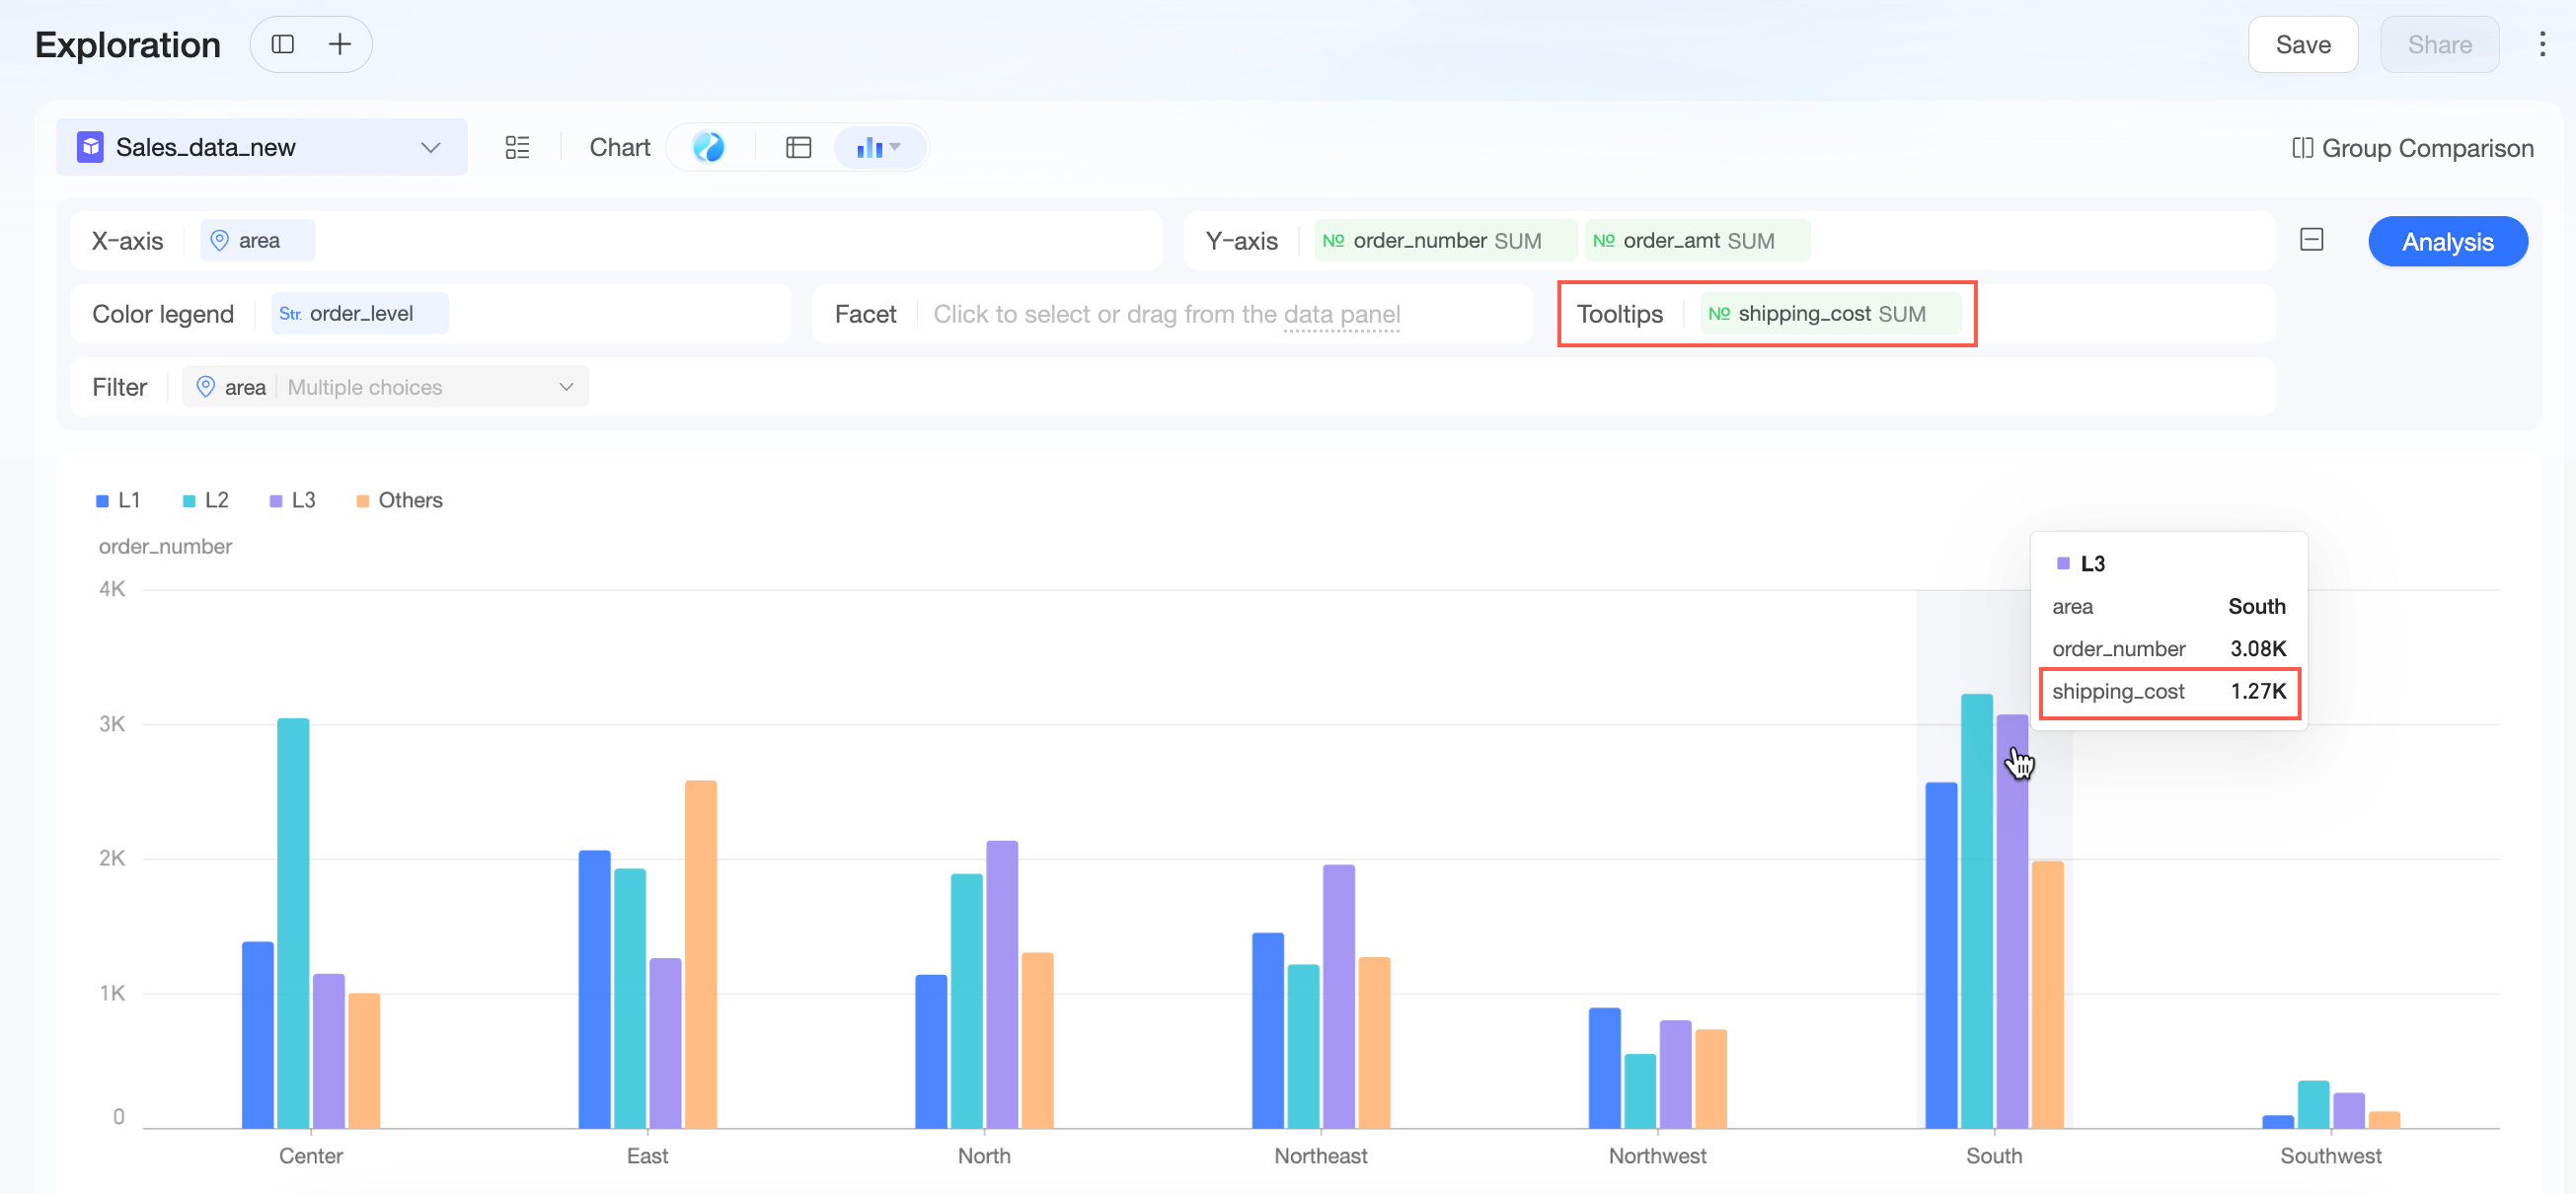
icon to expand for more configurations.In the advanced configuration section, you can configure the chart's color legend, facet, and tooltip.
-
Color legend
-
Facet
-
Tooltip
-
-
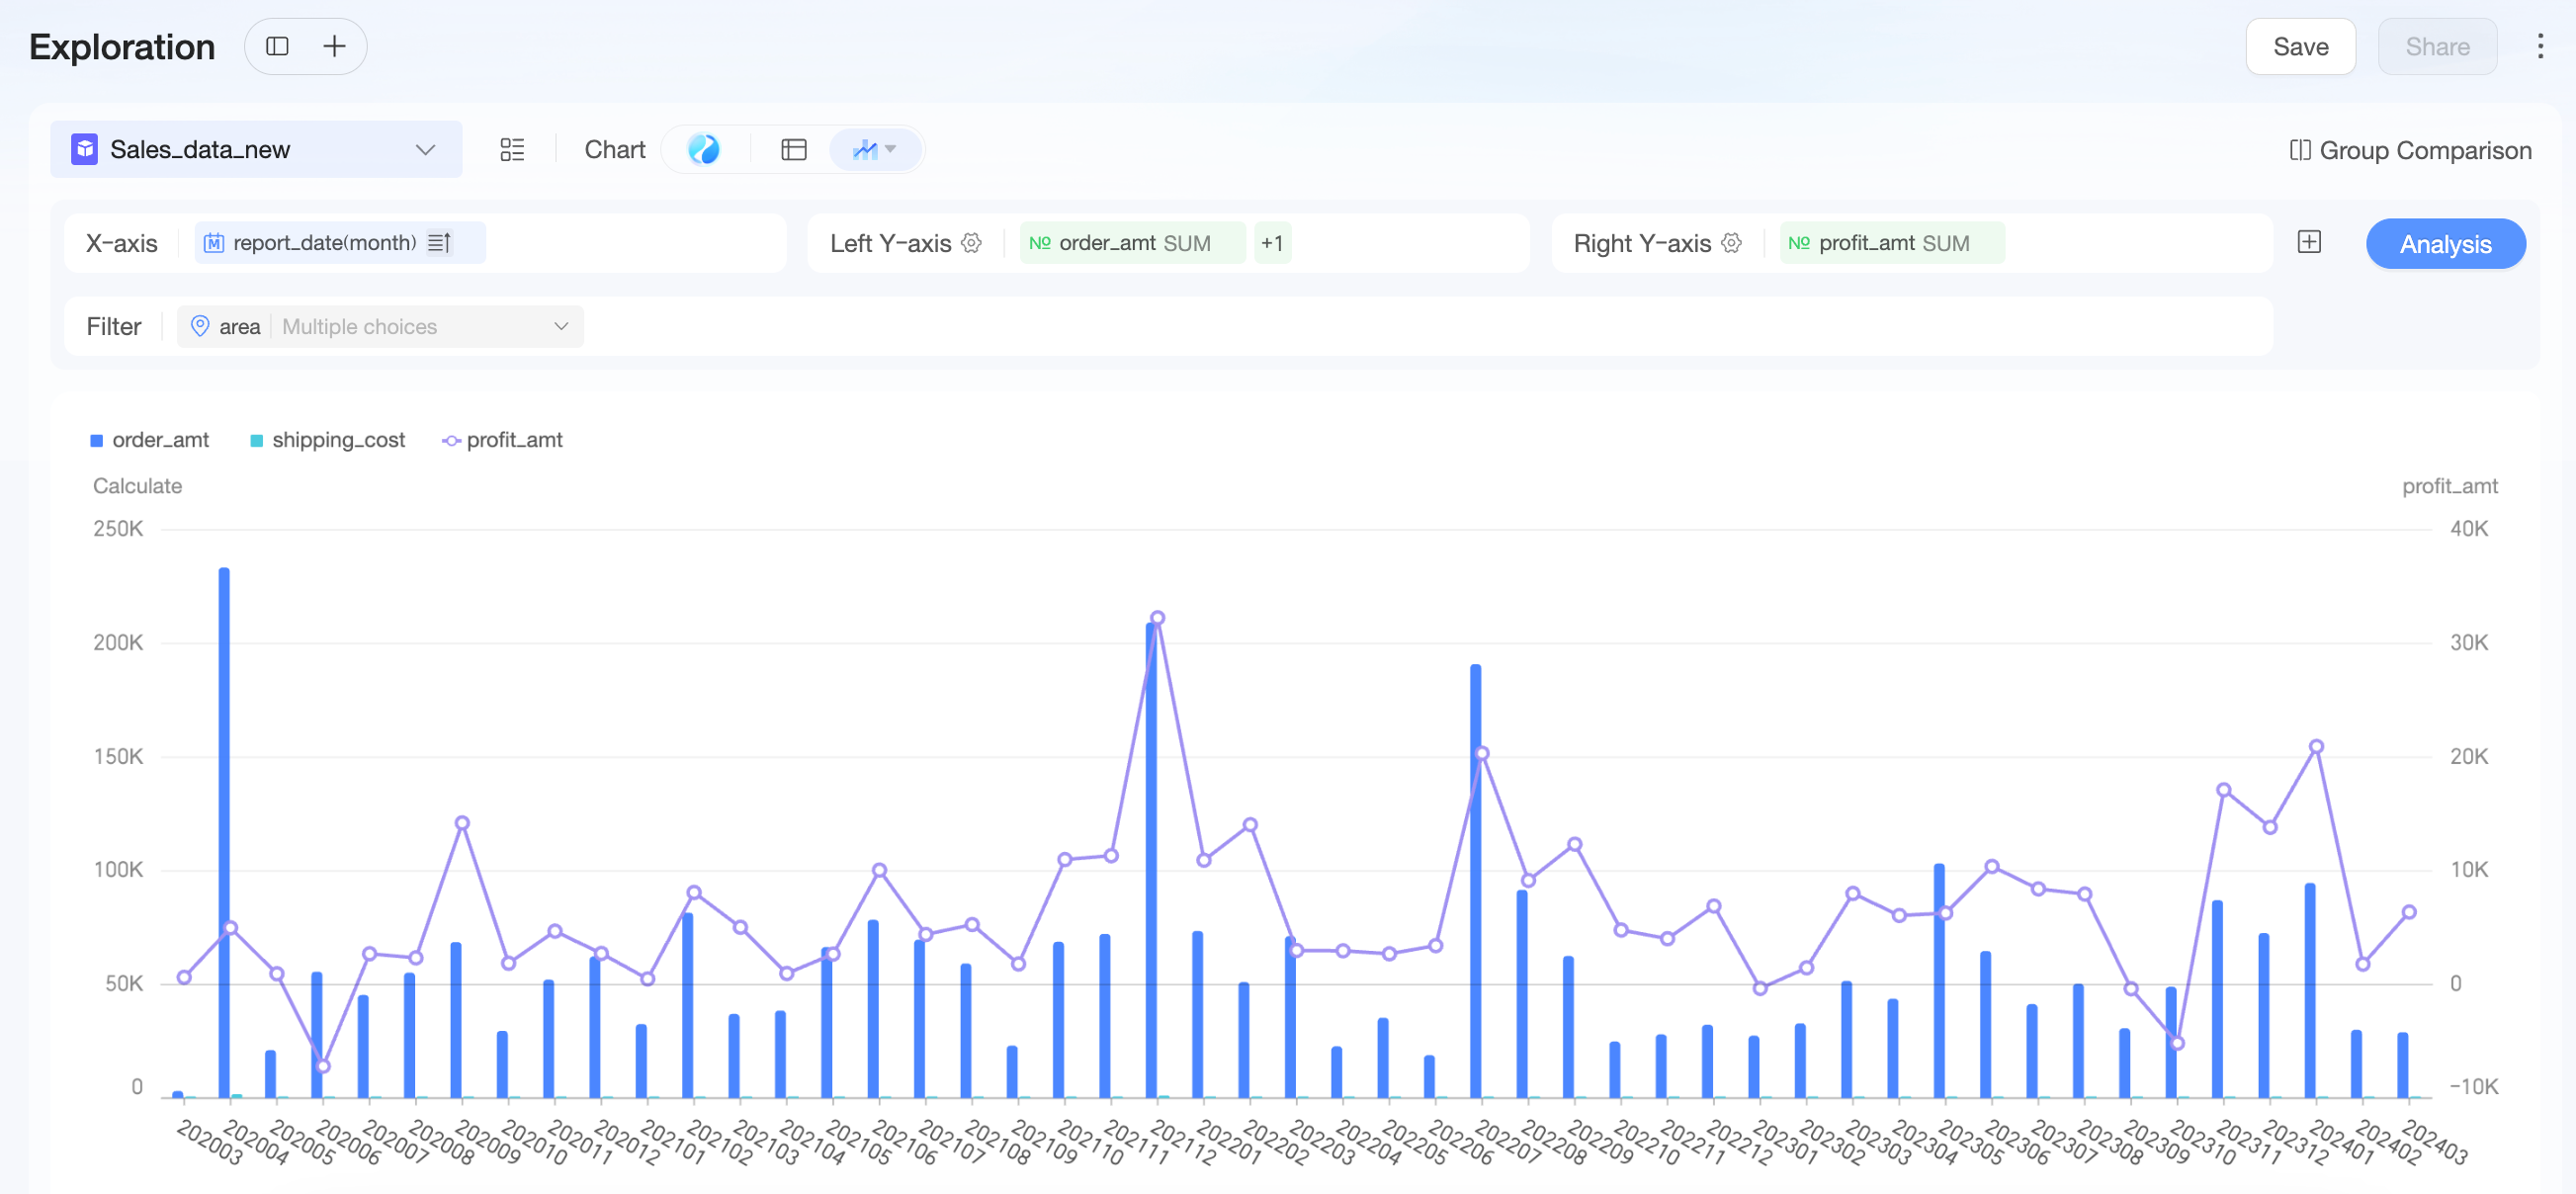
A combo chart requires you to configure the X-axis, left Y-axis, right Y-axis, and filters.
-
For the left Y-axis and right Y-axis, you can set the chart selection to line, bar, or area.
When you select bar or area, you can choose a normal, stacked, or percentage effect. -
Click the
icon to expand for more configurations. You can configure the chart's color legend and tooltip in the advanced configuration section.
-
-
A pie chart requires you to configure the sector label, sector angle, tooltip, and filters. Marquee selection is also supported.
-
A funnel chart requires you to configure the funnel layer, funnel layer width, and filters.
Click the
icon to expand for more configurations.In the advanced configuration section, you can configure the chart's tooltip.
 icon to expand for more configurations.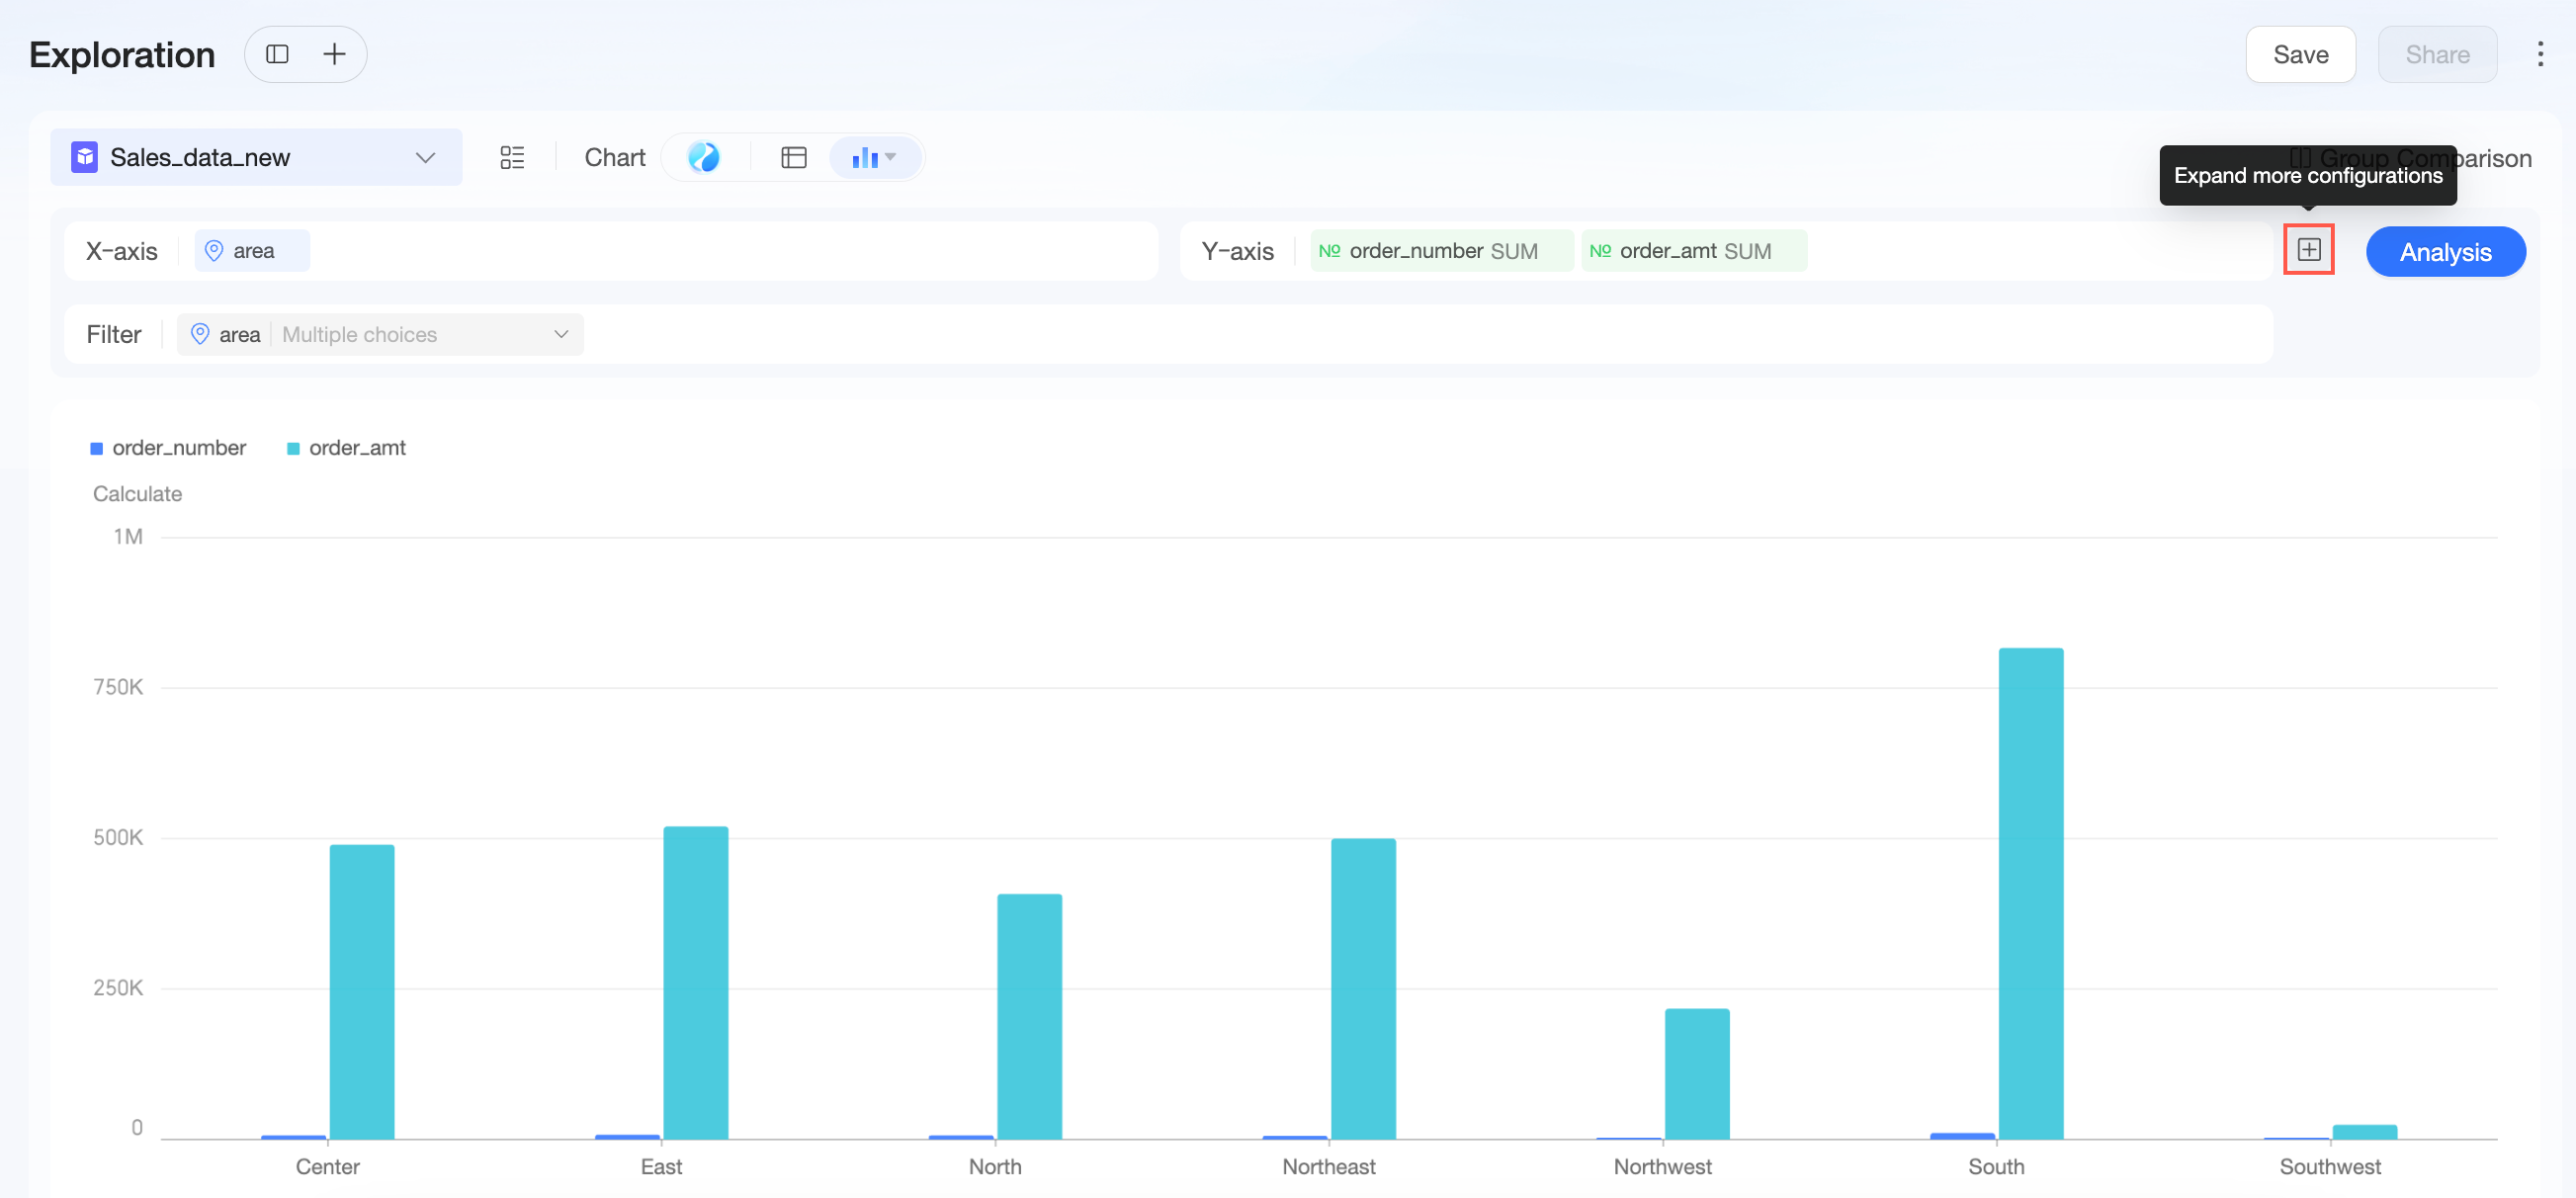
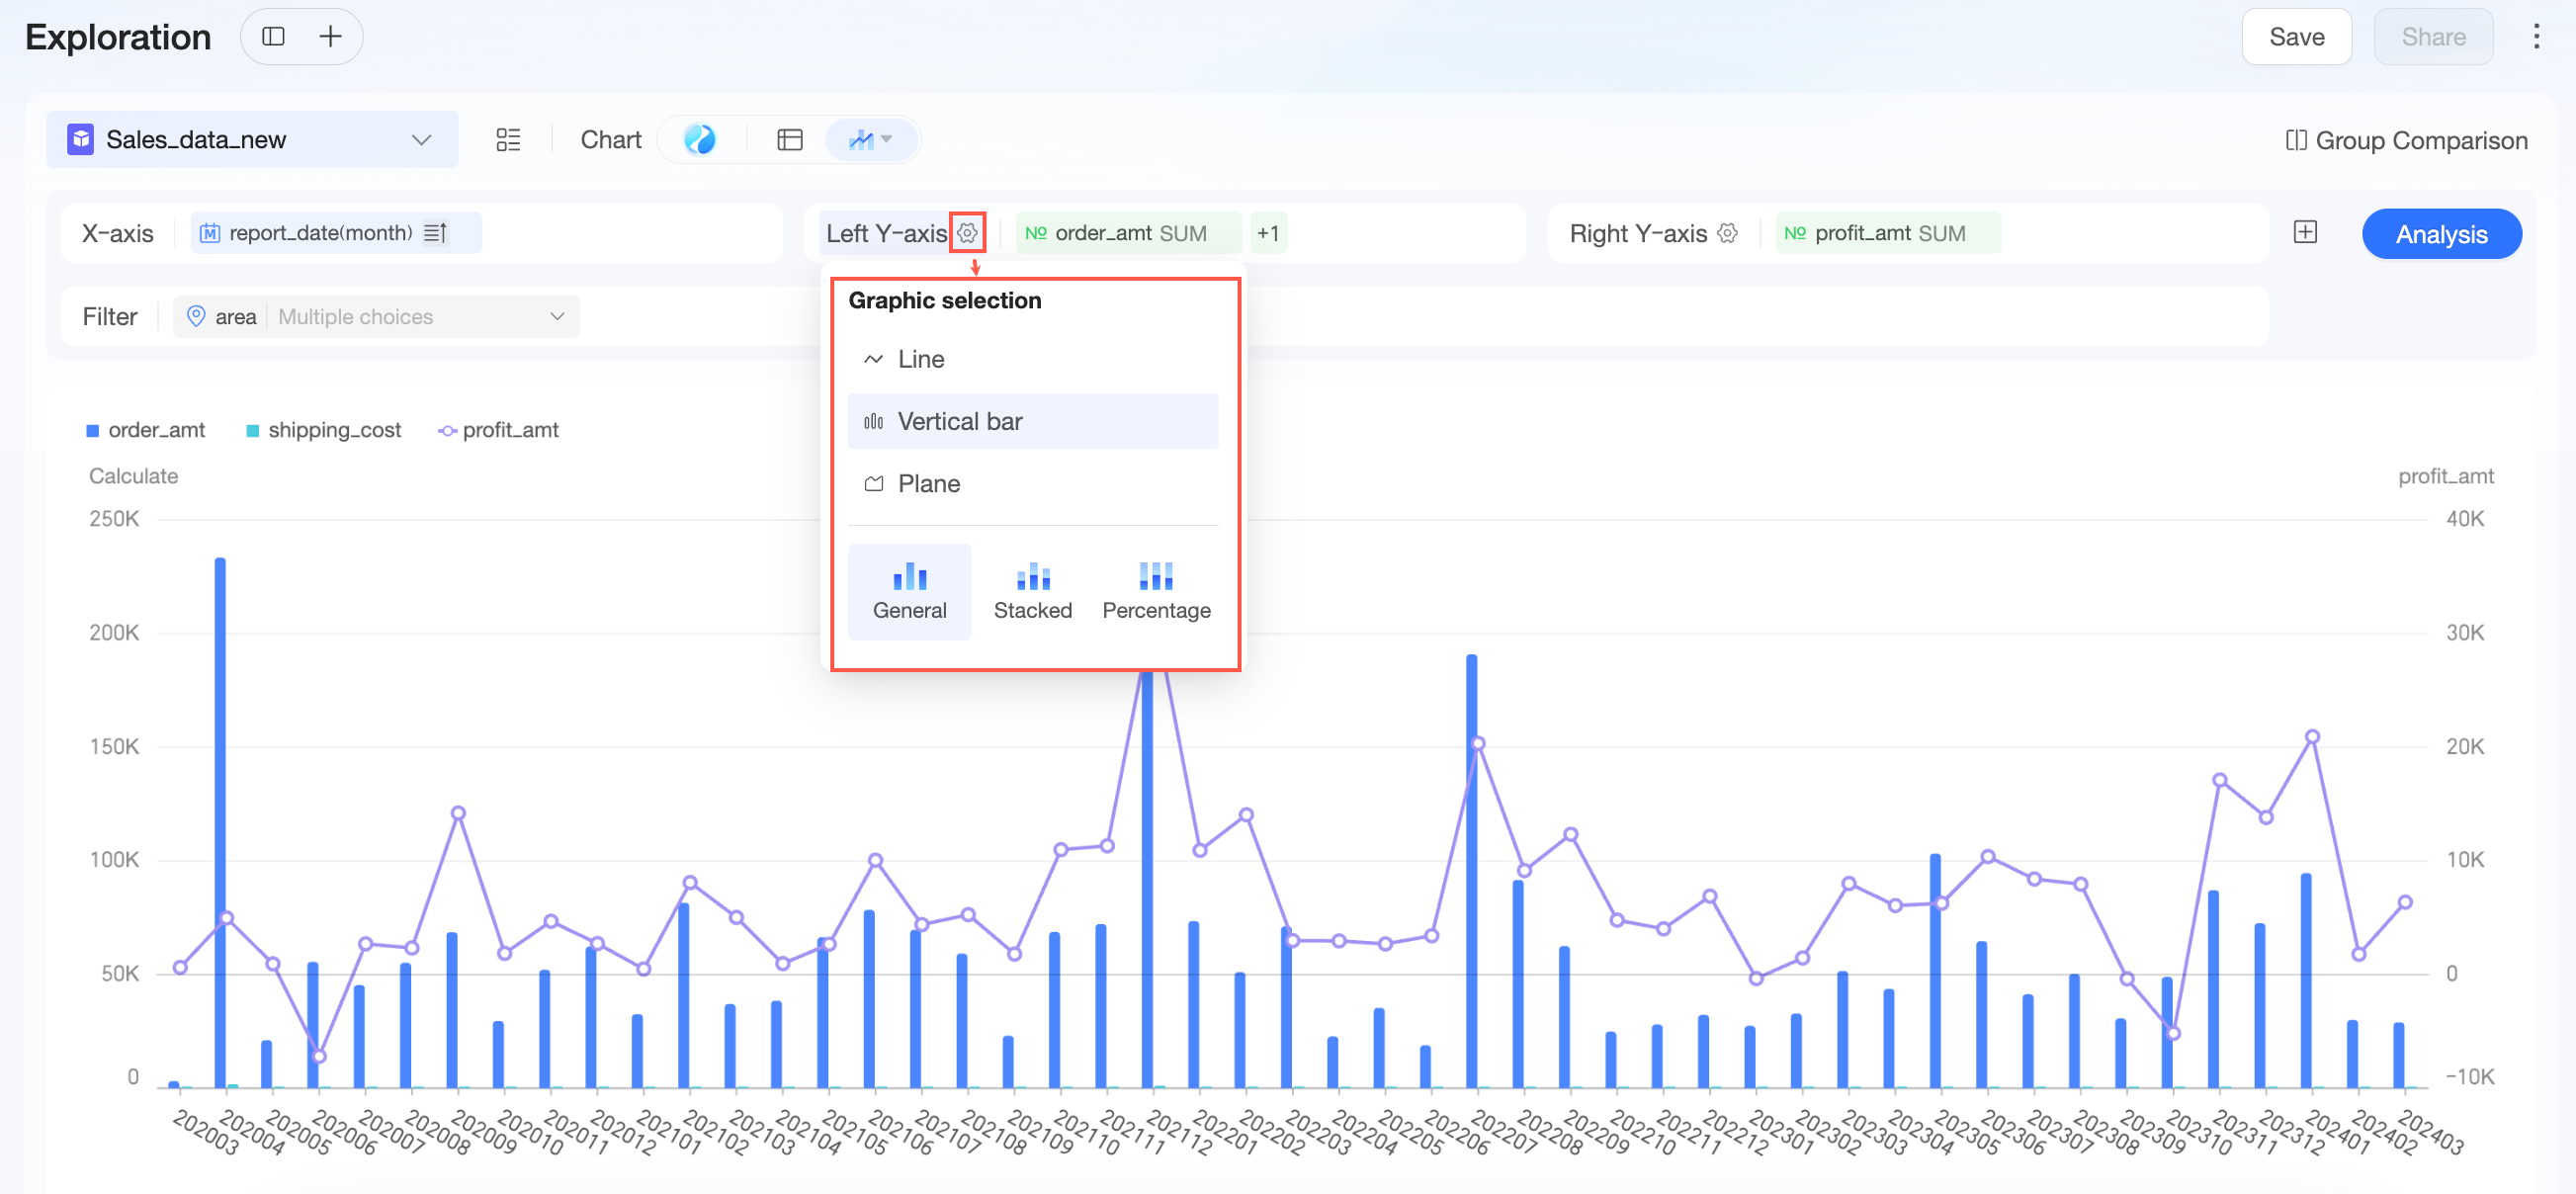 When you select bar or area, you can choose a normal, stacked, or percentage effect.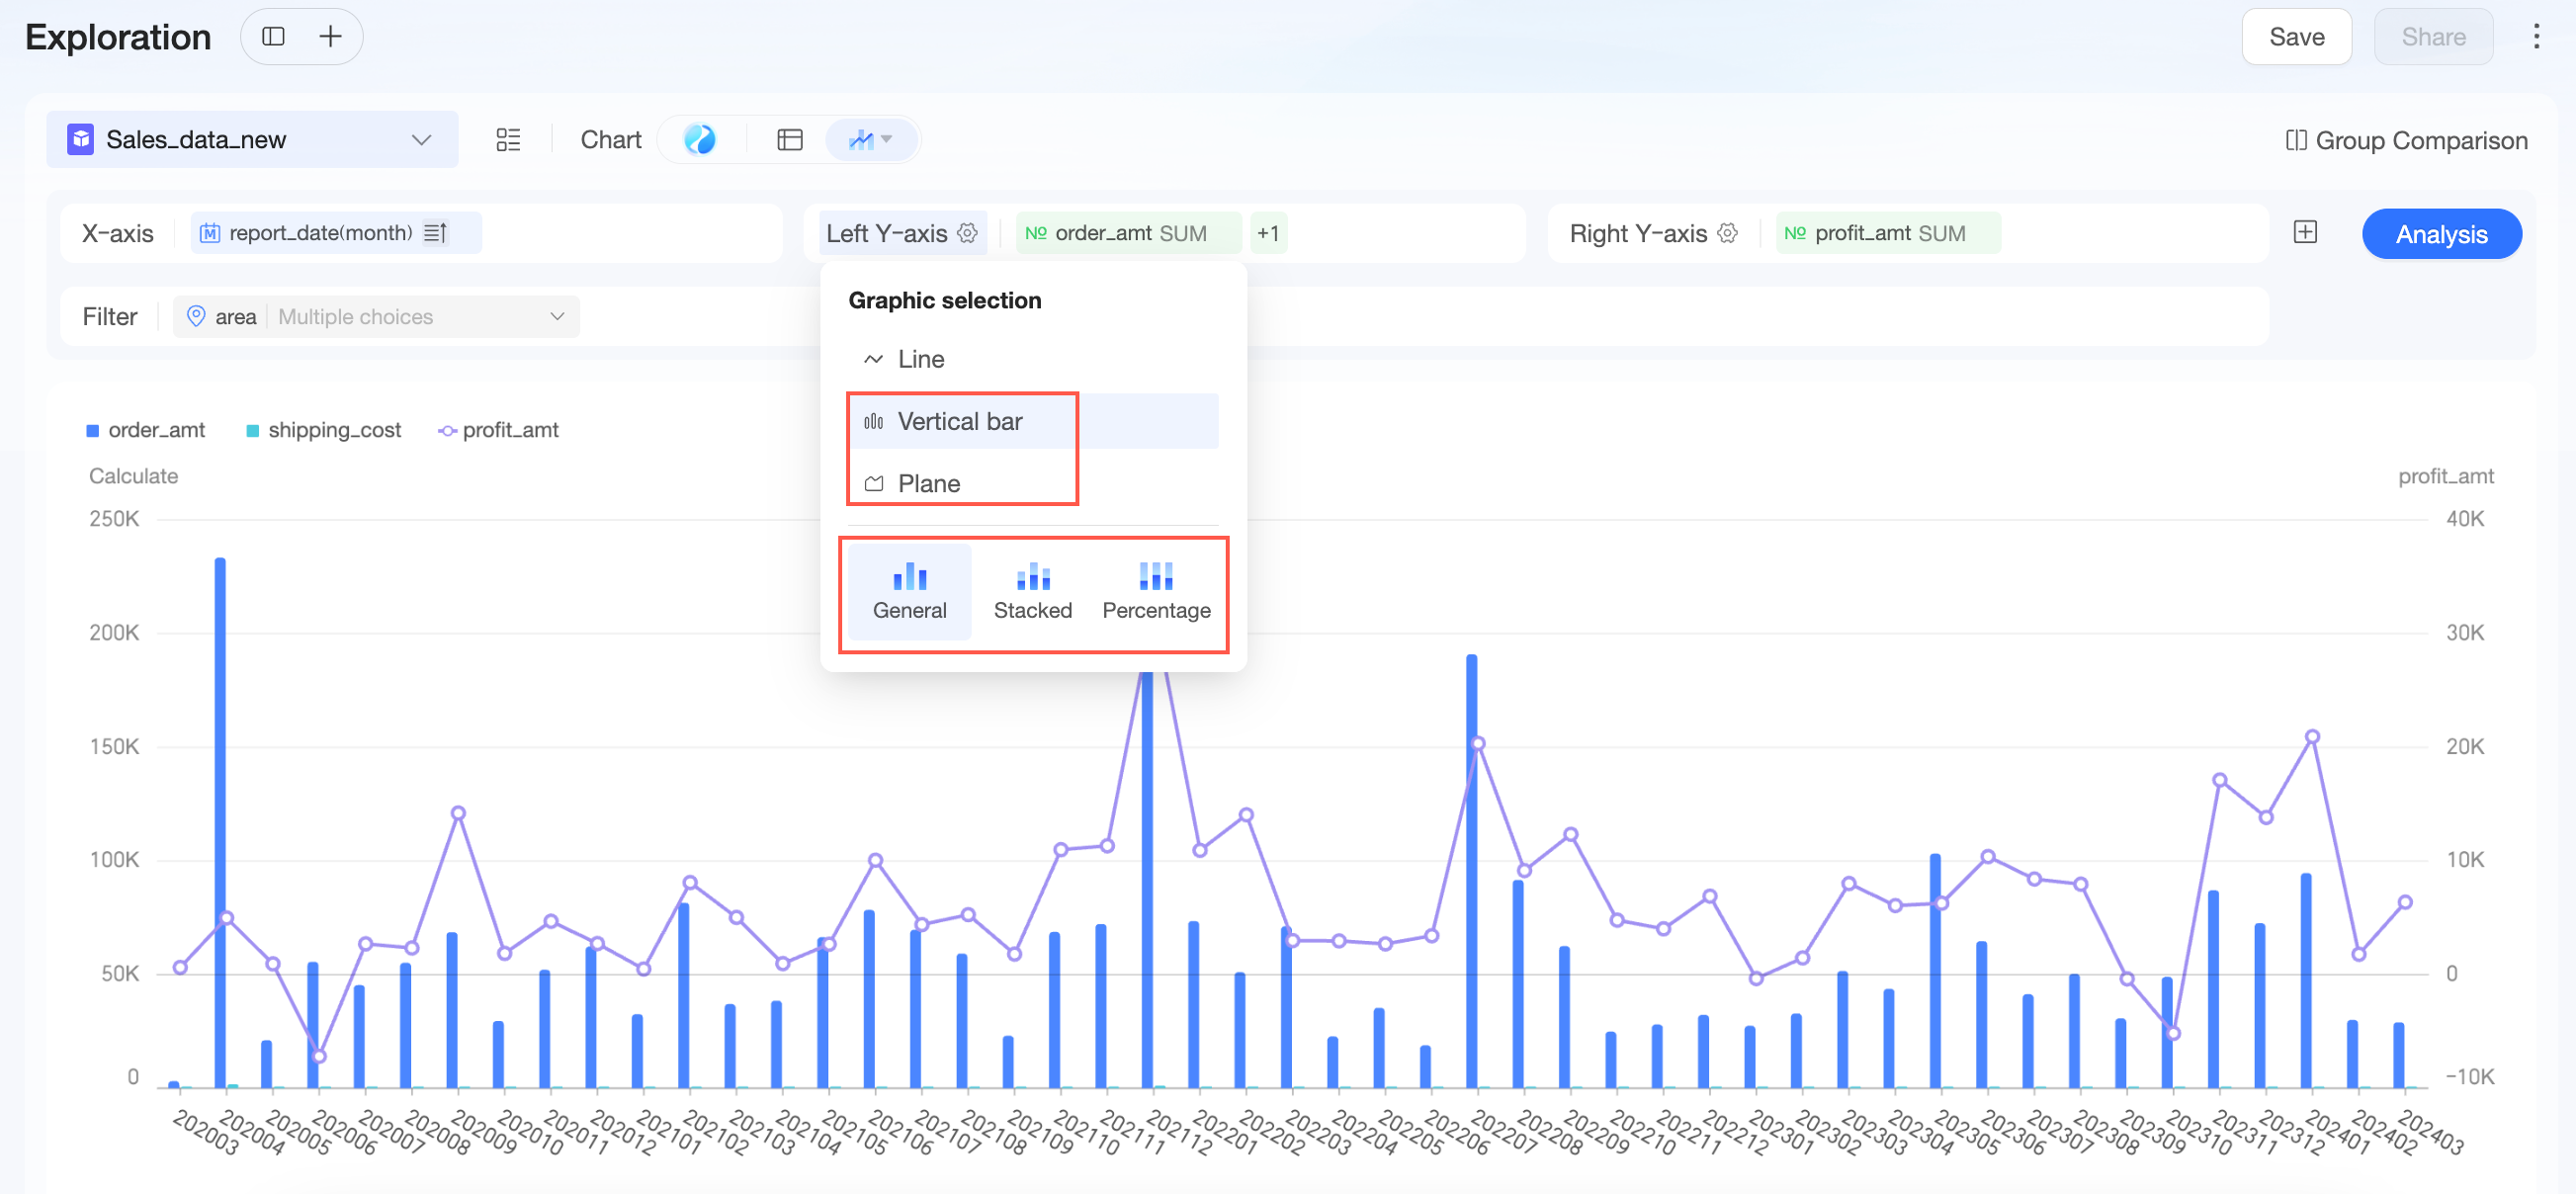
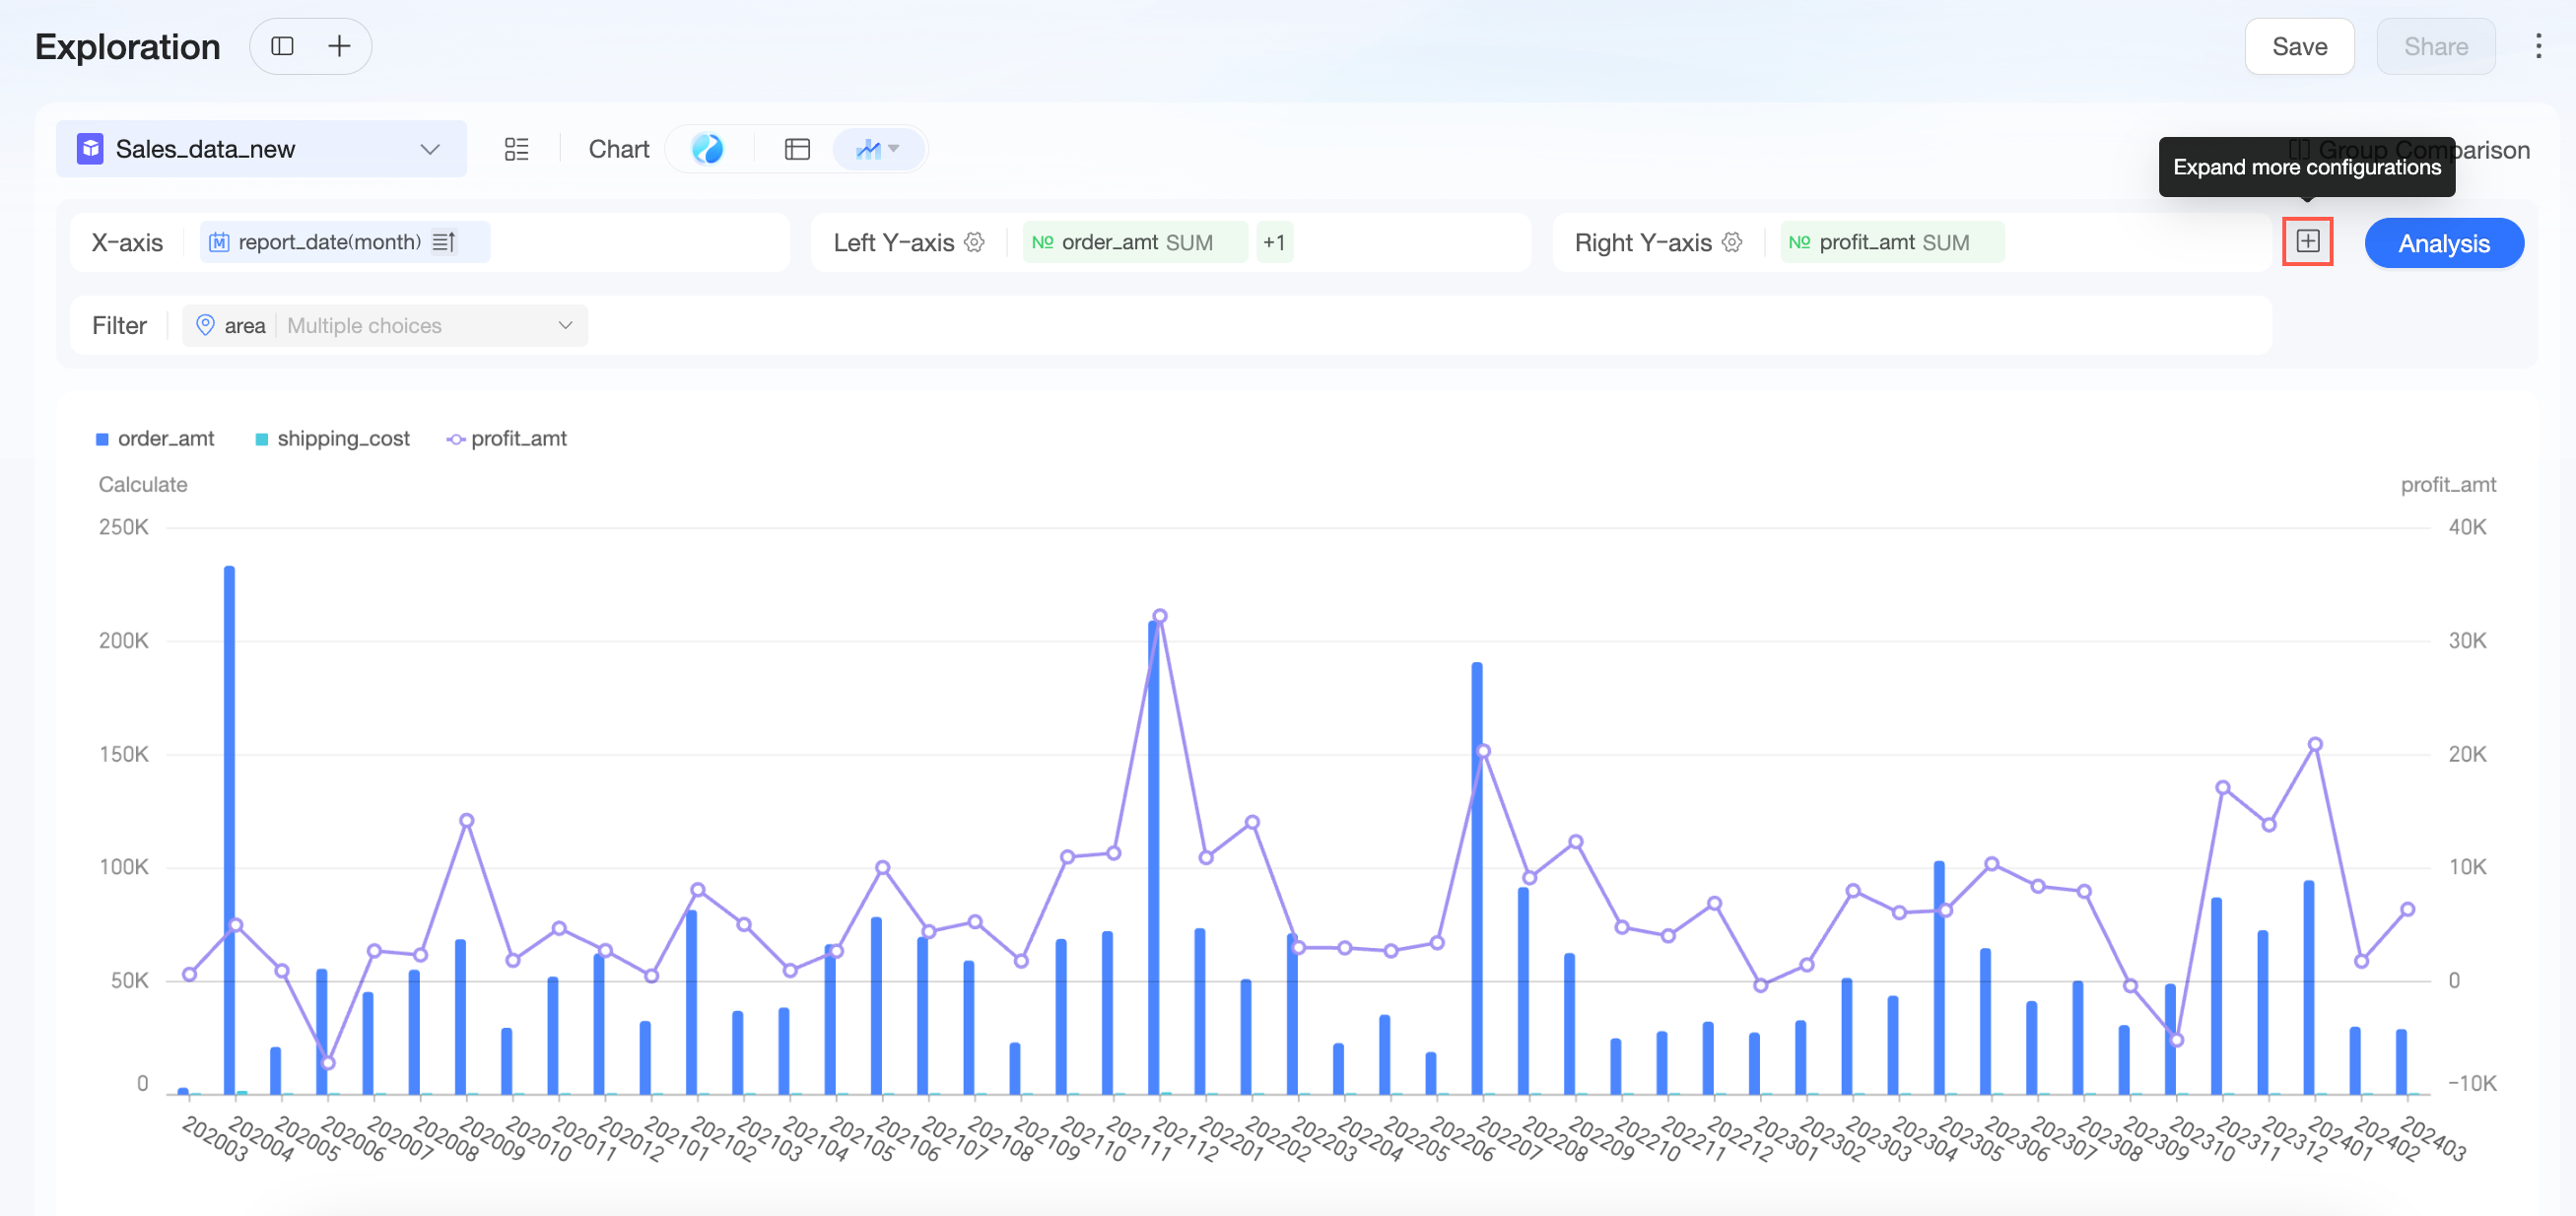 You can configure the chart's color legend and tooltip in the advanced configuration section.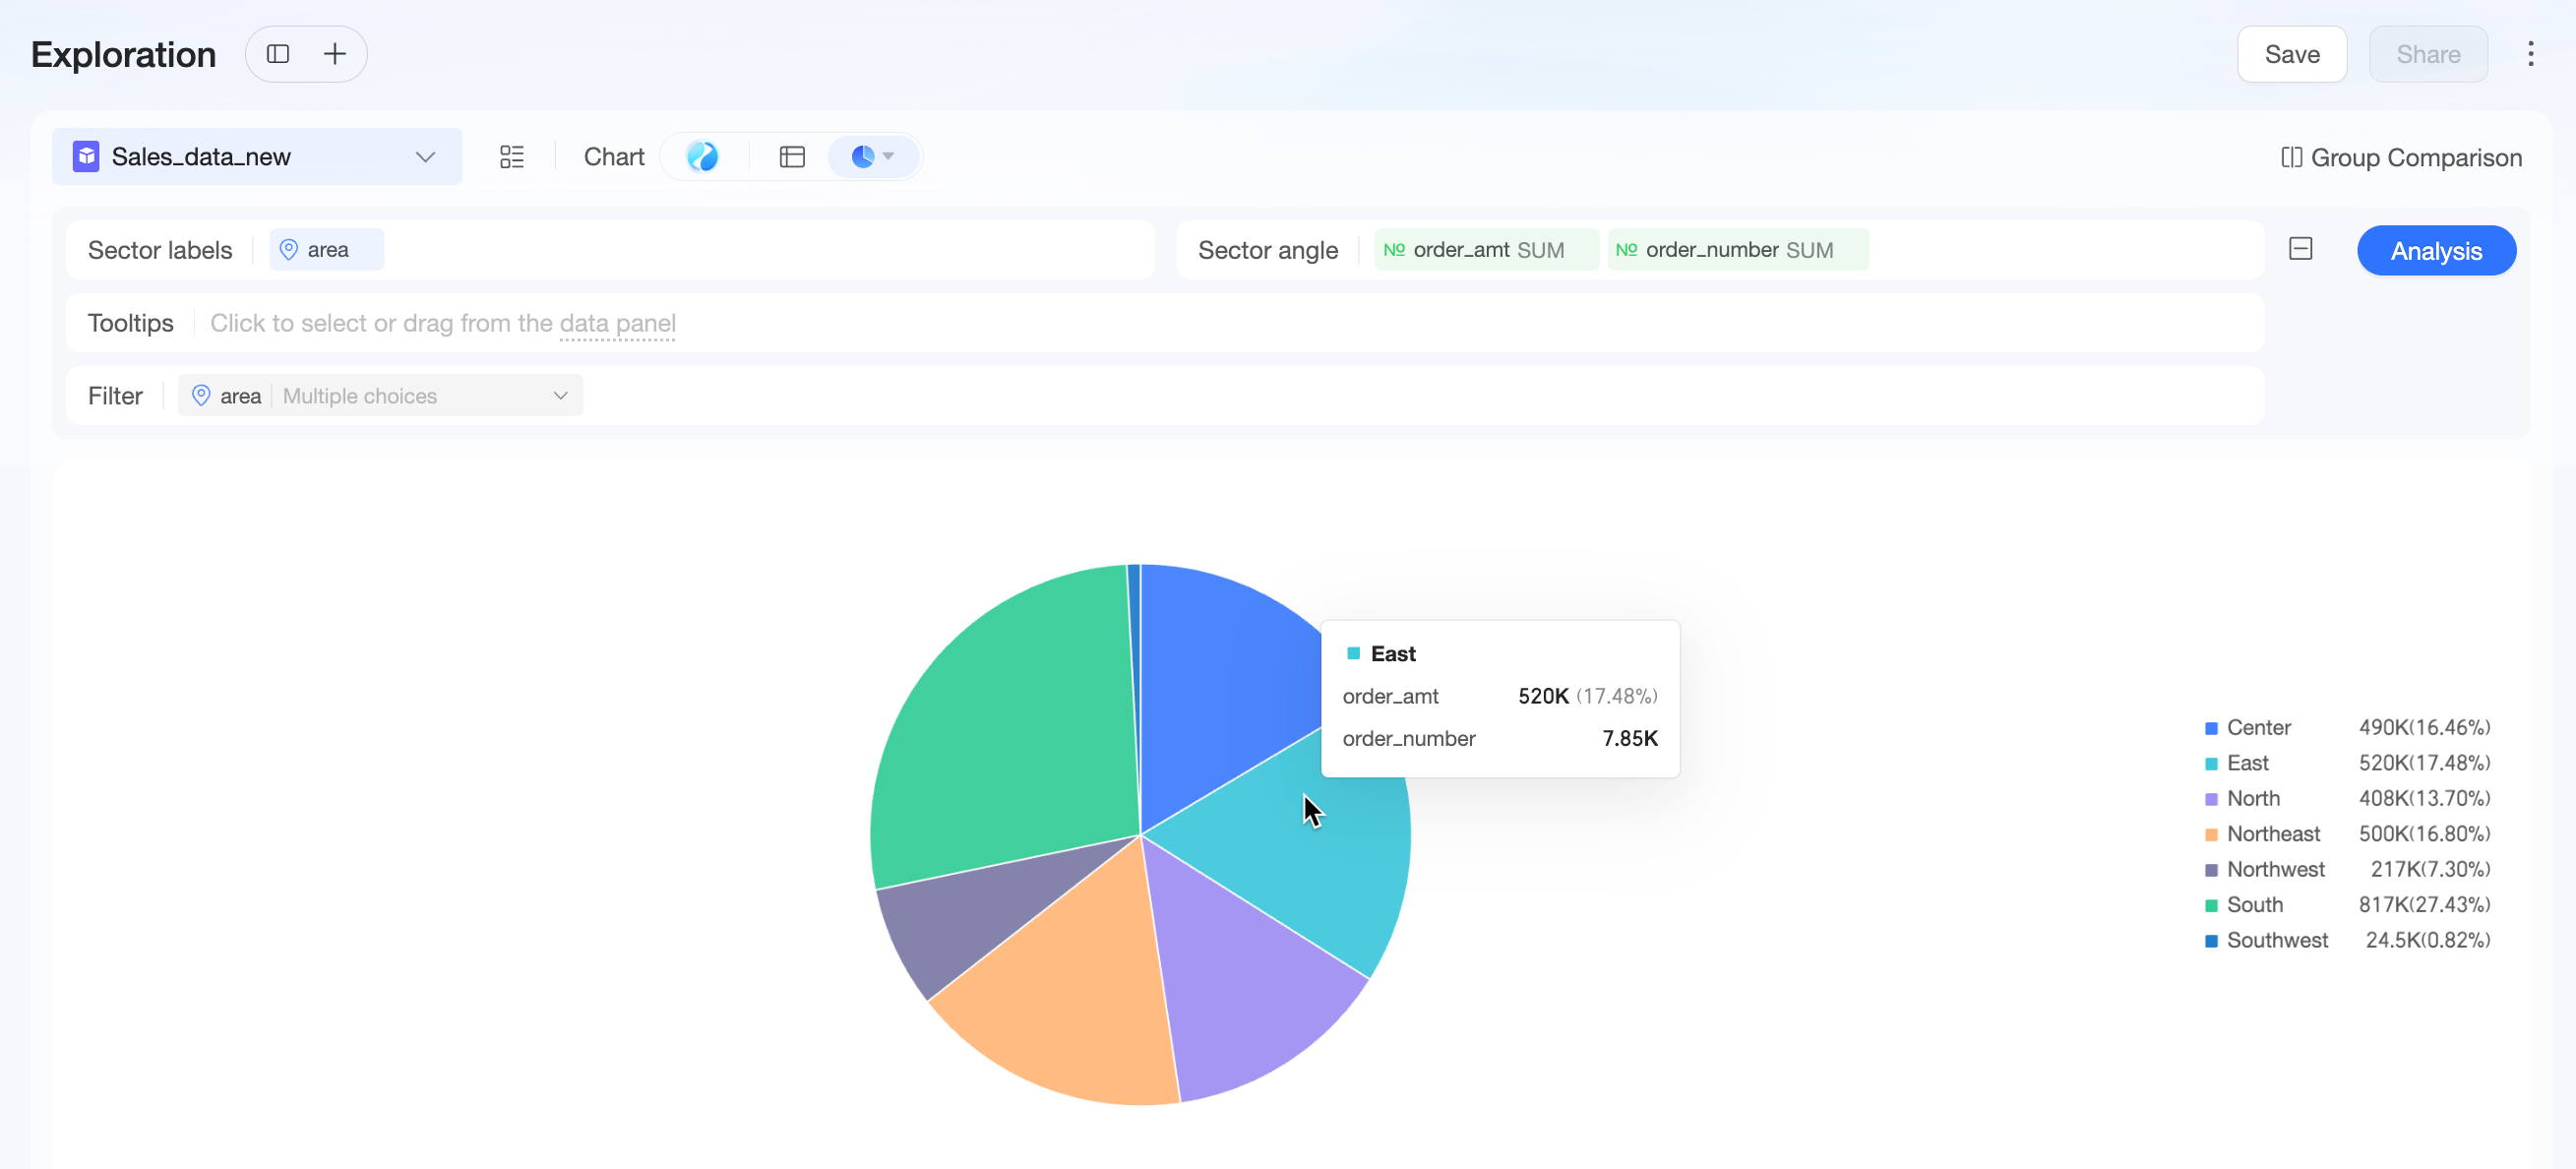
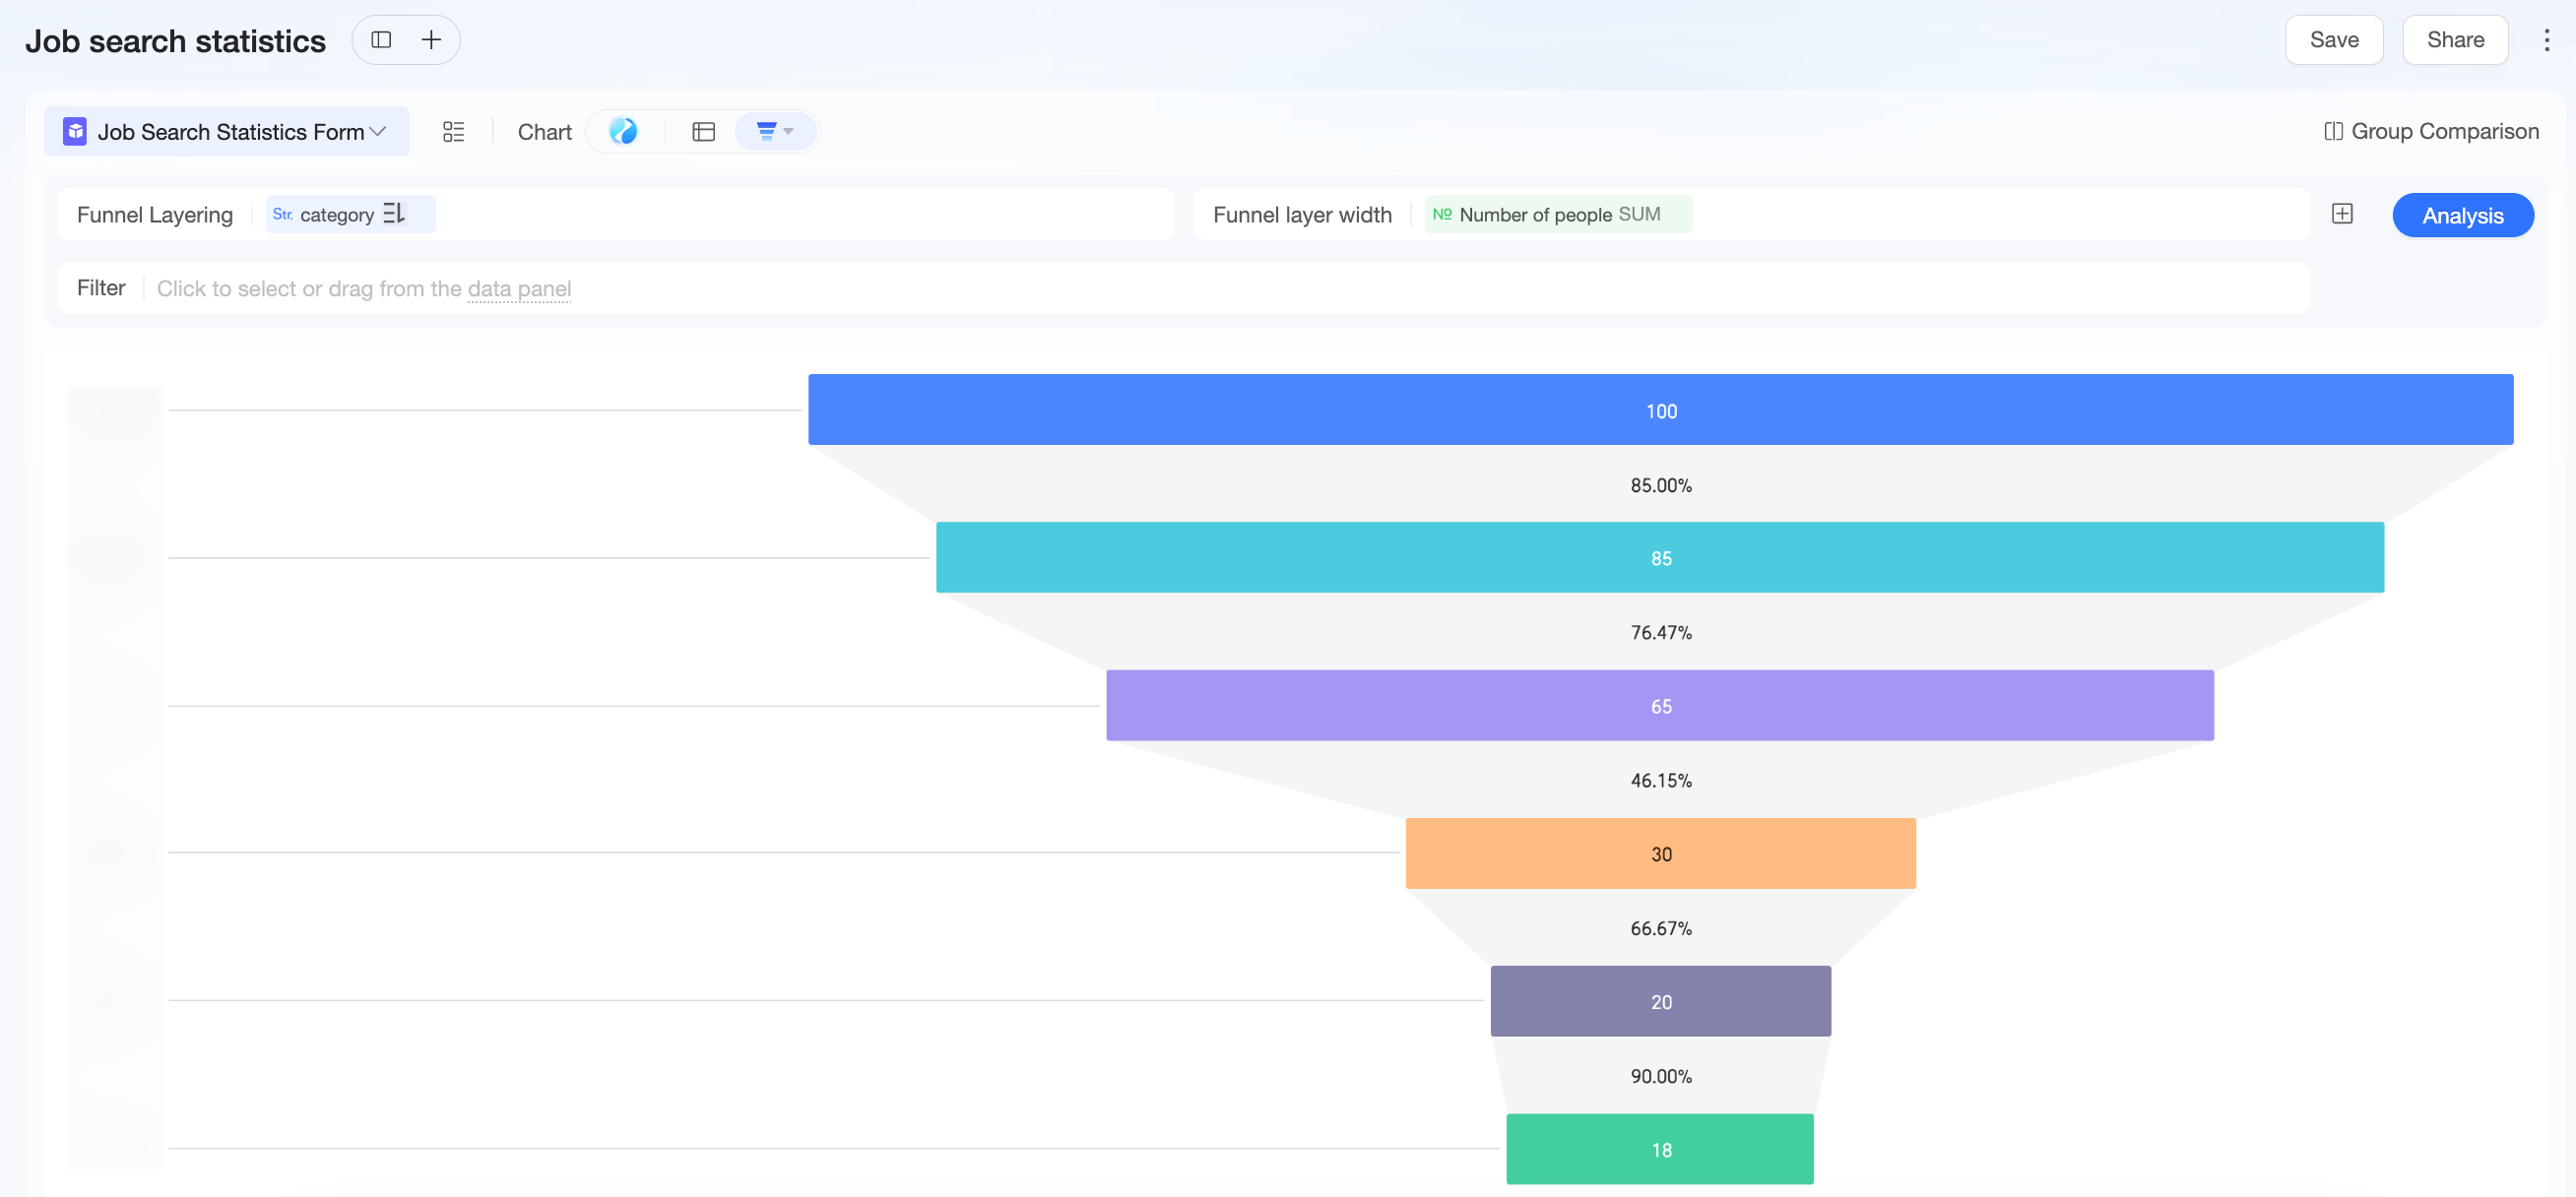
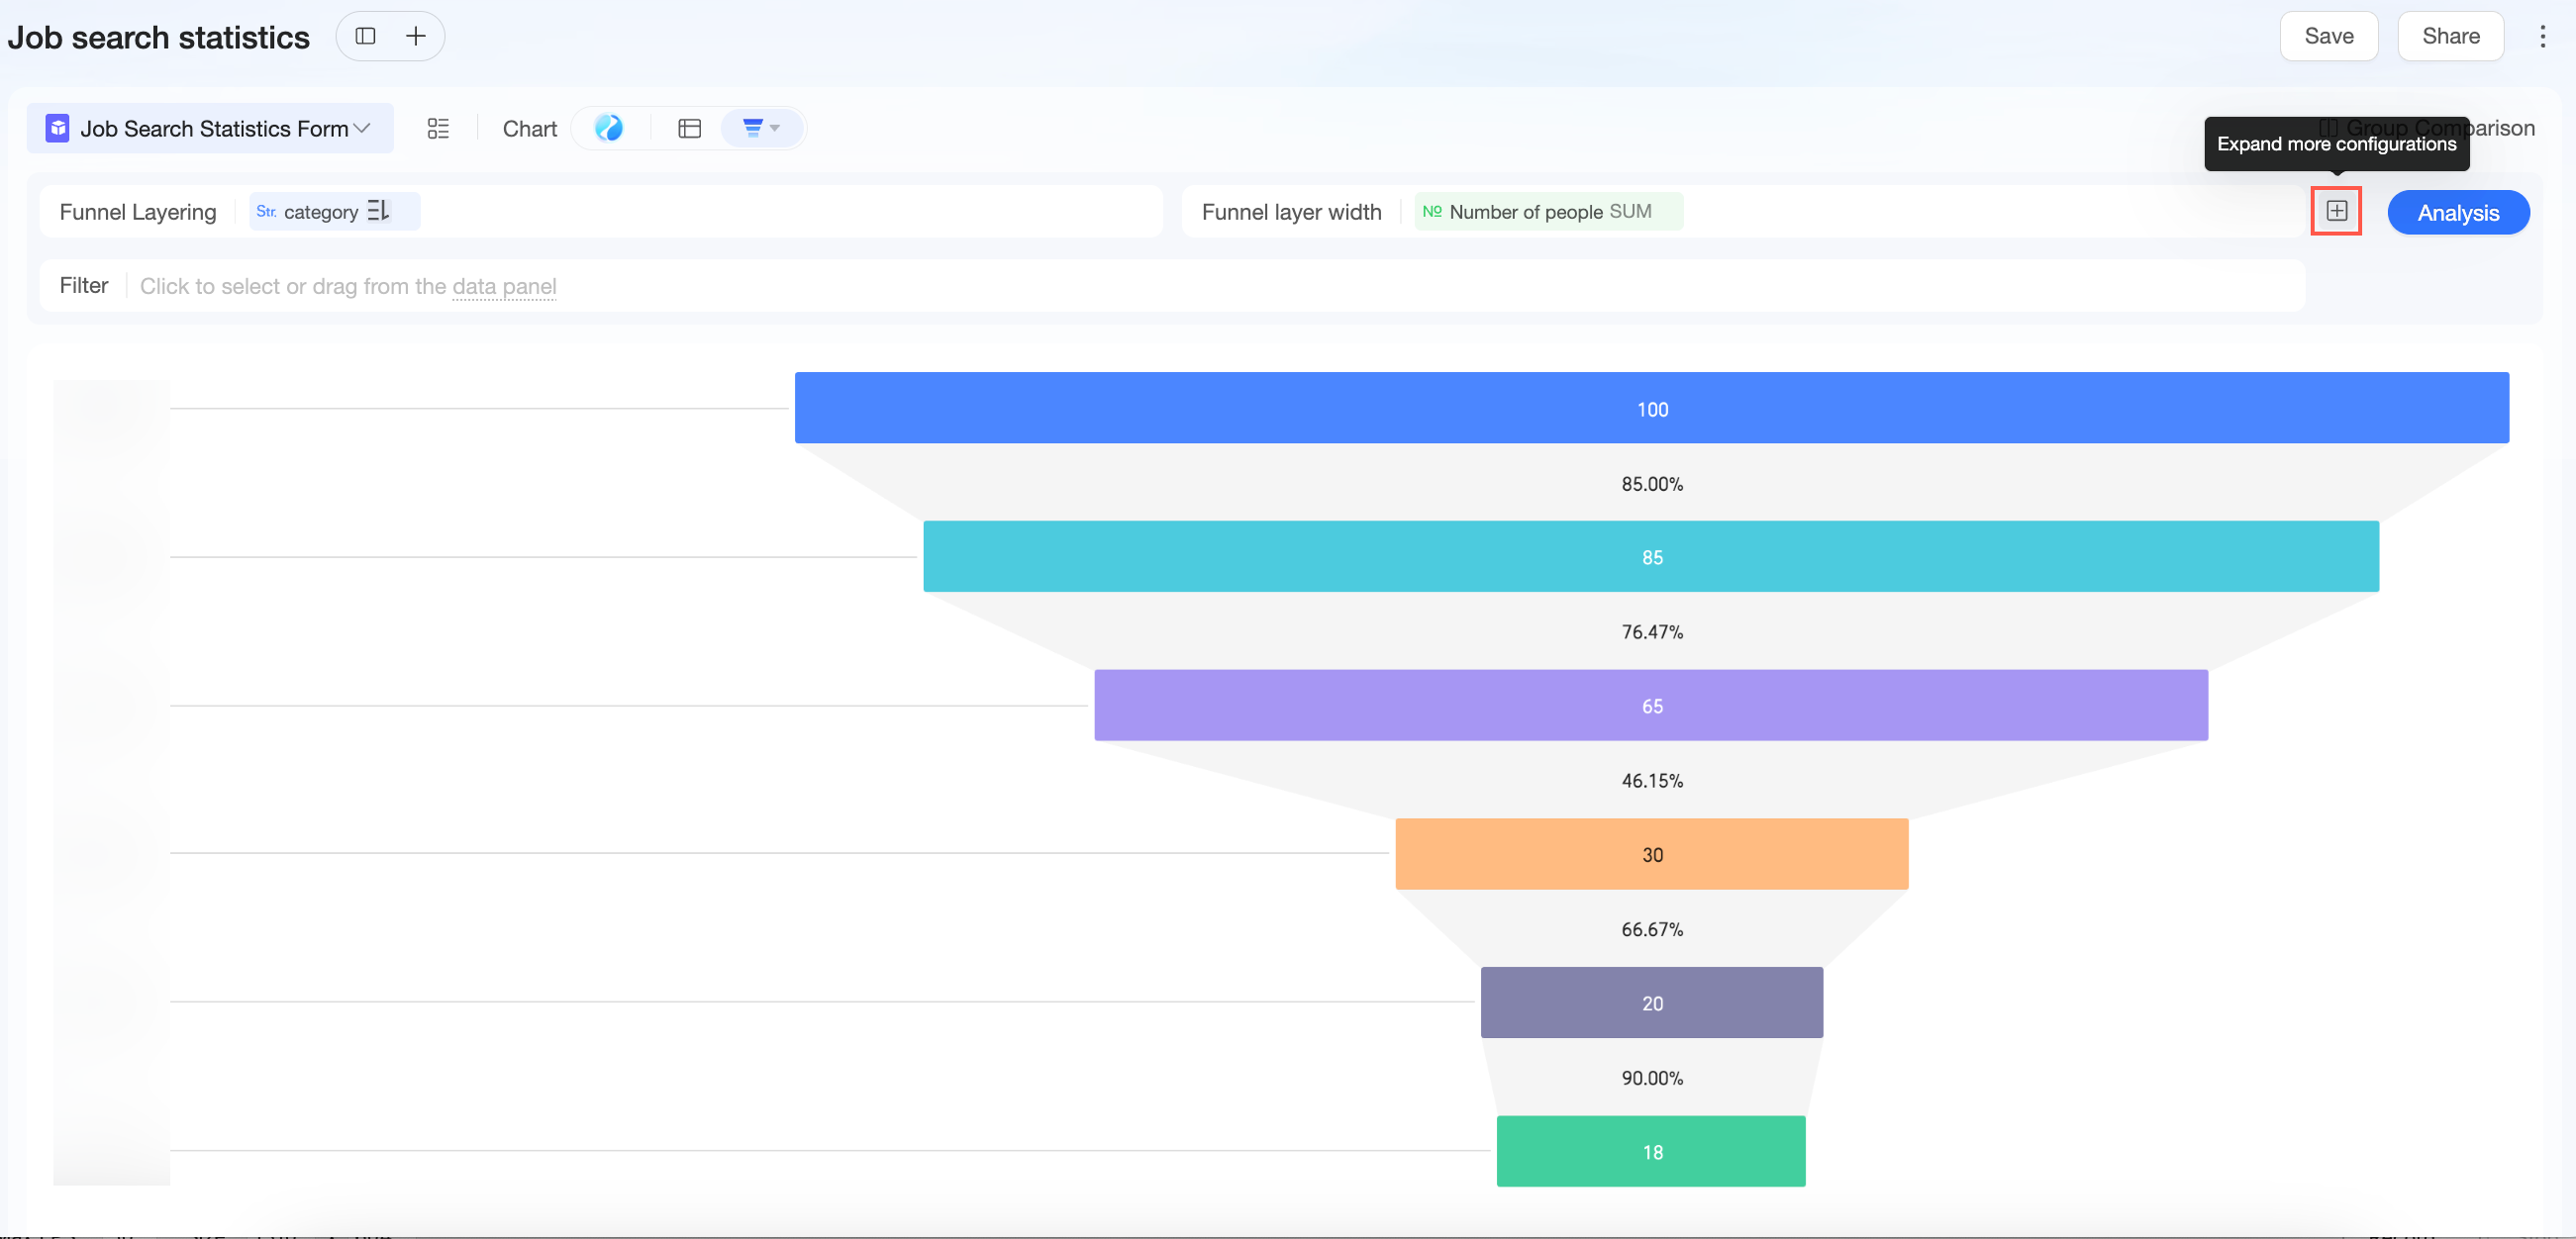
Chart field configuration
Field selection
-
Click the
icon to expand the data pane. -
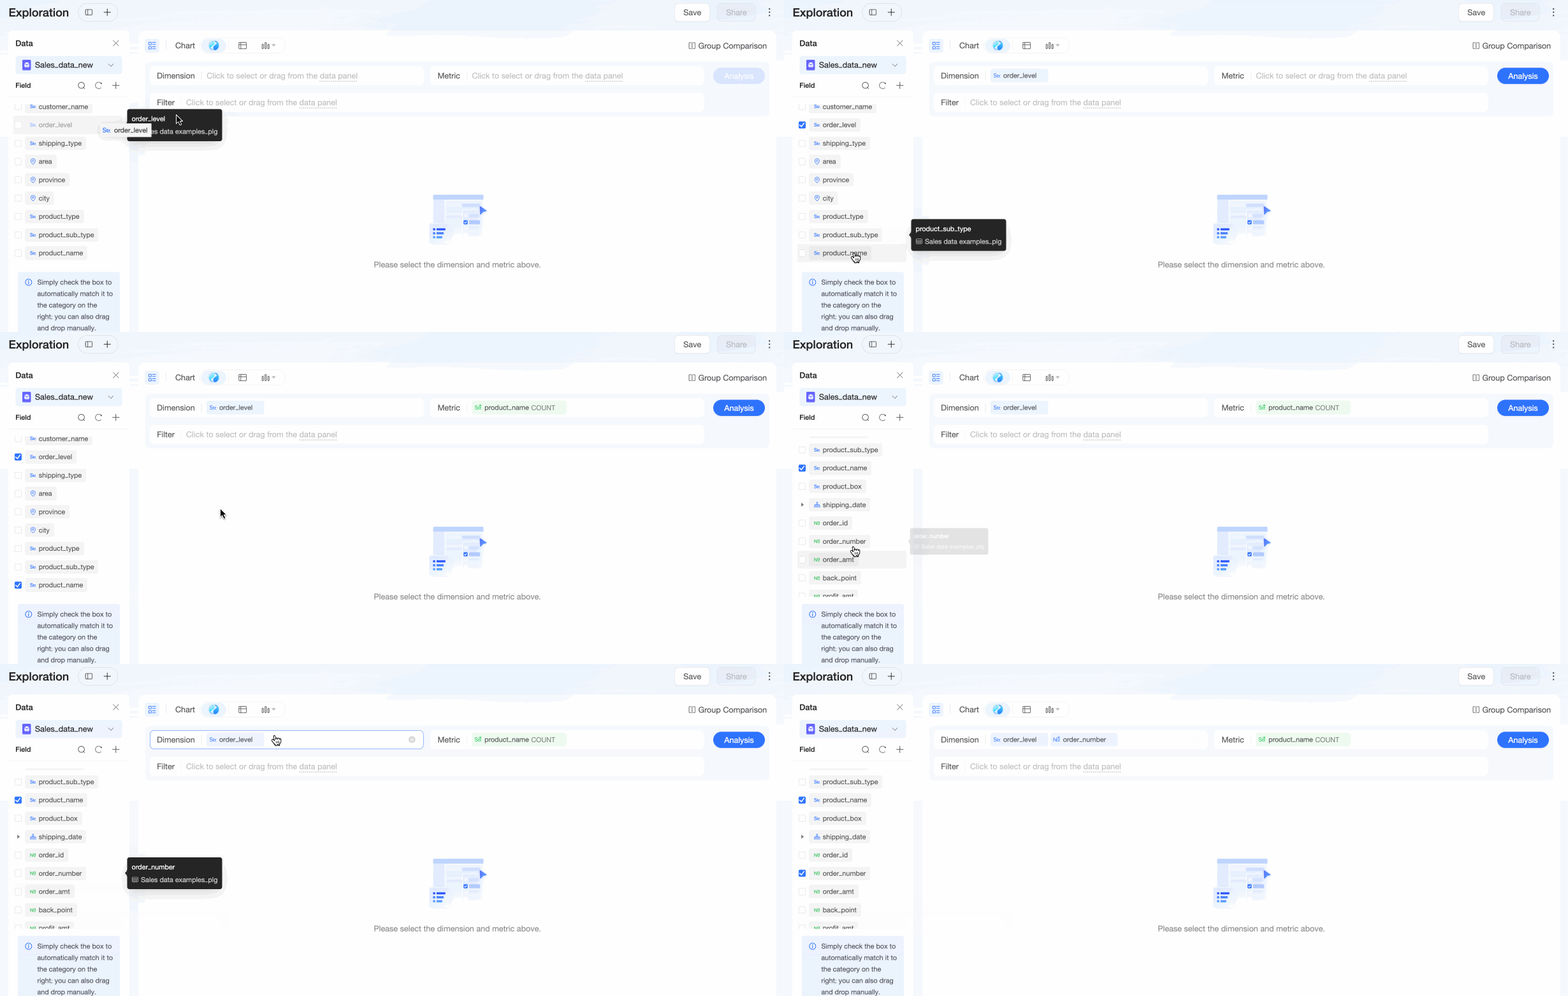
From the data pane on the left, select or drag dimension and measure fields.
You can freely drag and drop fields. If you drag a dimension field to the measures area, it automatically converts to a measure (count). If you drag a measure field to the dimensions area, it automatically converts to a dimension.
-
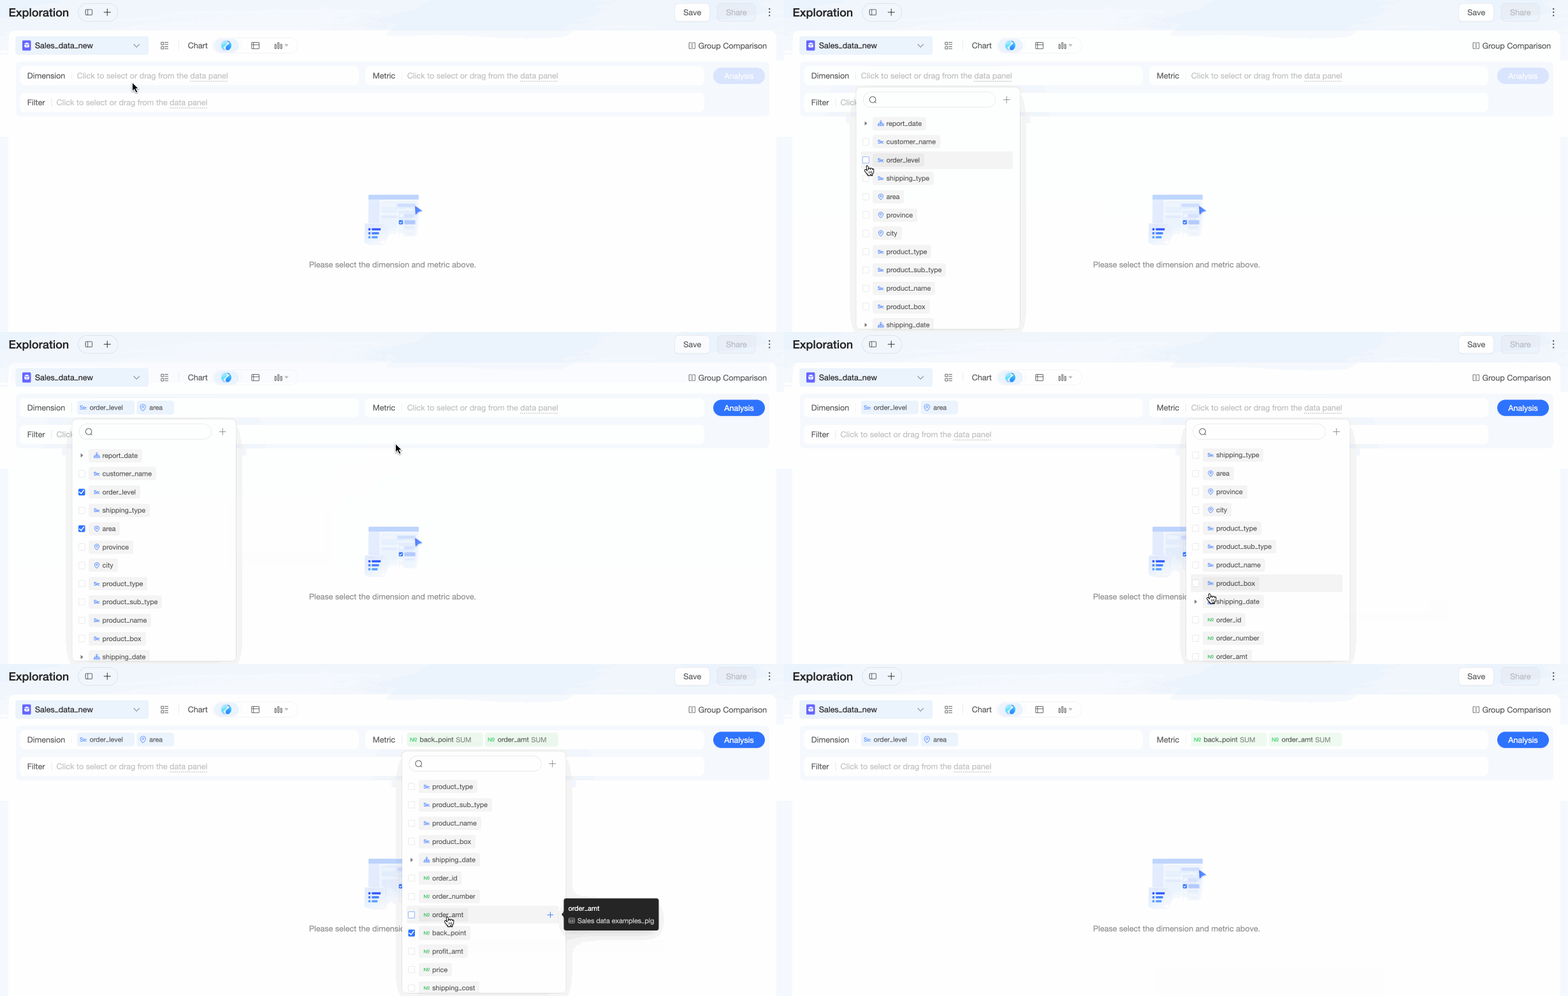
You can also click the dimension or measure areas and then select or drag fields from the drop-down list.
 icon to expand the data pane.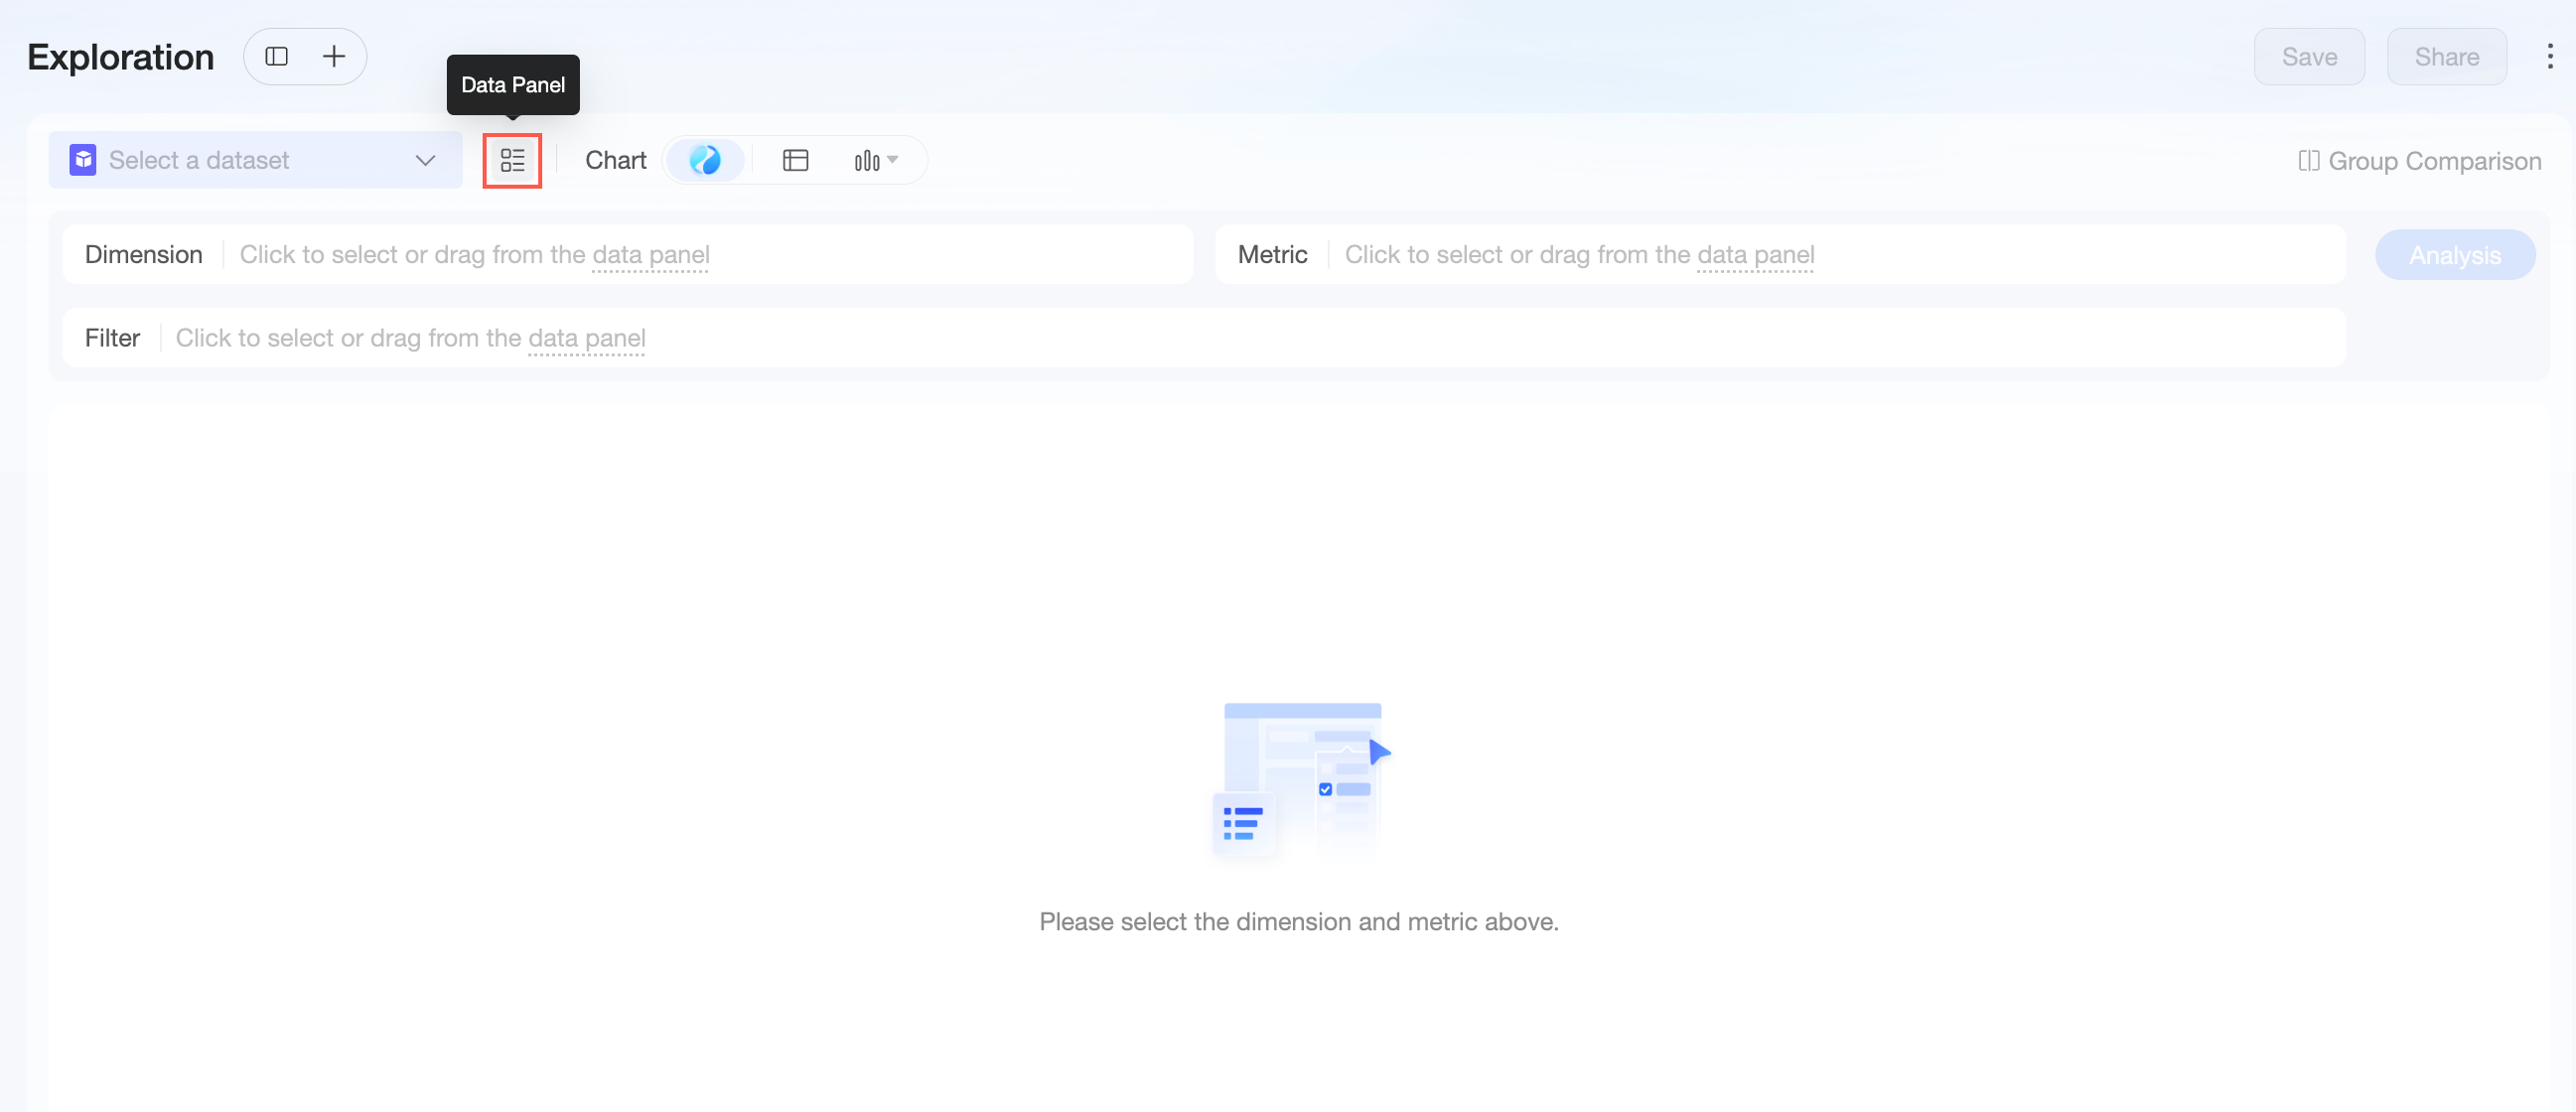
Filters
Use filters to display results that match specific conditions.
The supported query types are numeric query, date query, and text query.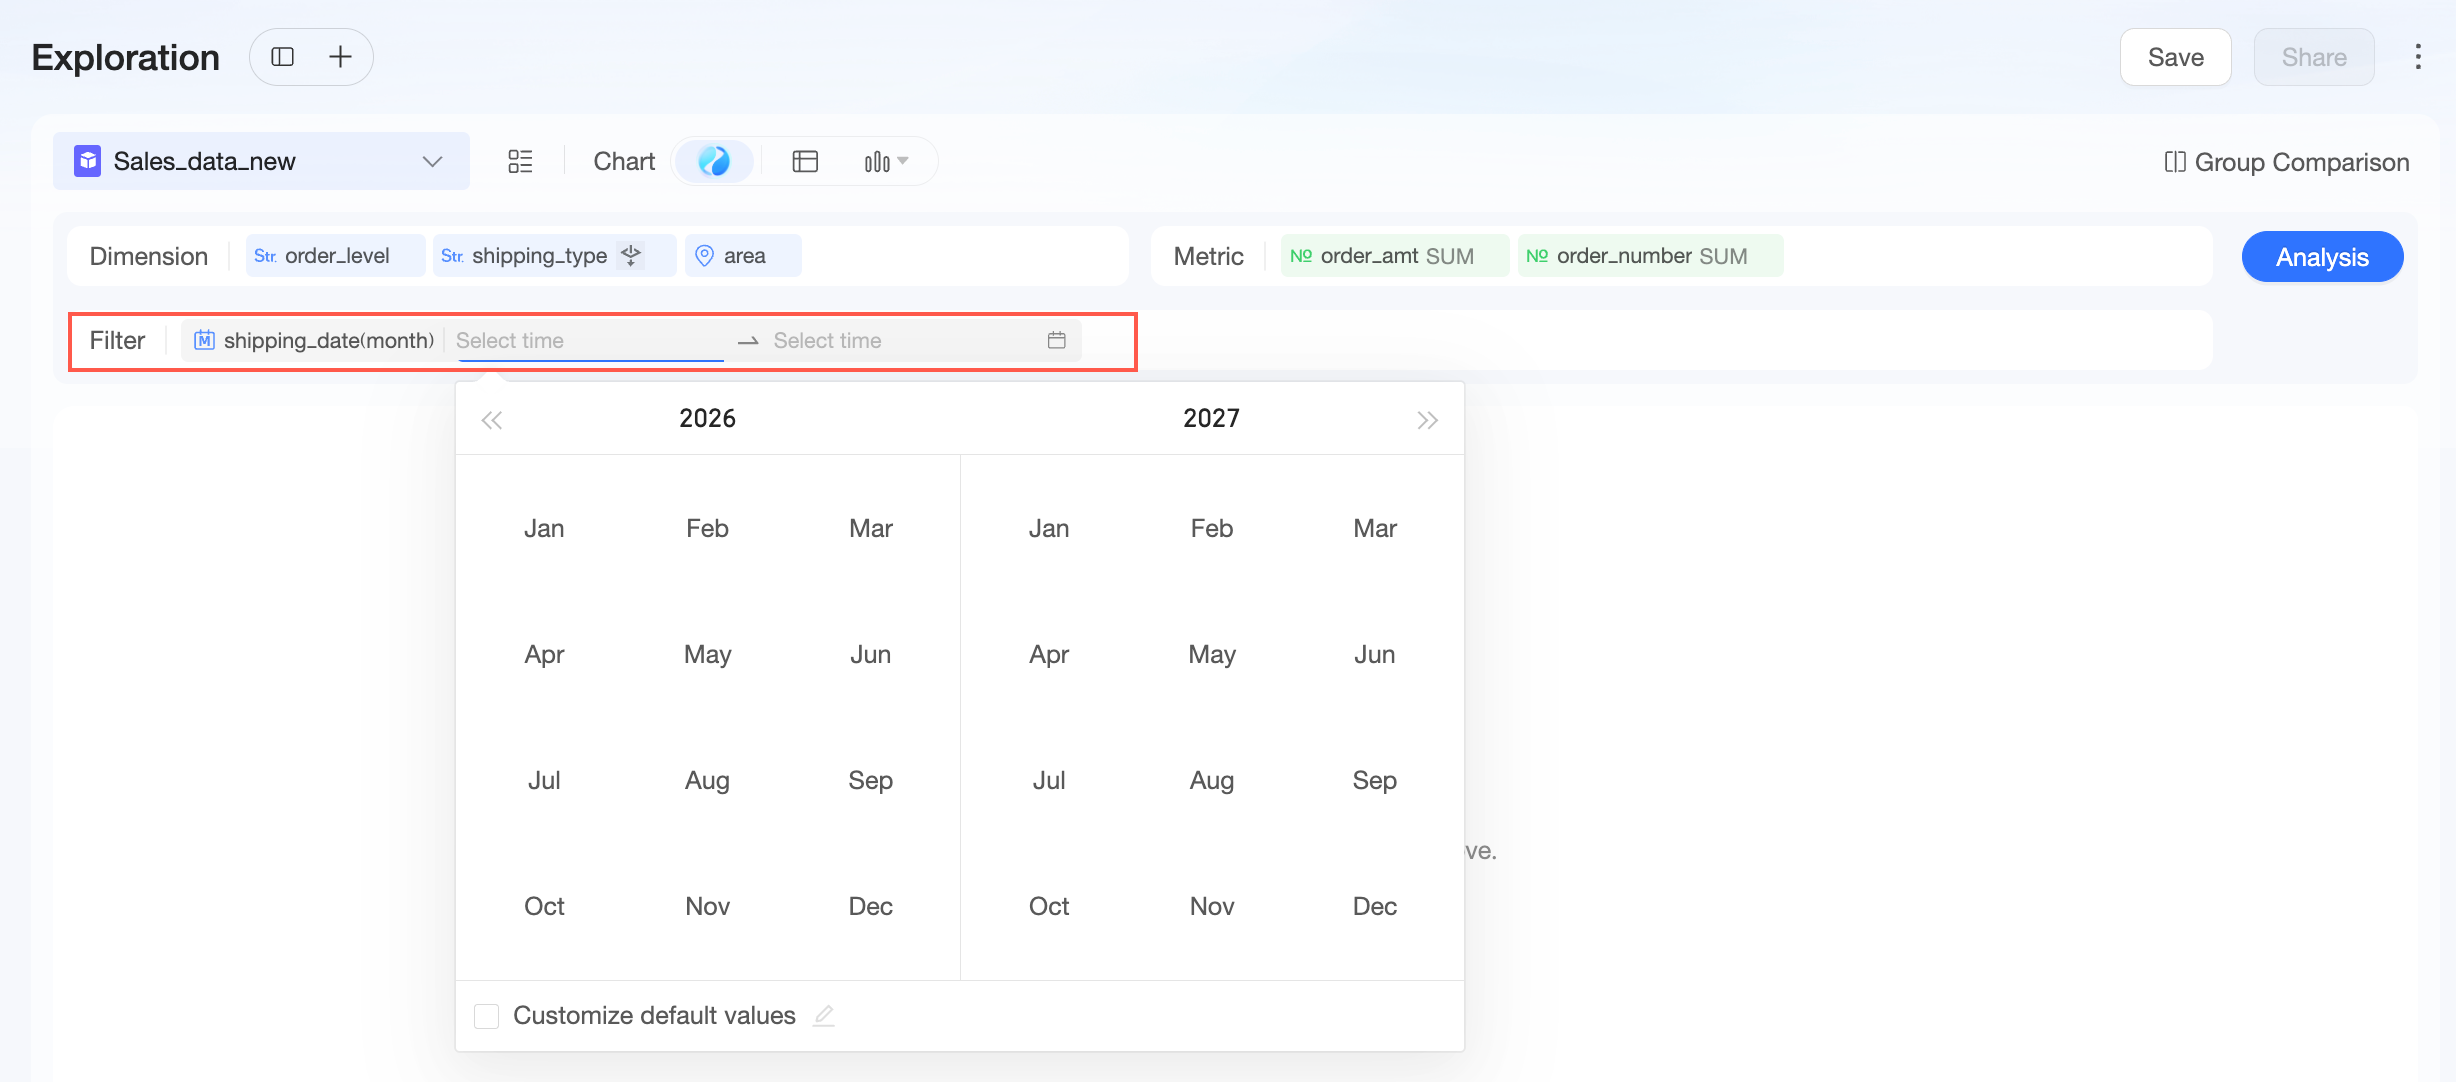
-
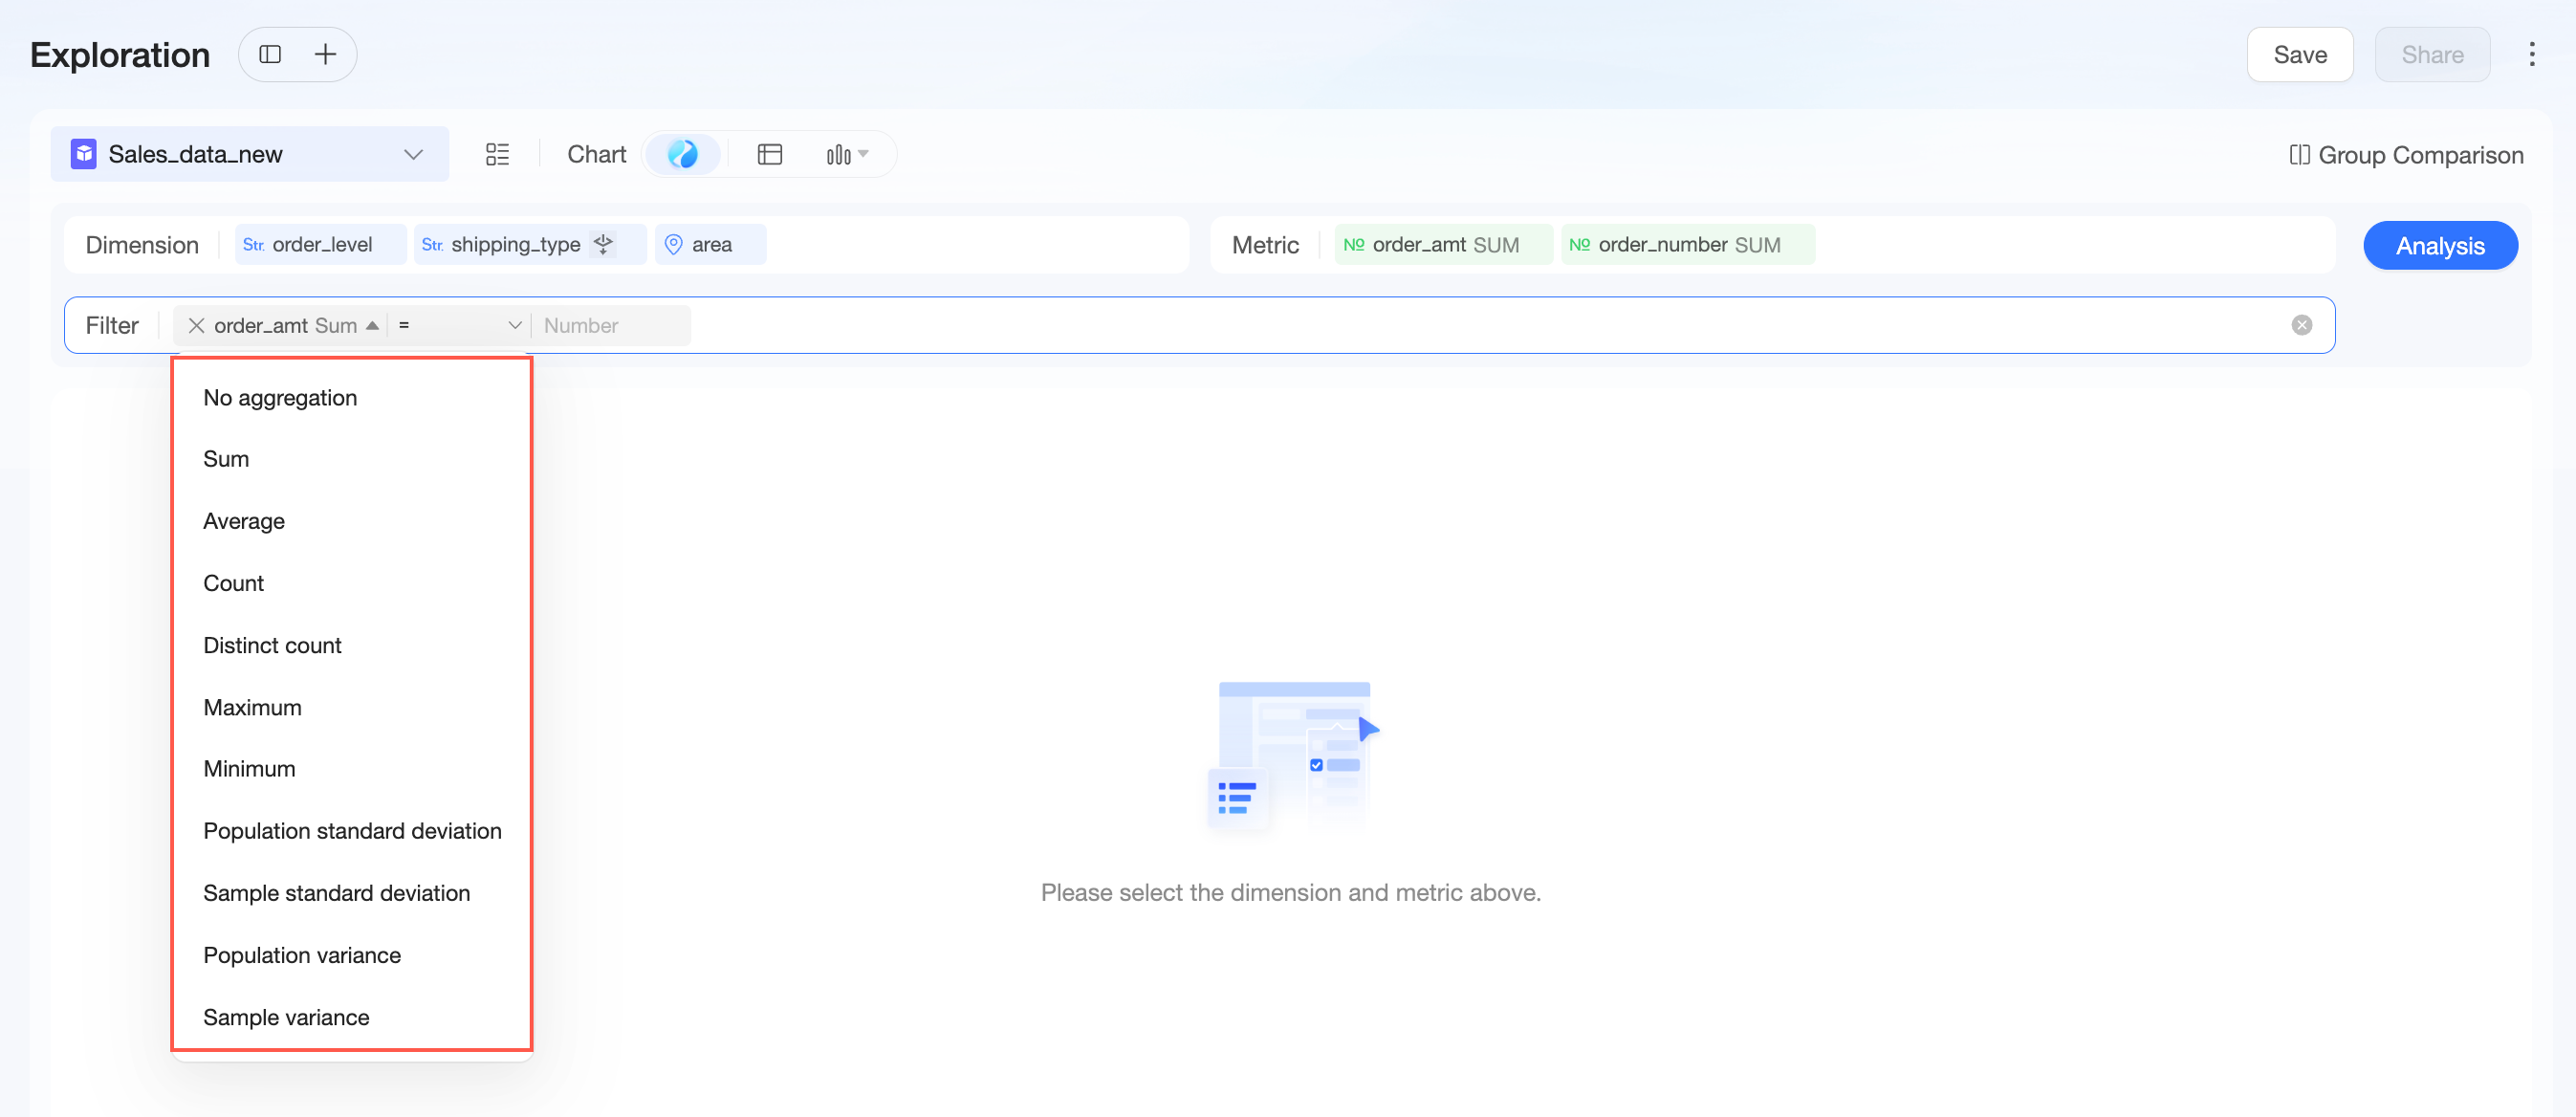
Numeric query
Numeric queries are available for numeric fields.
Supported aggregation methods include Sum, Average, Count, Distinct Count, Maximum, Minimum, Population Standard Deviation, Sample Standard Deviation, Population Variance, and Sample Variance.
-
Date query
Date queries are available for date fields.
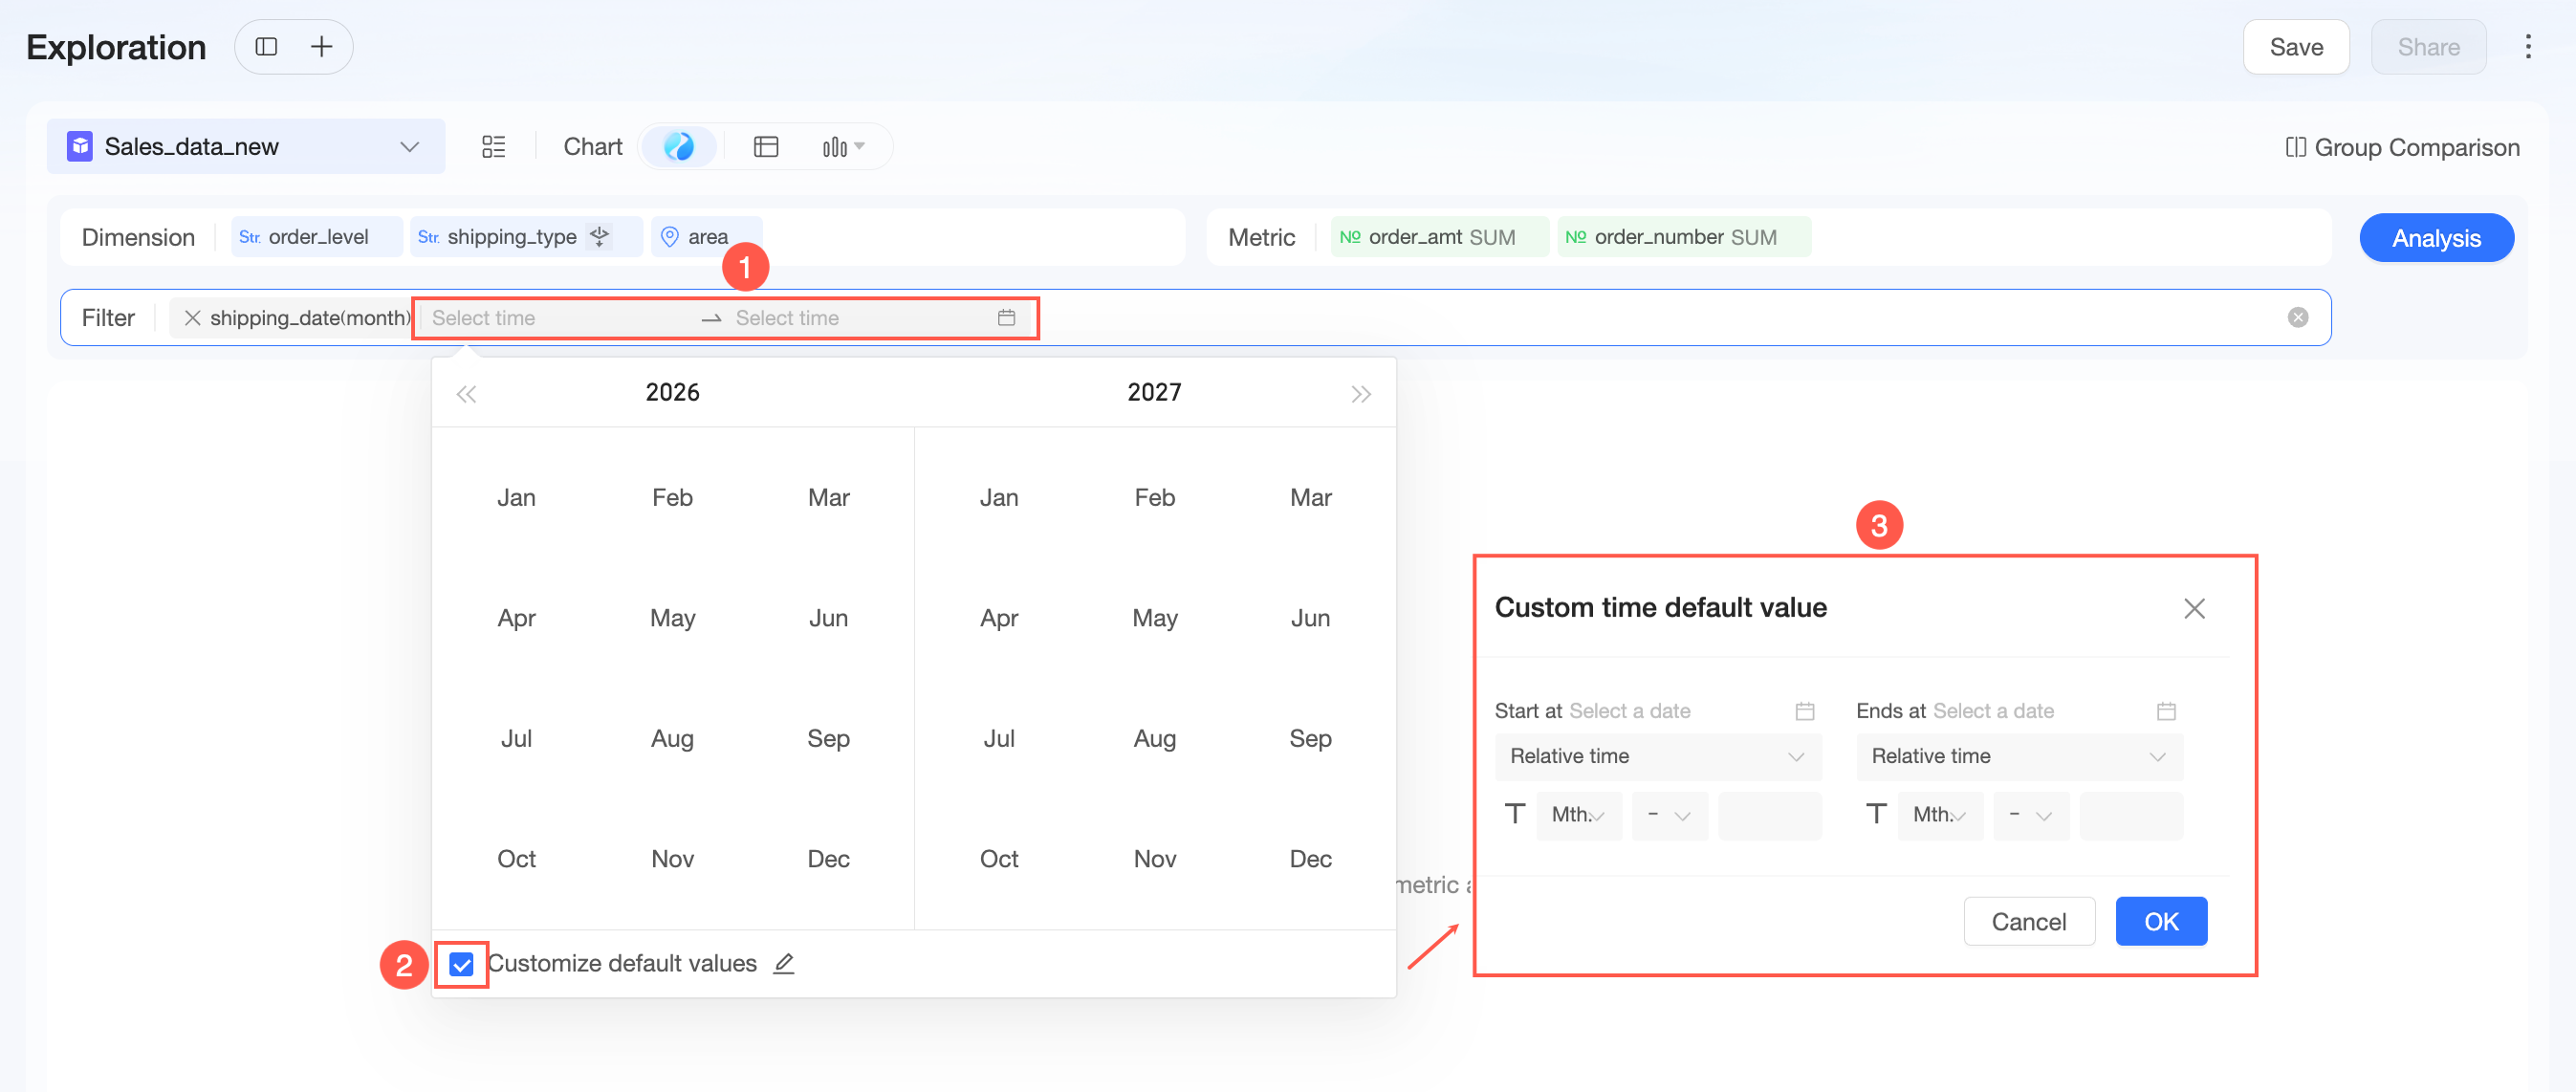
By default, a date query is a range query. You can set a custom default value. You can set a relative time or exact time for the start and end dates.
-
Text query
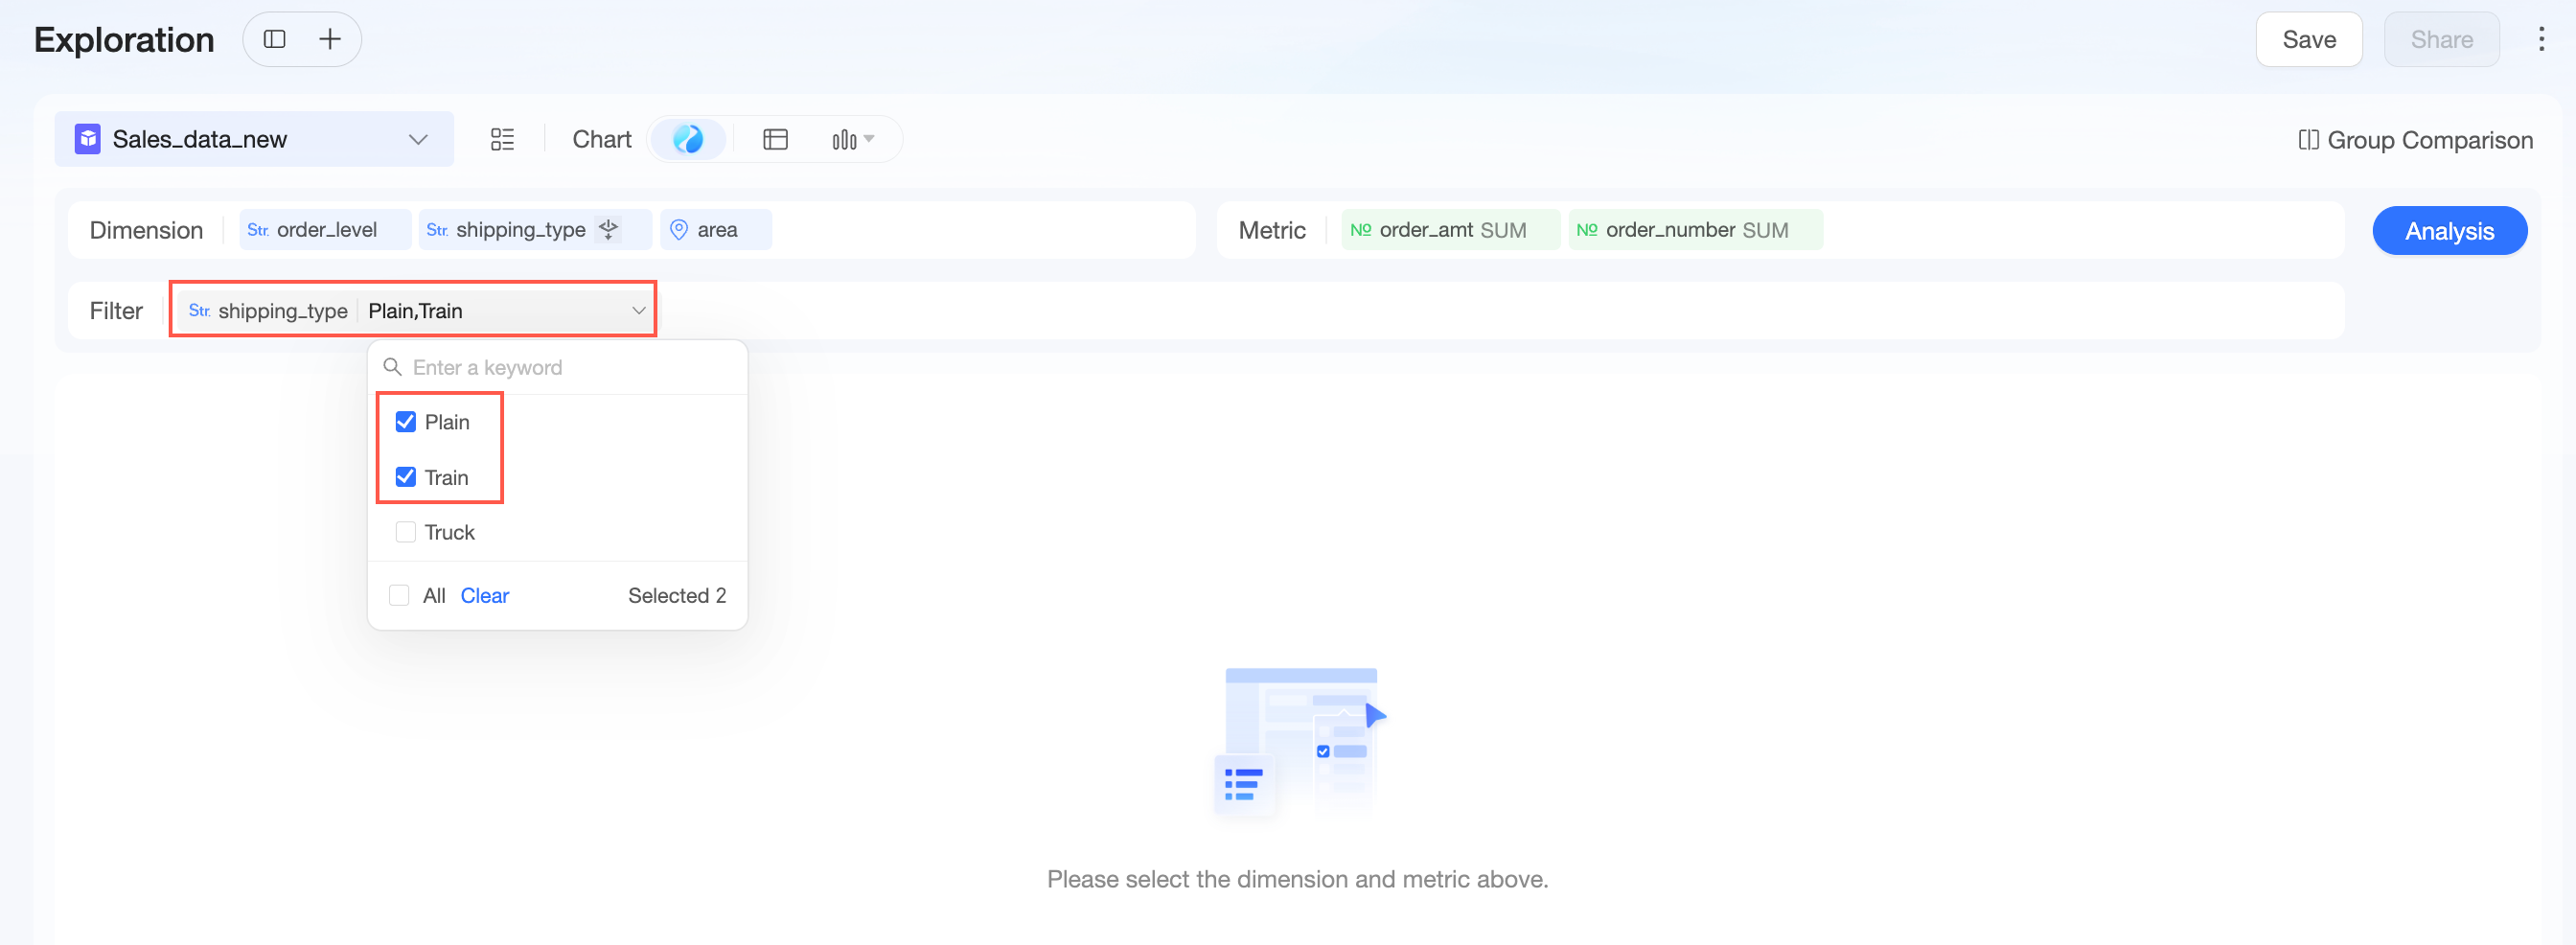
Text queries are available for text fields. Multiple selection is enabled by default.
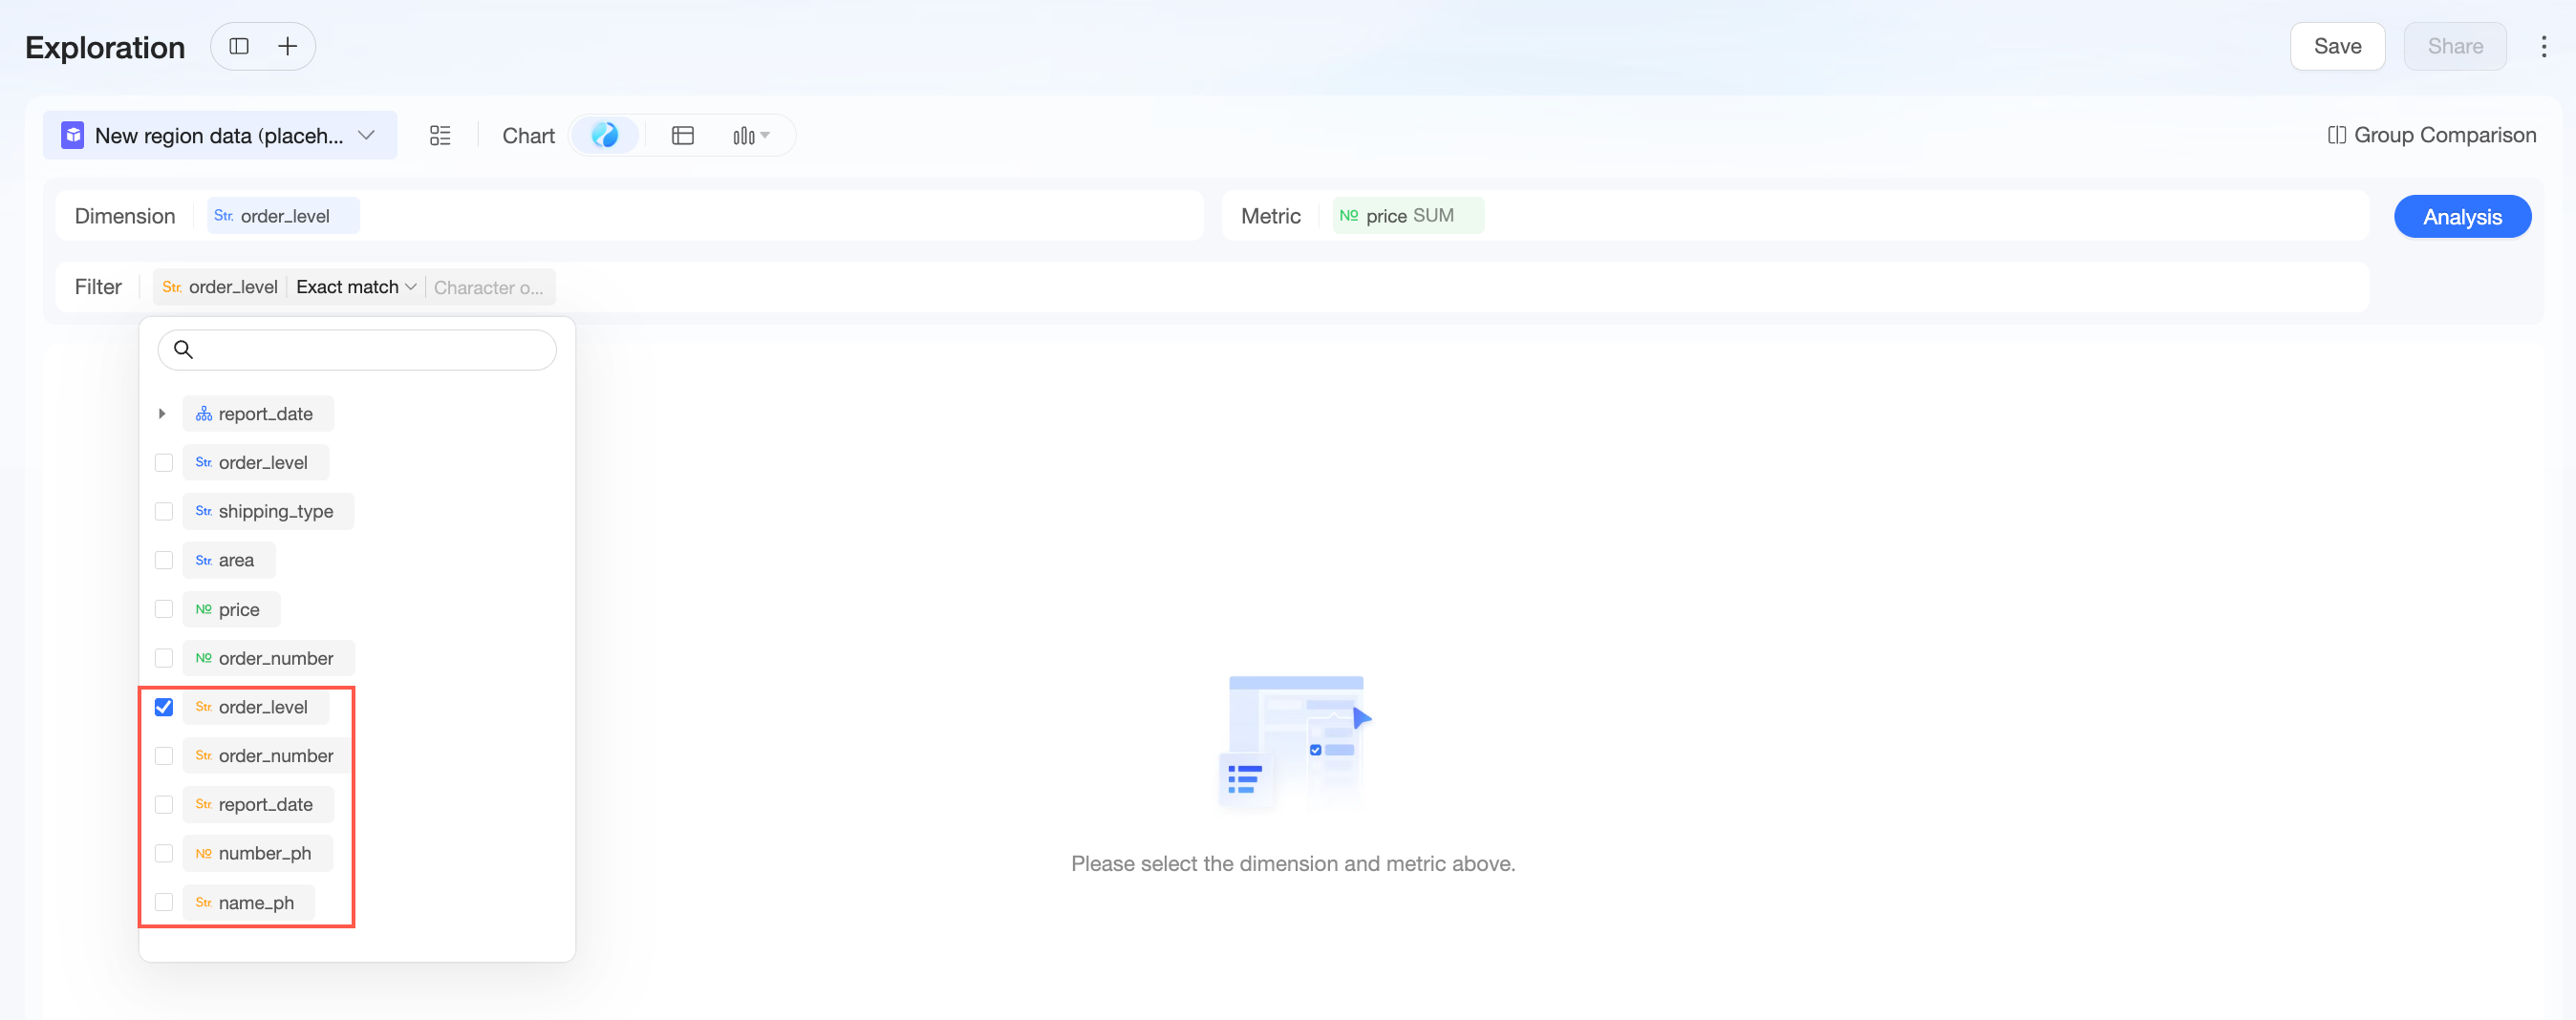
You can also use value placeholders and expression placeholders from the dataset in the filter to build more dynamic analysis conditions. For more information about how to use placeholders, see Placeholders.
Field configuration
After selecting fields, configure their settings as follows.
|
Parameter |
Description |
|
Data display format |
You can set the numeric display format for measure fields. The following formats are supported:
|
|
Aggregation method |
You can set the aggregation method for measure fields. Supported methods include Sum, Average, Count, Distinct Count, Approximate Distinct Count, Maximum, Minimum, Population Standard Deviation, Sample Standard Deviation, Population Variance, and Sample Variance. Note
The approximate distinct count feature is currently supported by the following data sources: MaxCompute, ClickHouse, Hive, Presto, Oracle, SQL Server, BigQuery, Impala, Vertica, SparkSQL, Hologres, AnalyticDB (ADB), Apache Doris, SelectDB, Athena, Databricks, Impala 3, Snowflake, and Redshift. |
|
Advanced calculation |
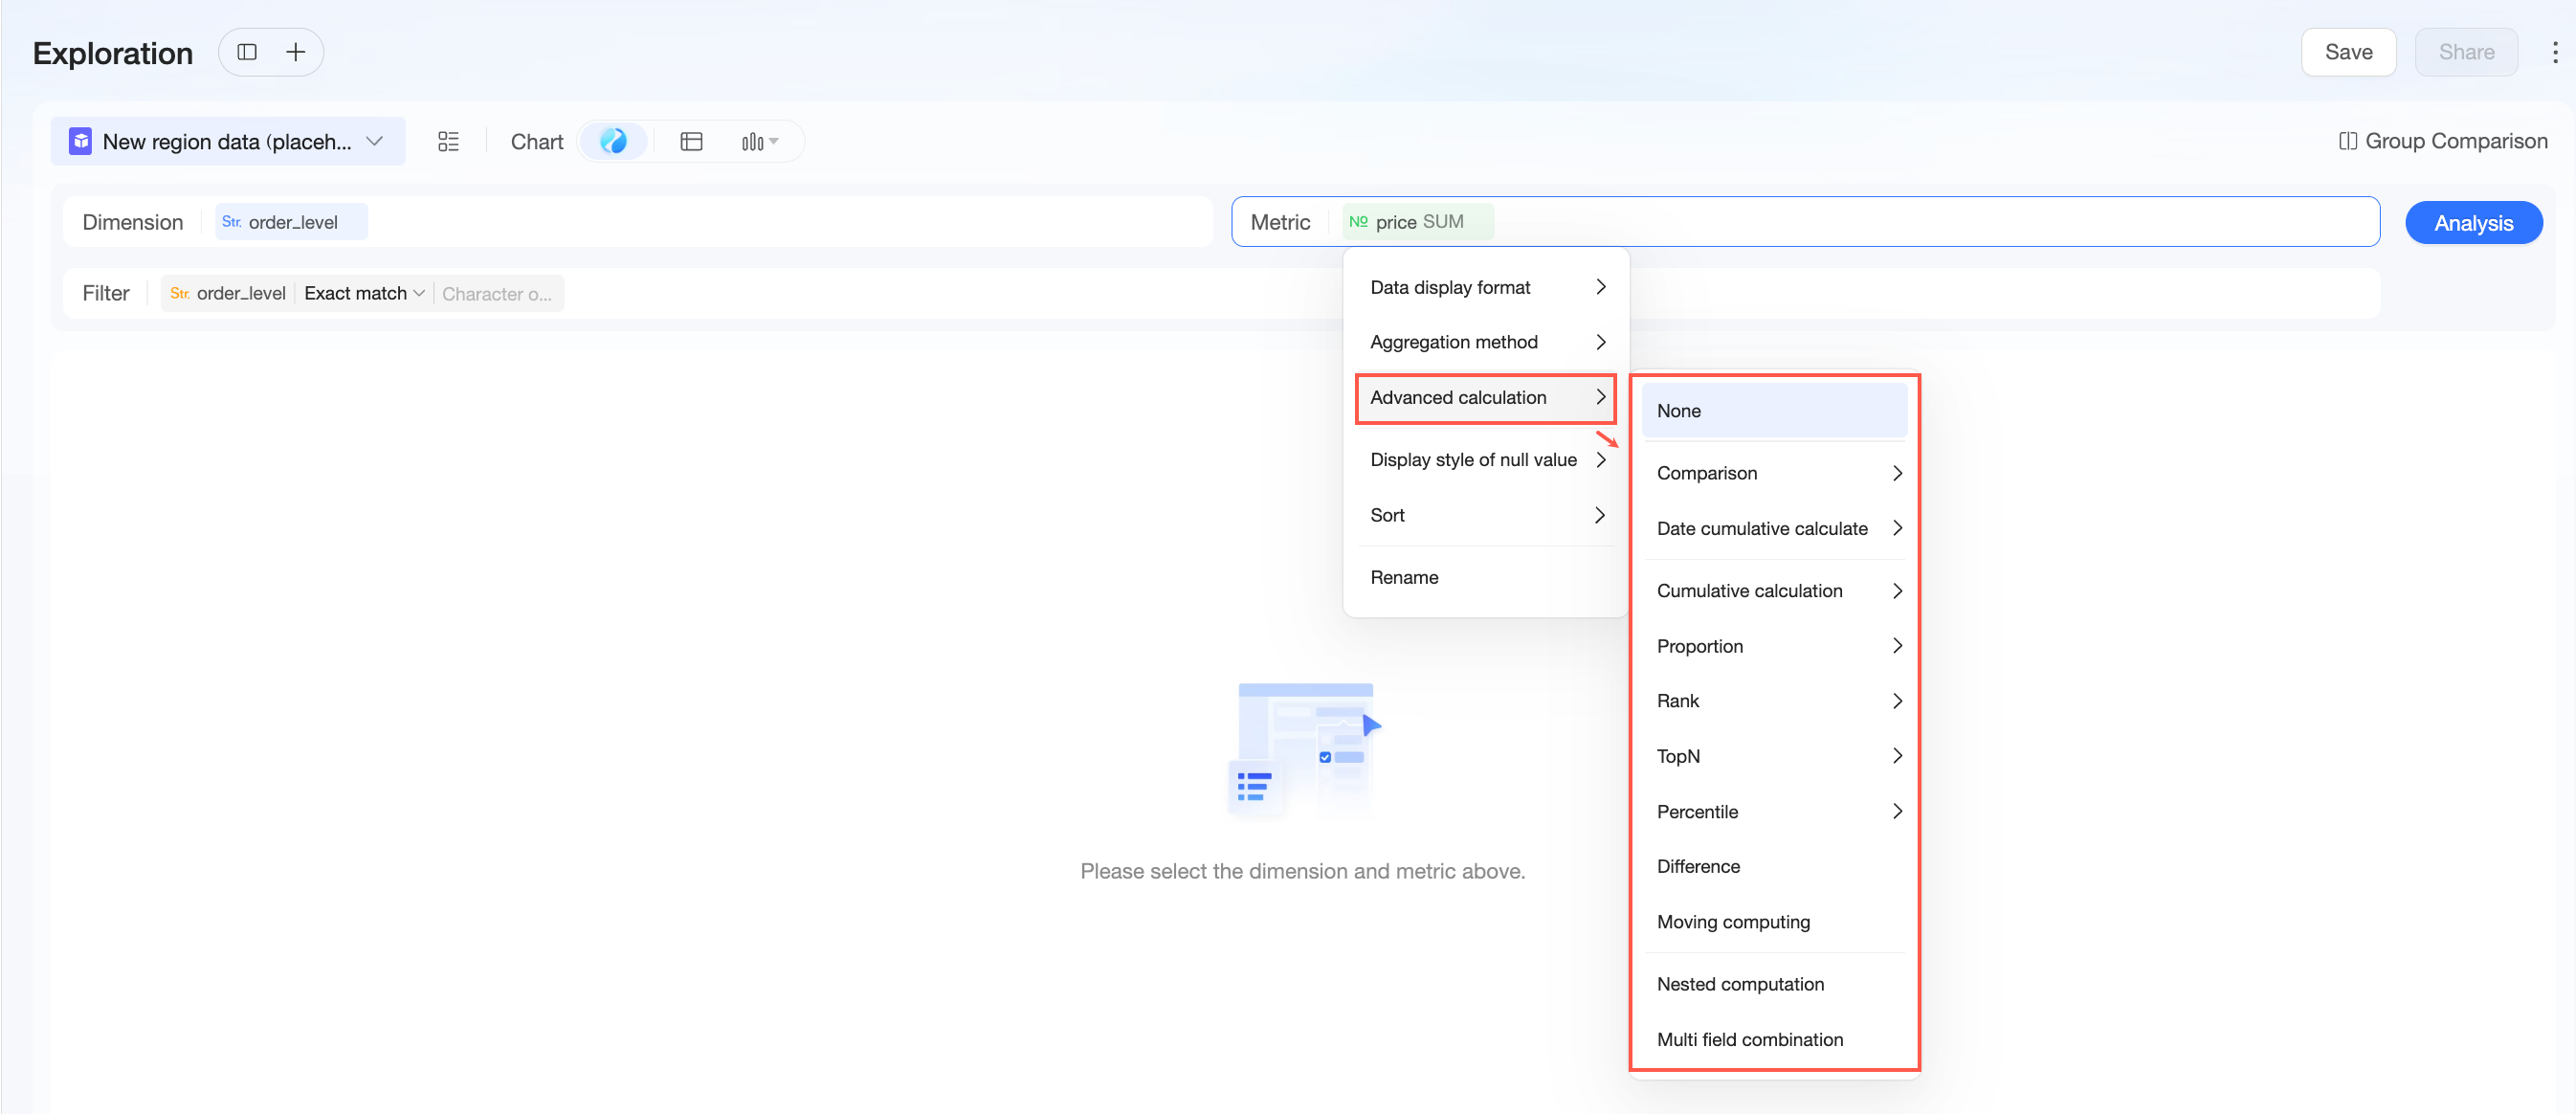
For numeric fields, supported calculations include period-over-period, date accumulation, running total, percent of total, data ranking, Top N, percentile, difference calculation, moving calculation, nested calculation, and multi-field combination. For dimension fields, single-dimension Top N is supported. For more information, see Advanced calculations.
|
|
Date display format |
You can set the display format for date fields. You can also configure a default display format for each date granularity.
|
|
Null value display style |
For dimension fields, you can set the display style for null values or empty strings.
For measure fields, you can set the display style for null values.
|
|
R***** |
You can change the display name of a field. |
|
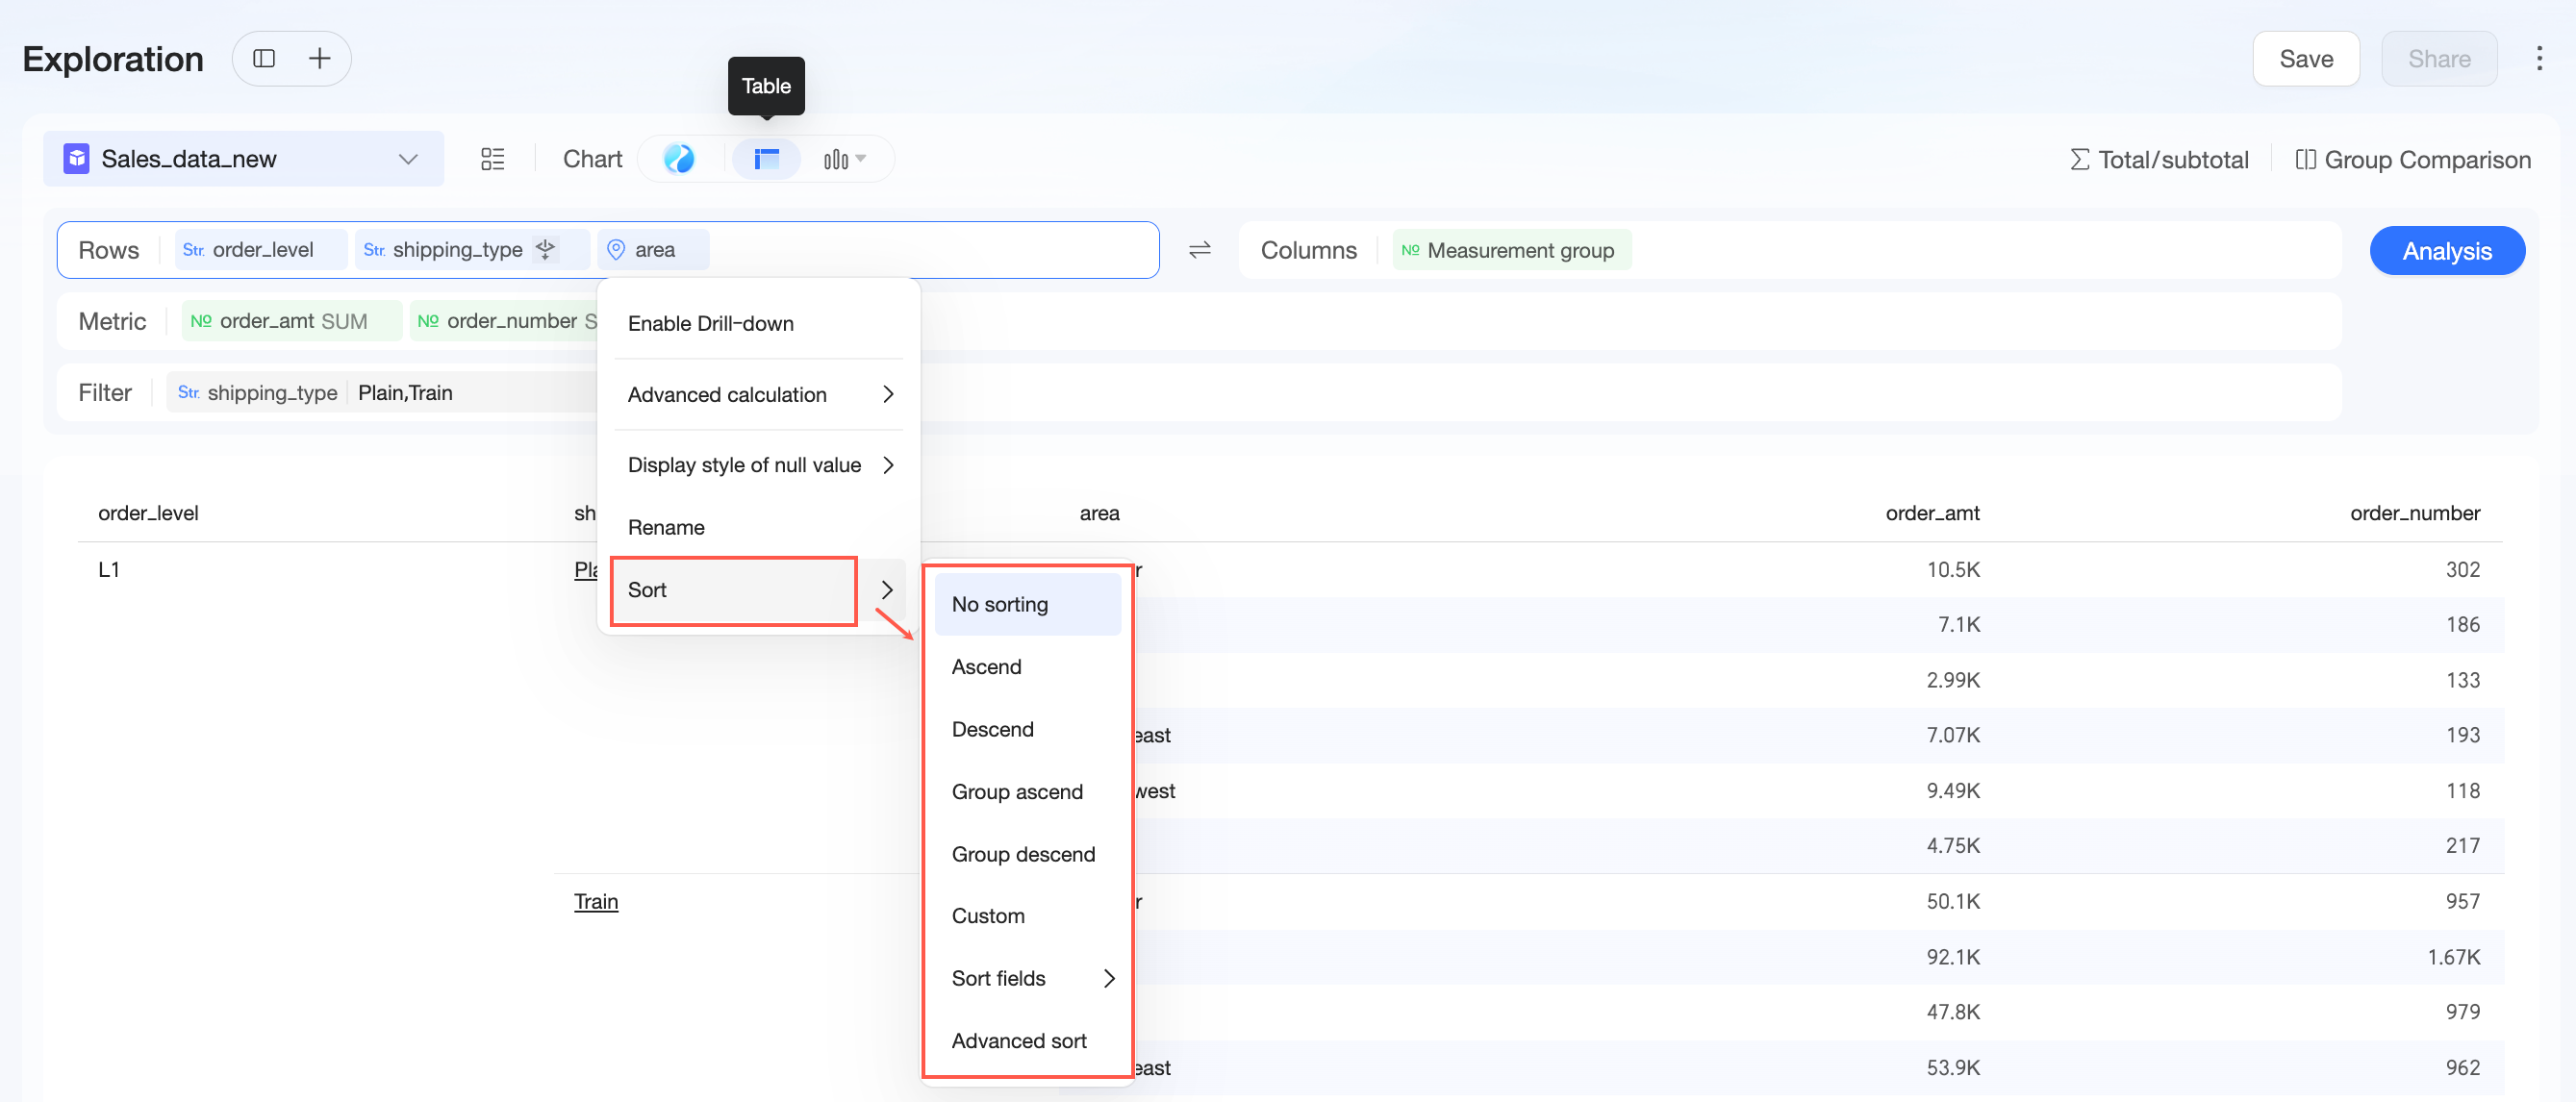
Sort |
You can set the sort method to No Sort, Ascending, Descending, Ascending in Group, Descending in Group, Advanced Sort, Custom Sort, or Field Sort.
Note
Custom Sort and Field Sort are supported only for dimension fields. |
Create a calculated field
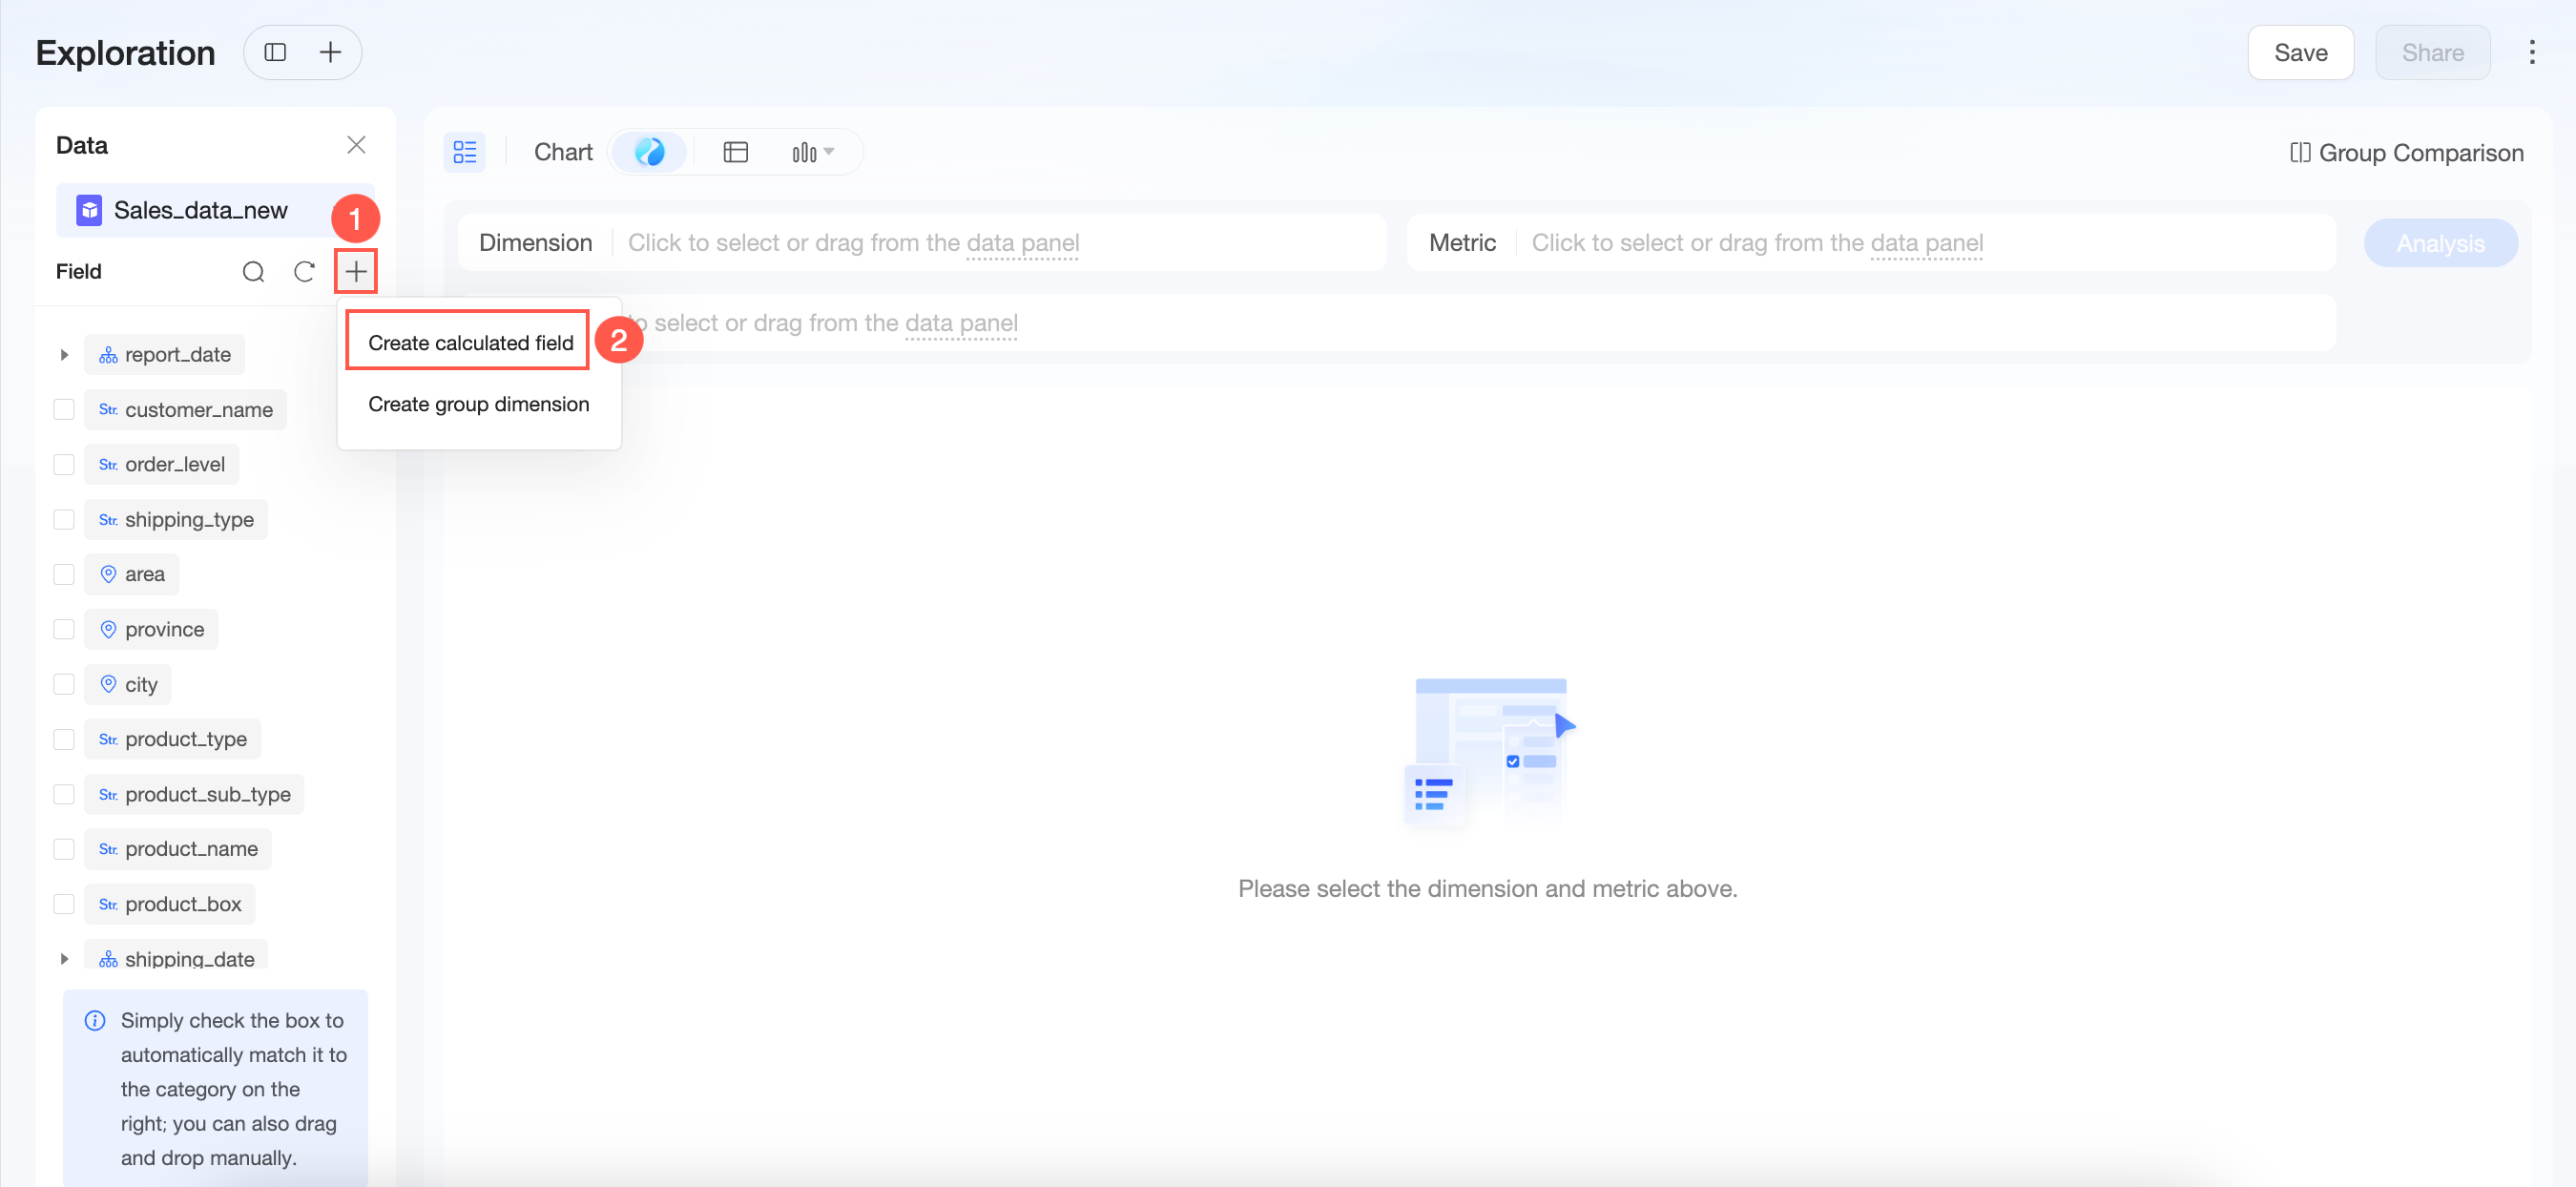
If your analysis requires data that is not directly available in the source table, create a calculated field.
-
You can create a calculated field from the data pane.
-
You can also create a calculated field from the drop-down list in the dimension or measure area.
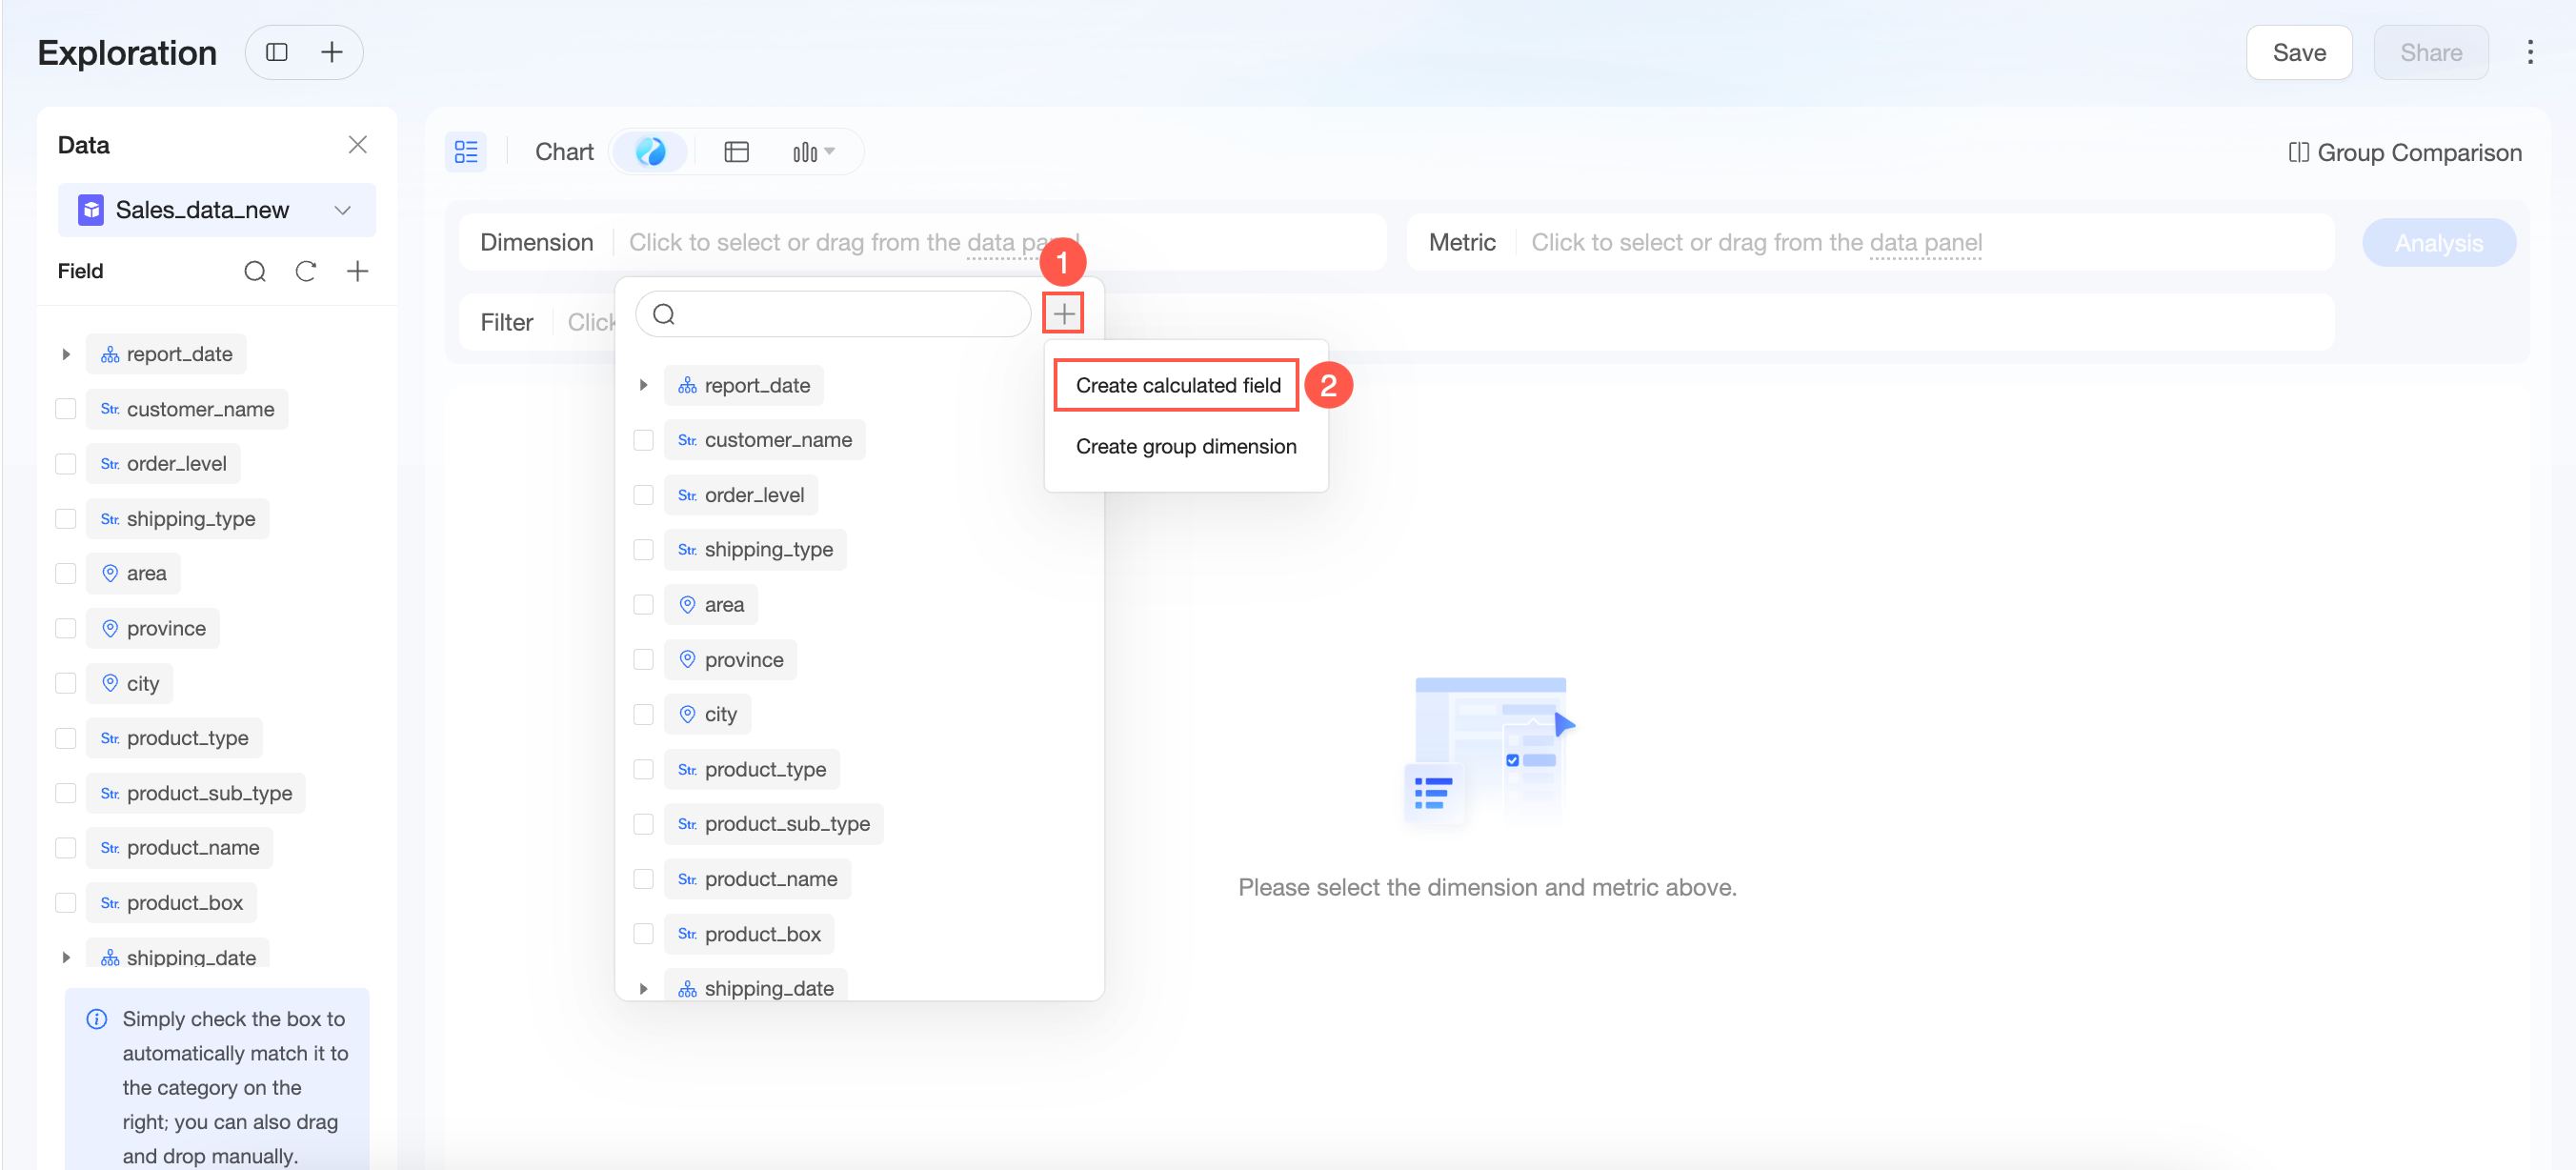
For more information, see Create a calculated field.
Create a dimension group
A dimension group groups dimension values, for example, by customer level (such as VIP or regular user), to analyze differences in spending behavior.
-
You can create a dimension group from the data pane.
-
You can also create a dimension group from the drop-down list in the dimension or measure area.
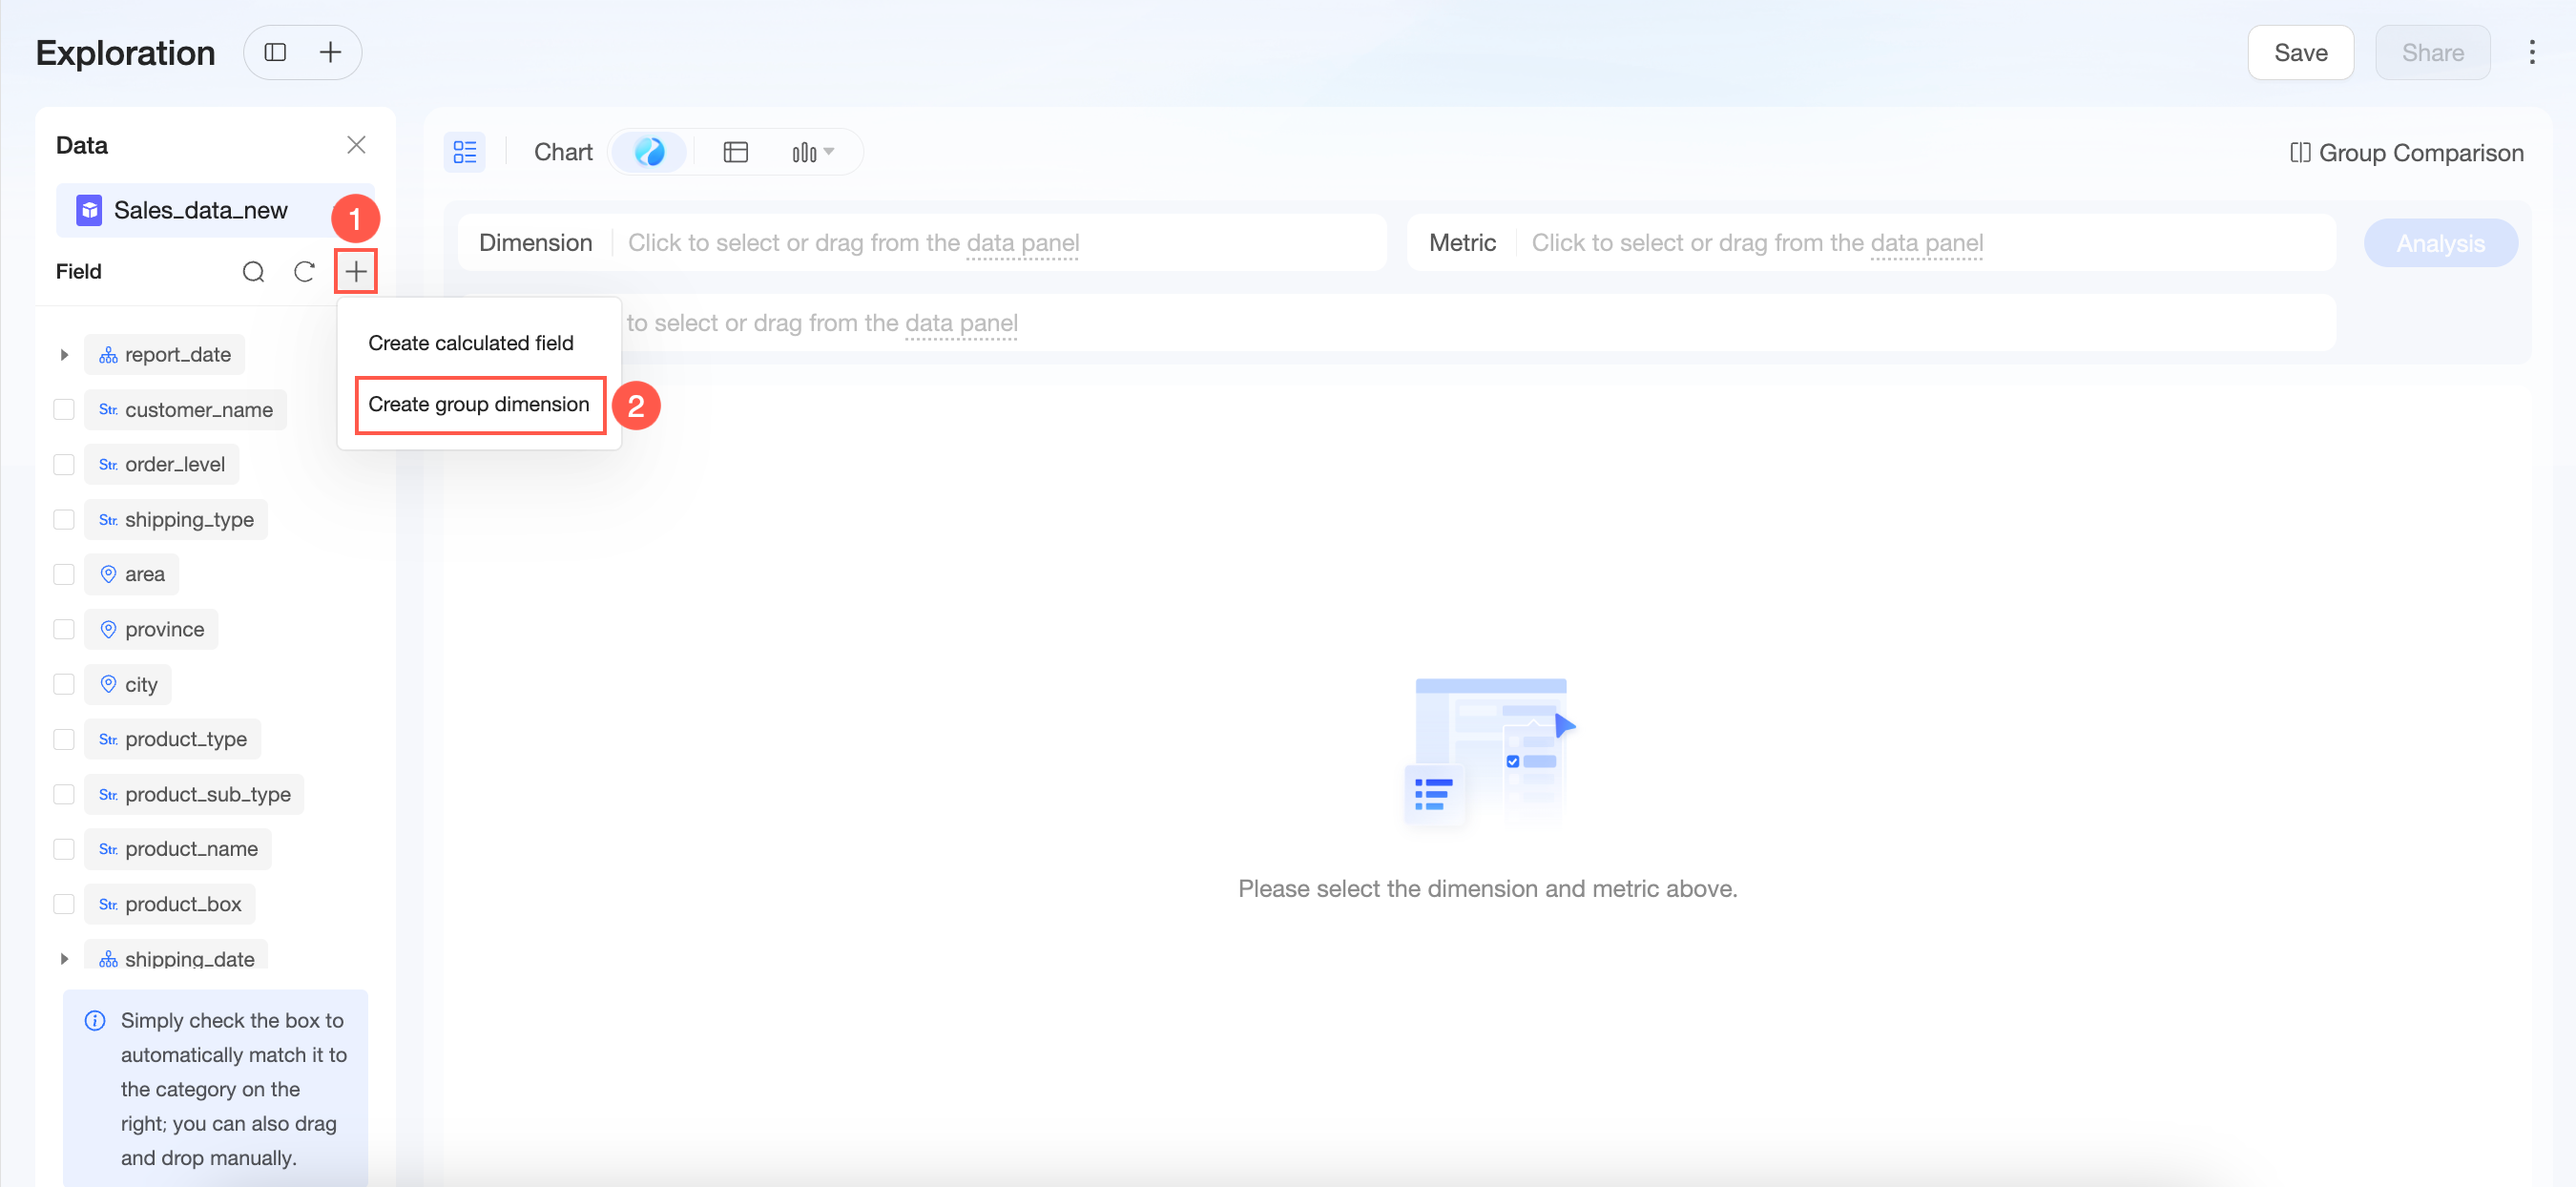
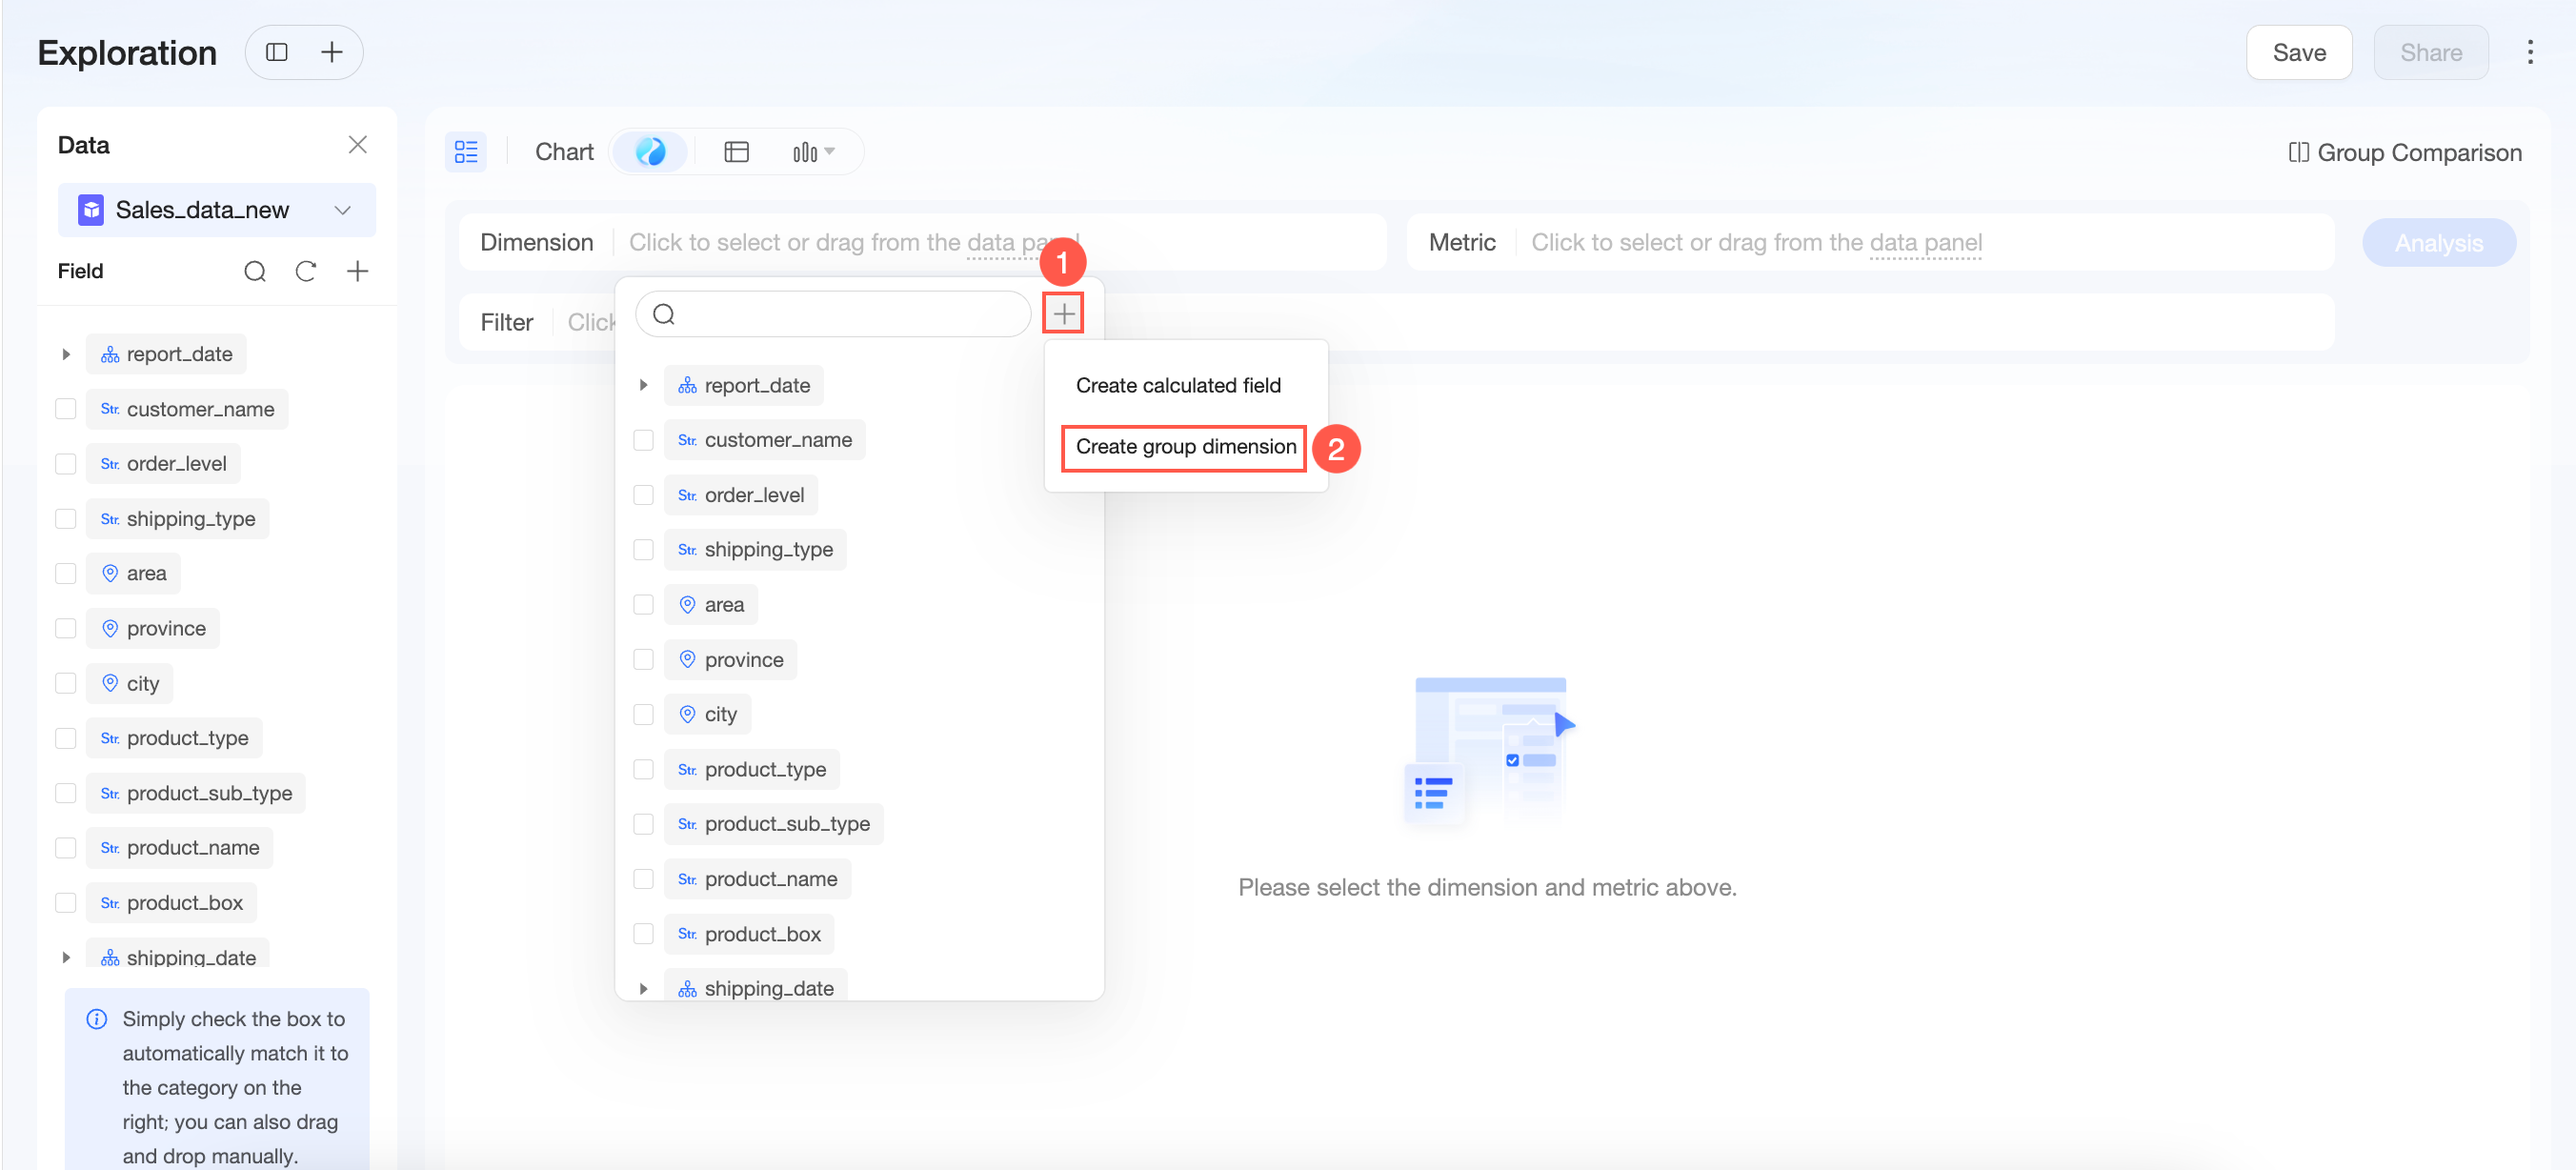
For more information, see Dimension groups.
Quick analysis
Group comparison
Each comparison group acts as a value of that dimension, enabling flexible comparative analysis across fields.
-
If the grouping field is in Rows, column grand totals are not supported. If the grouping field is in Columns, row grand totals are not supported.
-
When group comparison is enabled, the scope of advanced calculations (such as percent of total within a group and running total) is limited to each group. Cross-group calculations are not supported.
-
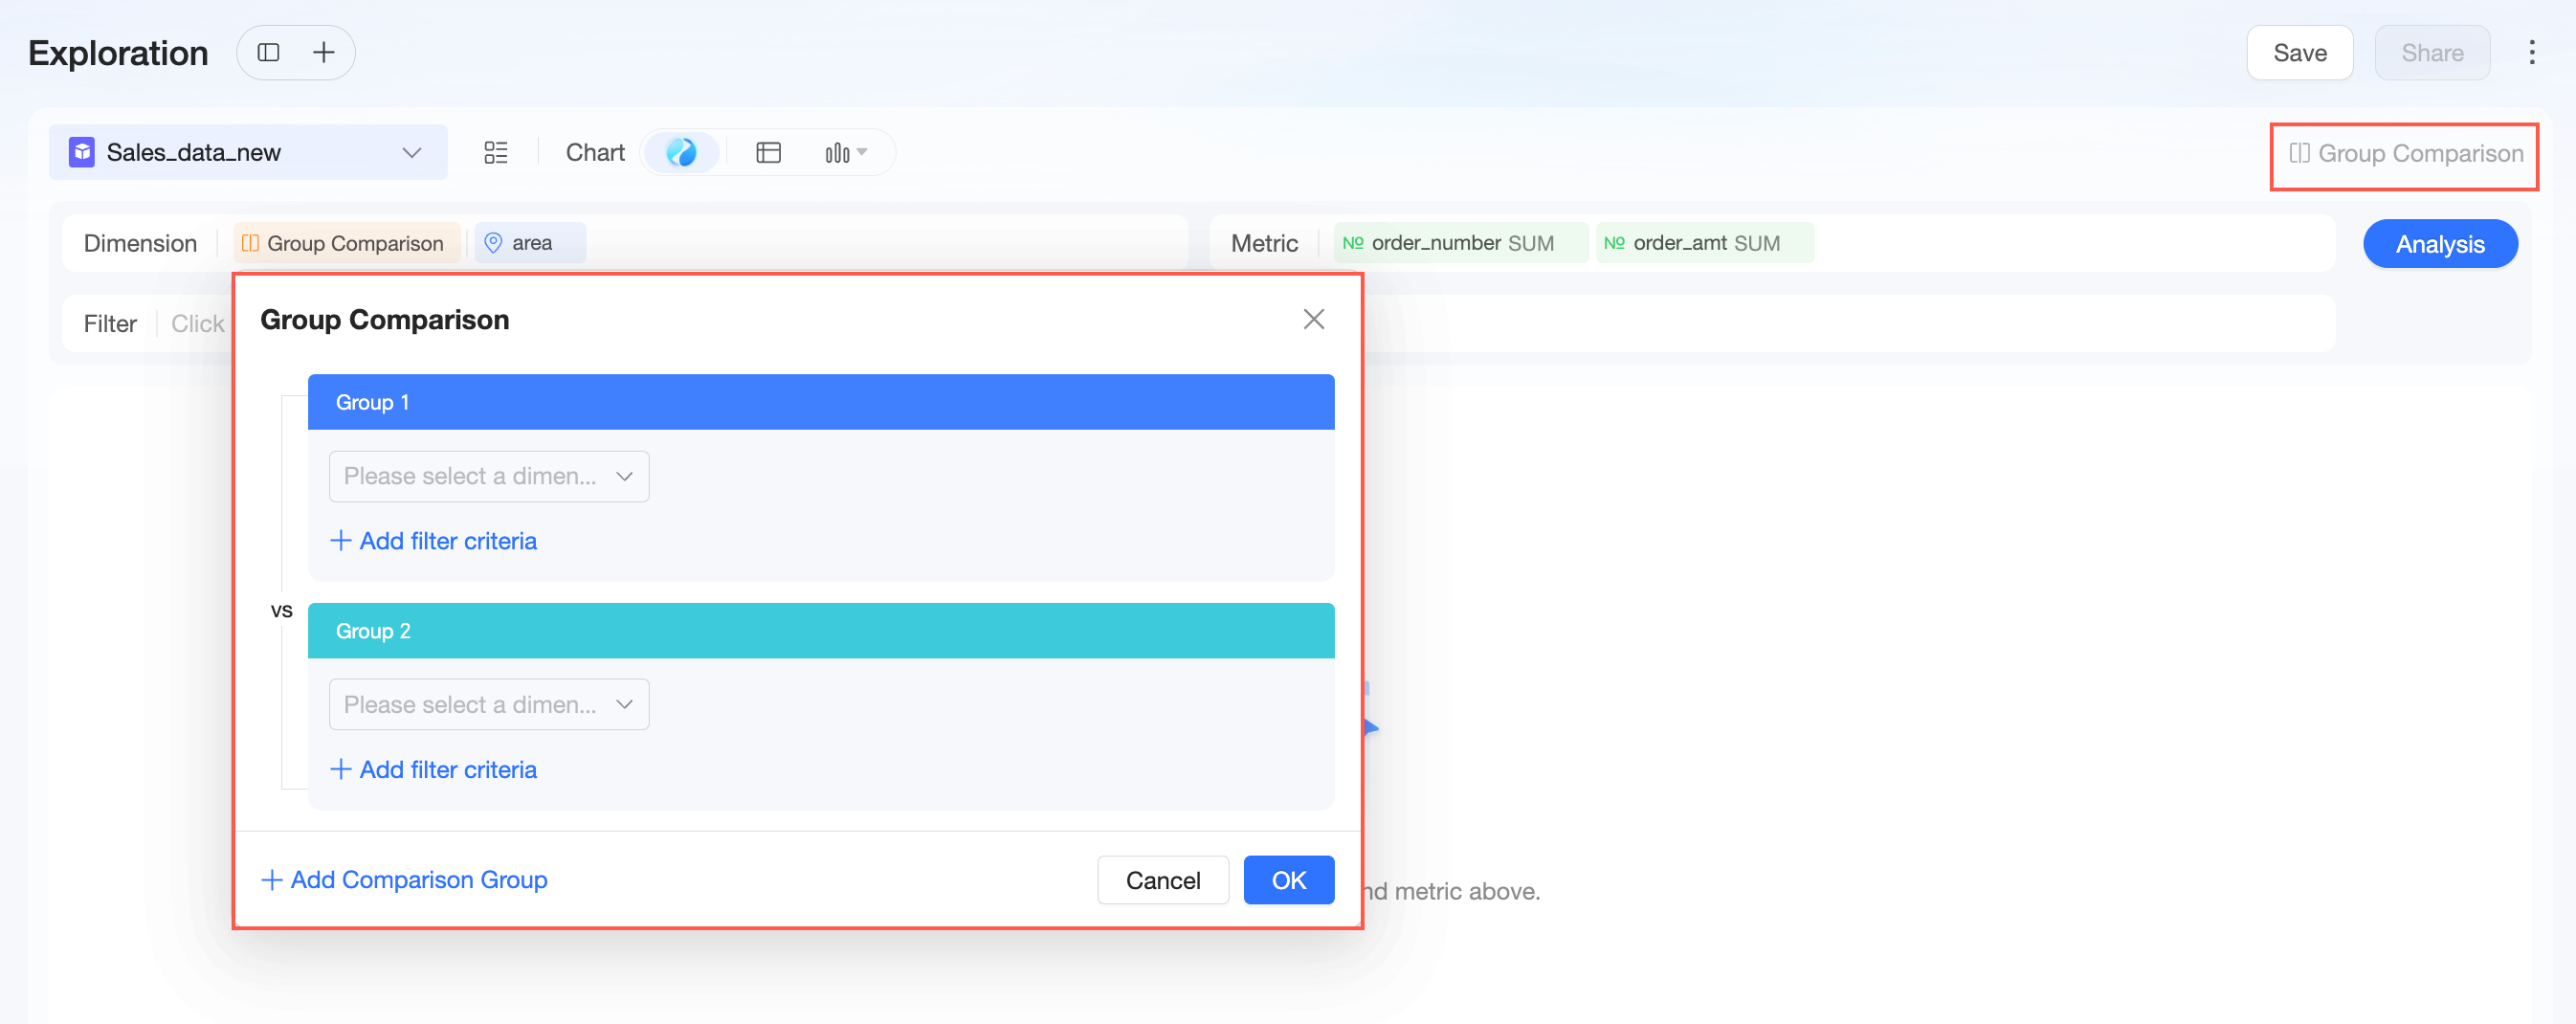
Click Group comparison to open the settings.
-
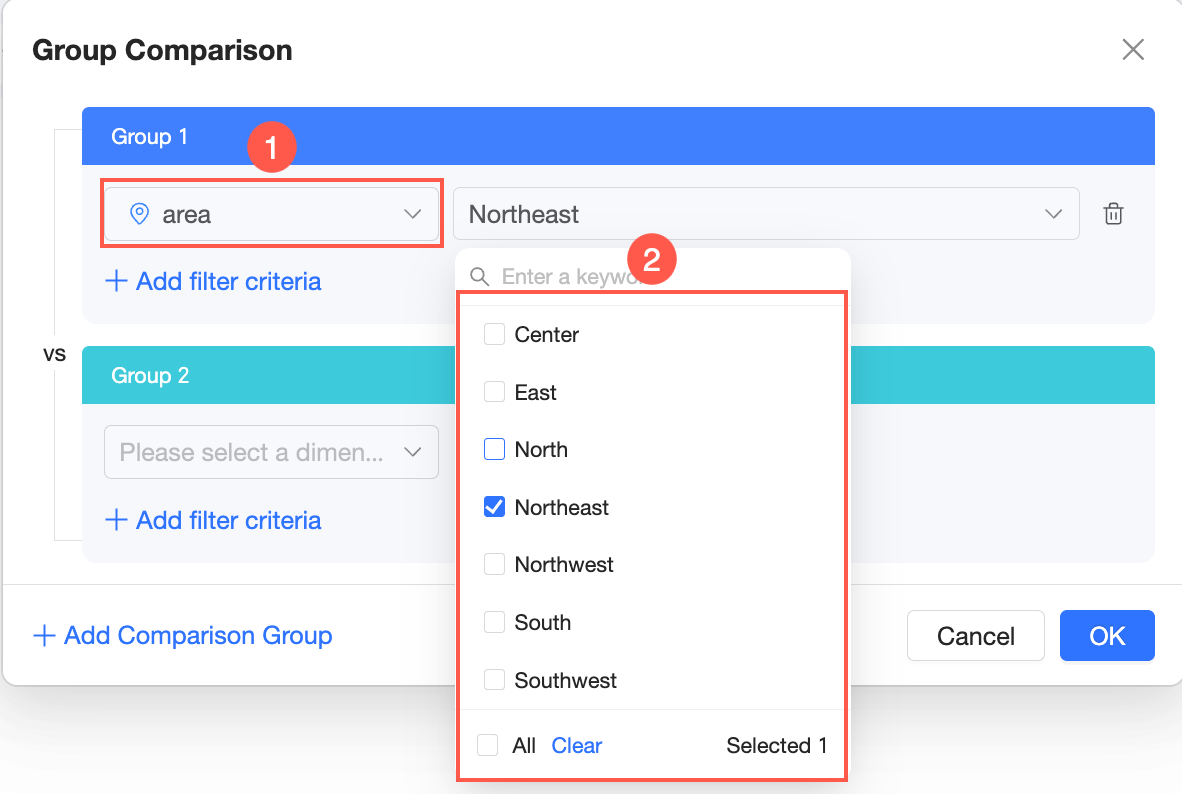
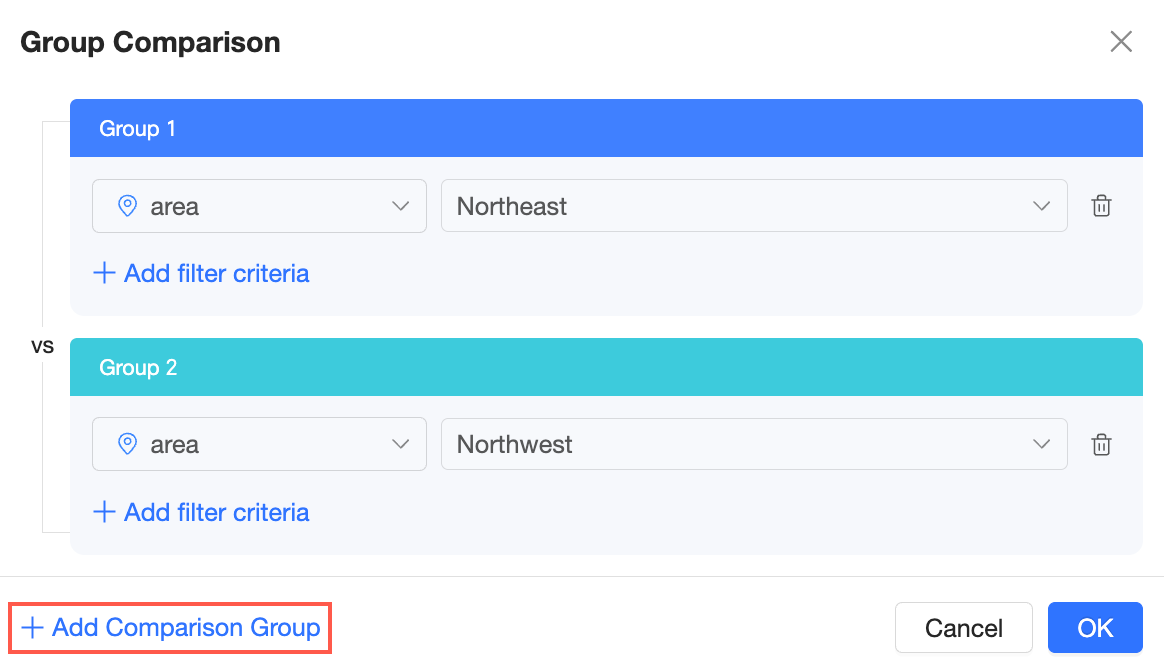
Set up the comparison groups.
-
Select a field, select the field values, and then click OK.
-
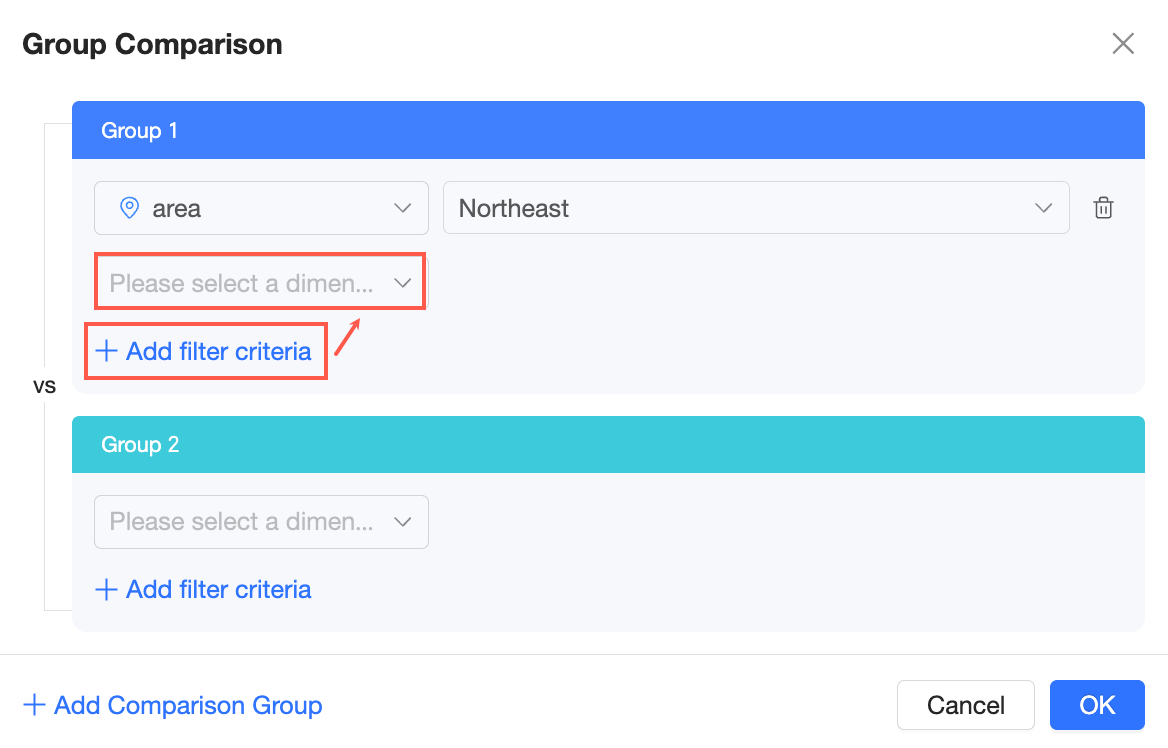
You can add filter conditions as needed.
NoteYou can also use value placeholders and expression placeholders from the dataset in the group comparison's filter conditions to build more dynamic analysis conditions. For more information about how to use placeholders, see Placeholders.
-
If you need multiple comparison groups, click Add Comparison Group.
NoteYou can add a maximum of five comparison groups.
-
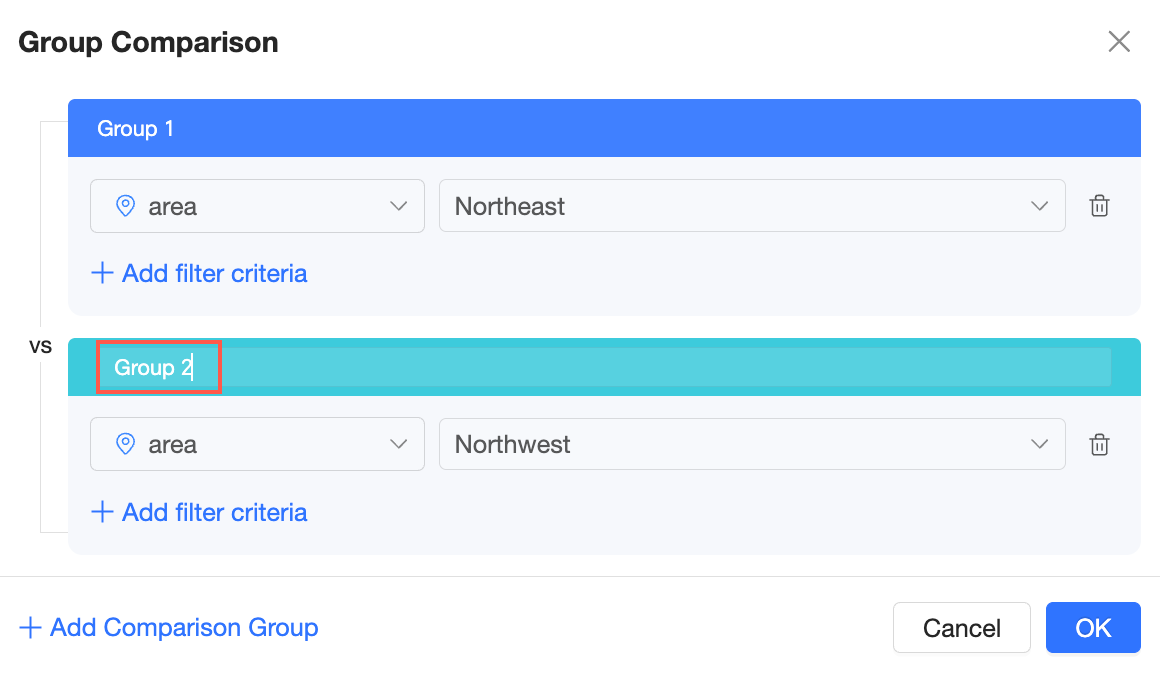
Hover over a comparison name to rename it.
-
-
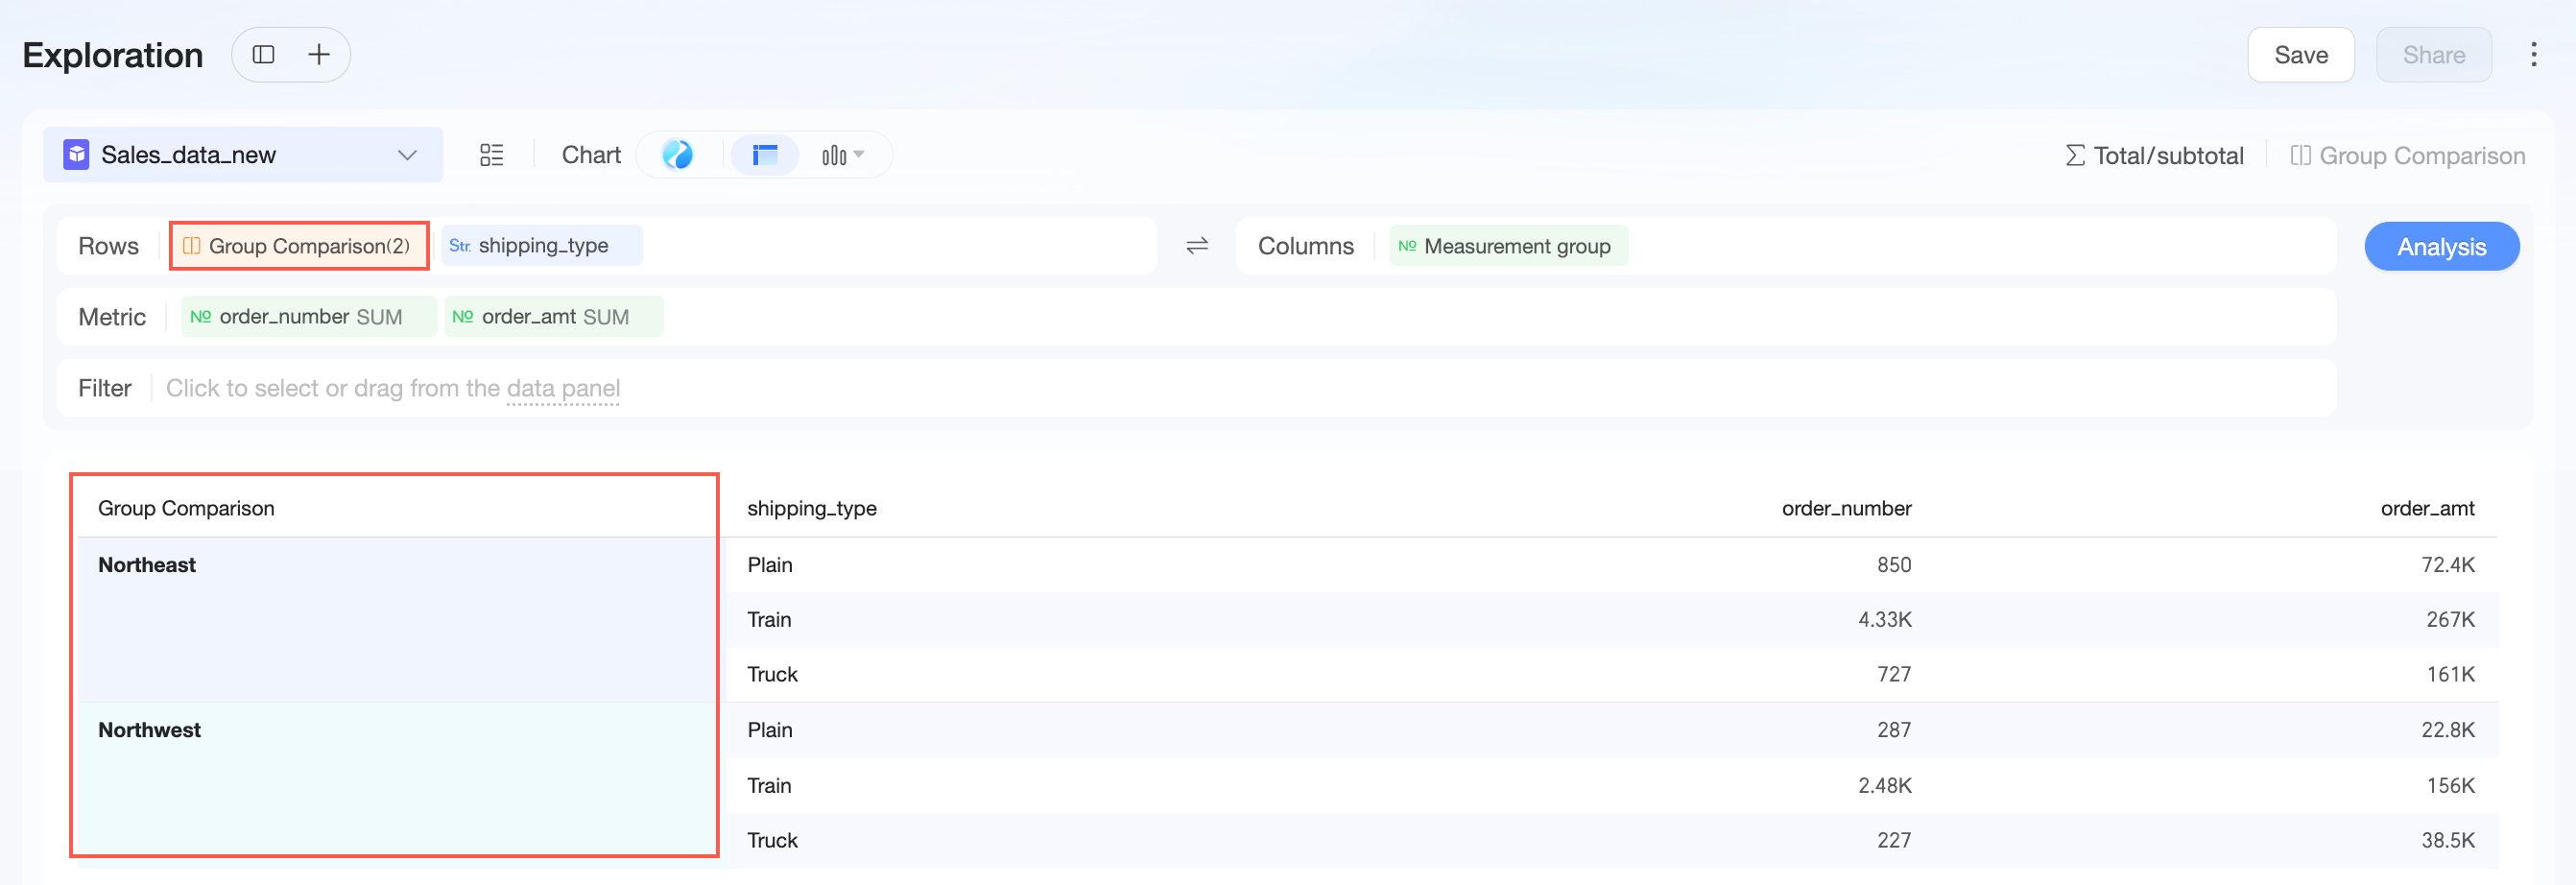
Click OK, configure other fields, and then click Generate analysis. The following figure shows a sample result.
-
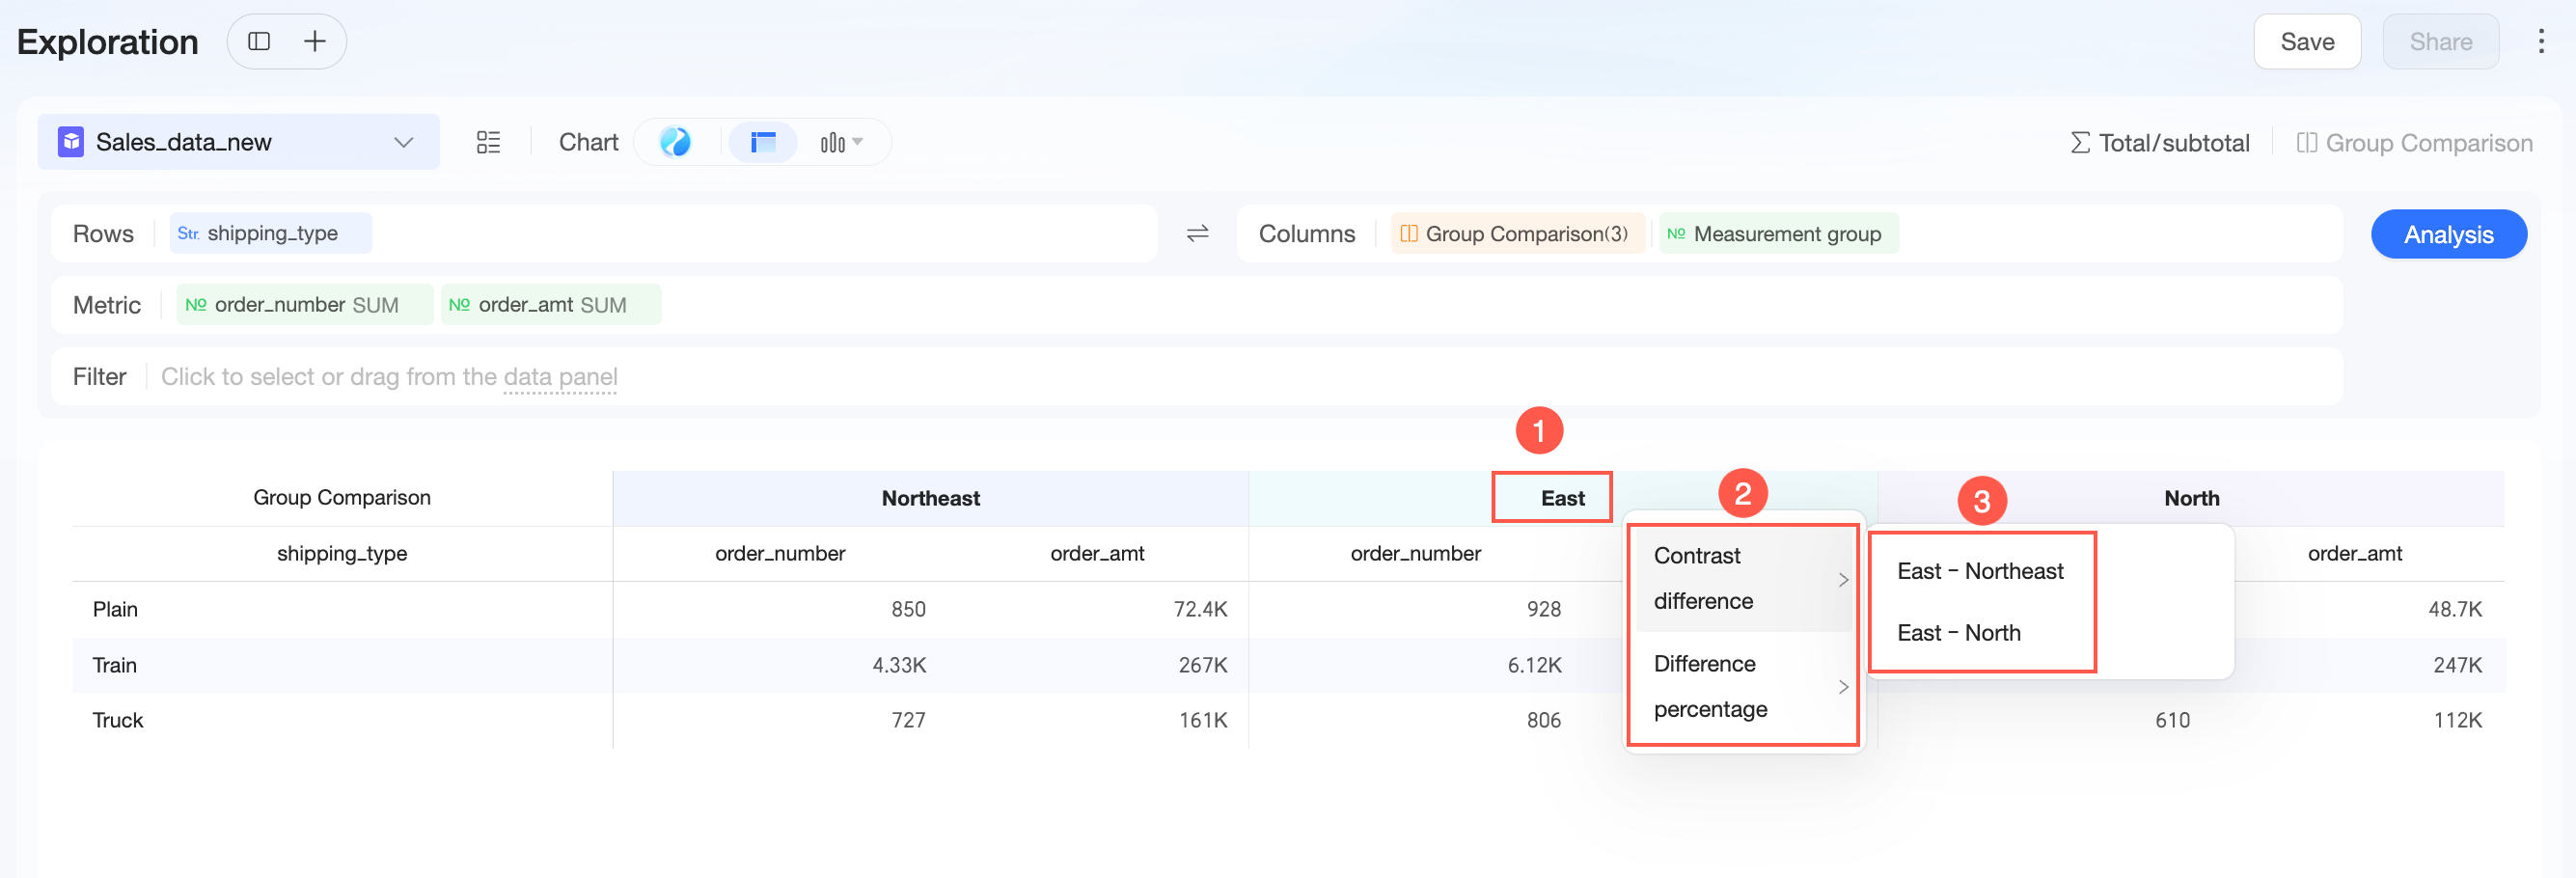
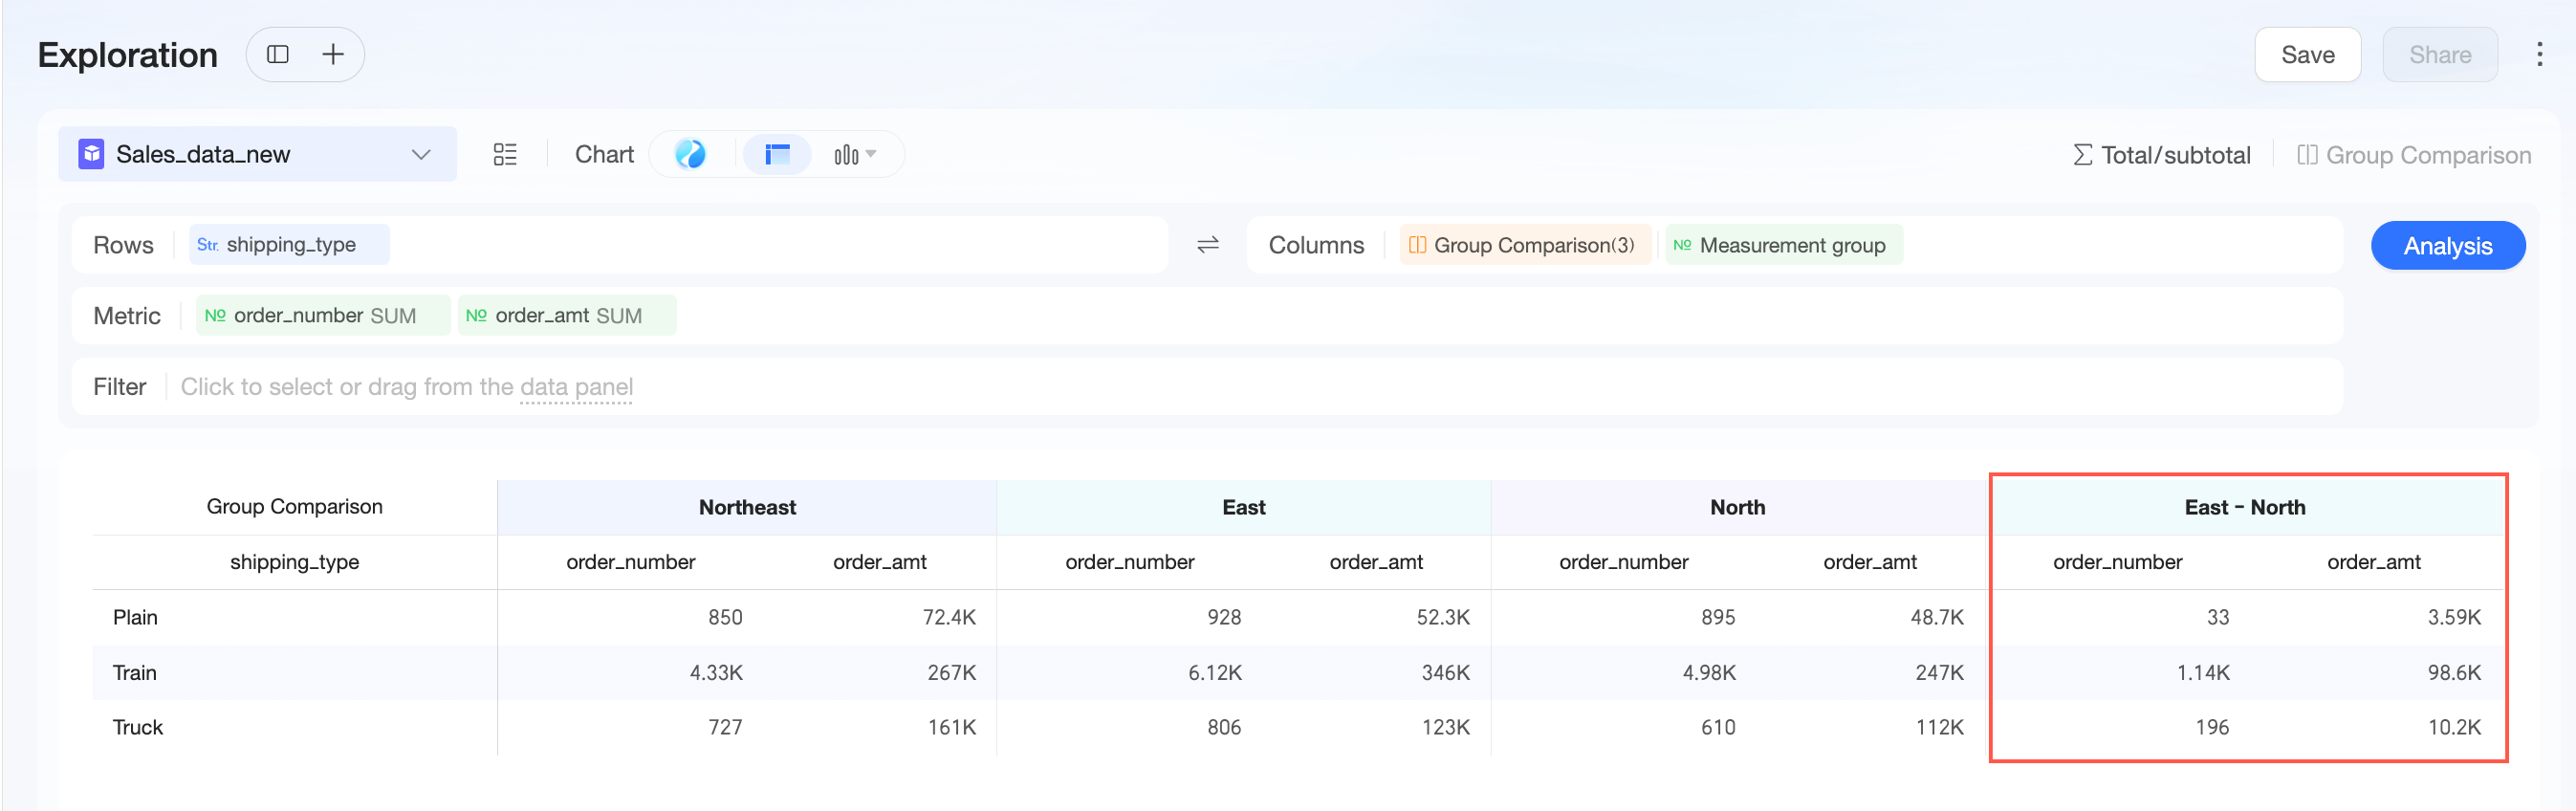
When the chart type is Table, you can set the difference and difference percentage.
NoteYou can configure a maximum of five difference calculations and five difference percentage calculations.
For example, to set the difference between "East China" and "North China":
The following figure shows the result:
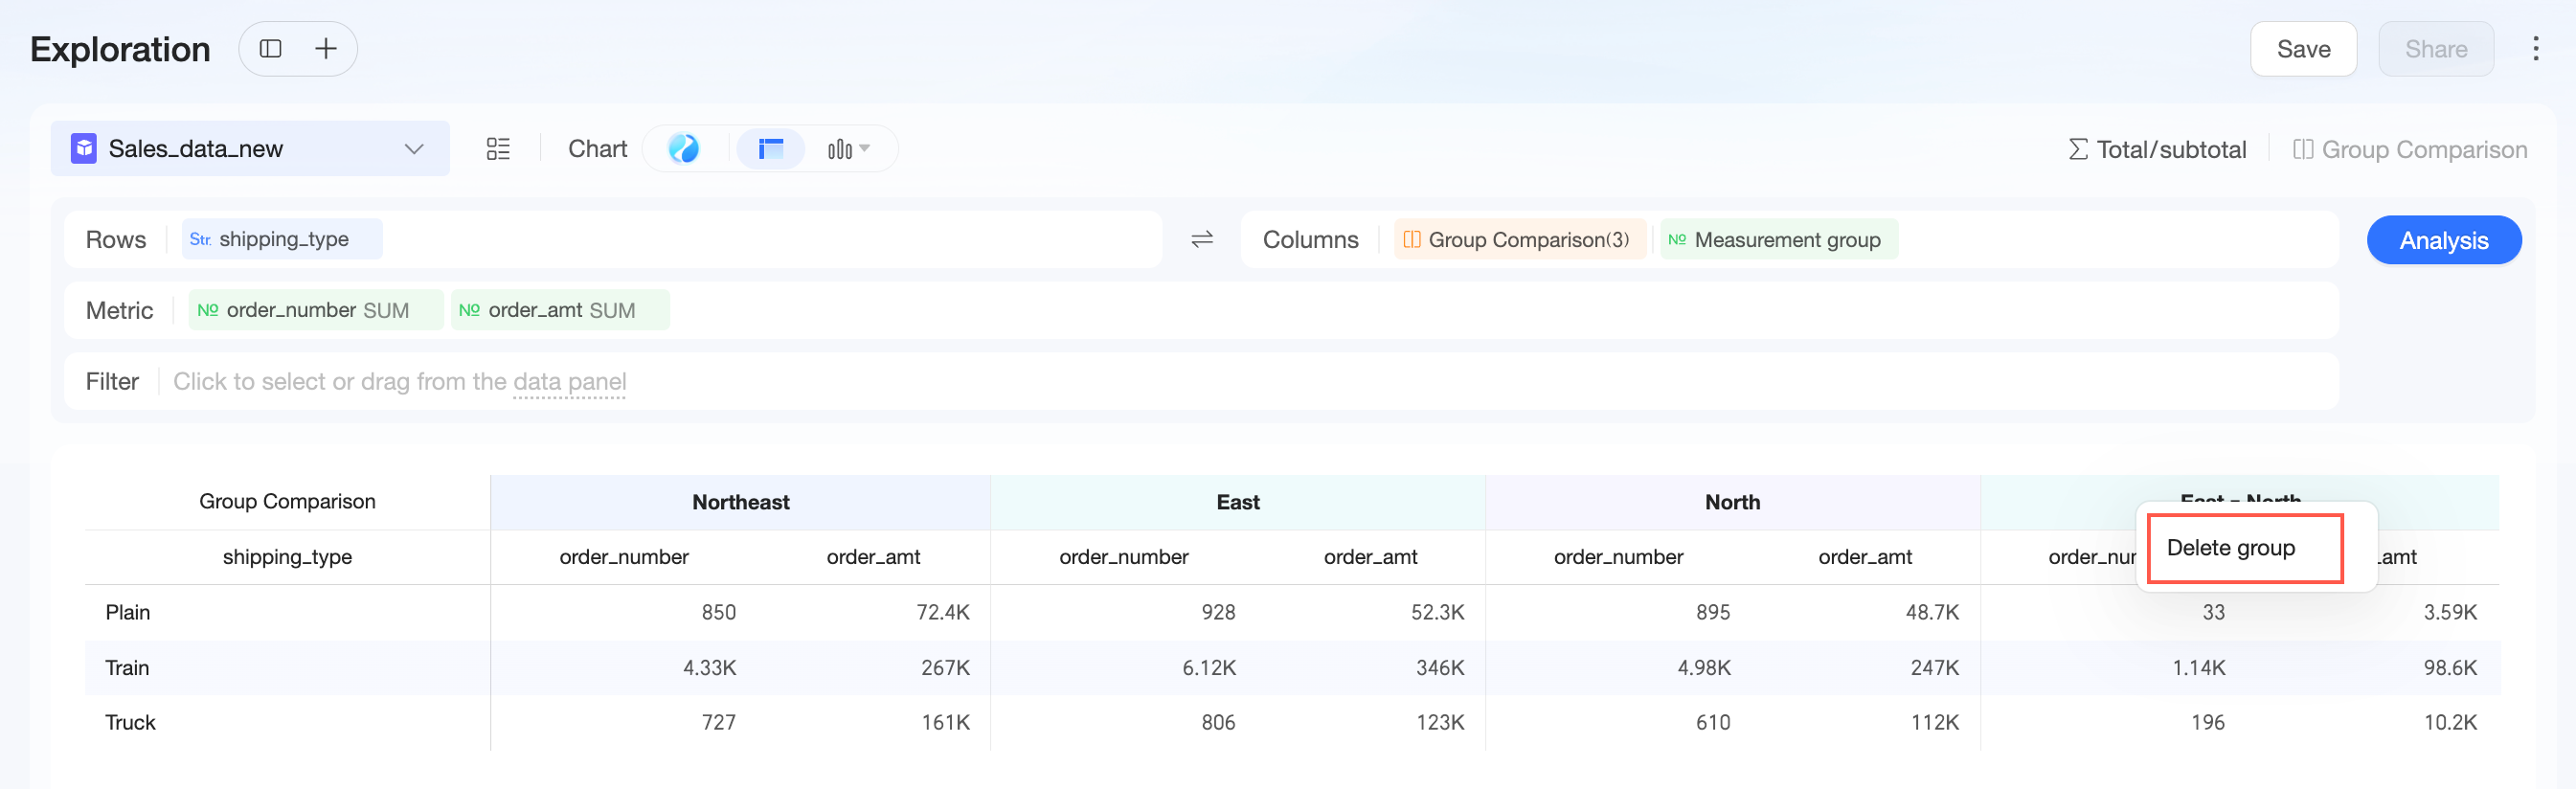
If you no longer need to display this difference, you can click it and select Delete Group.
Totals and subtotals
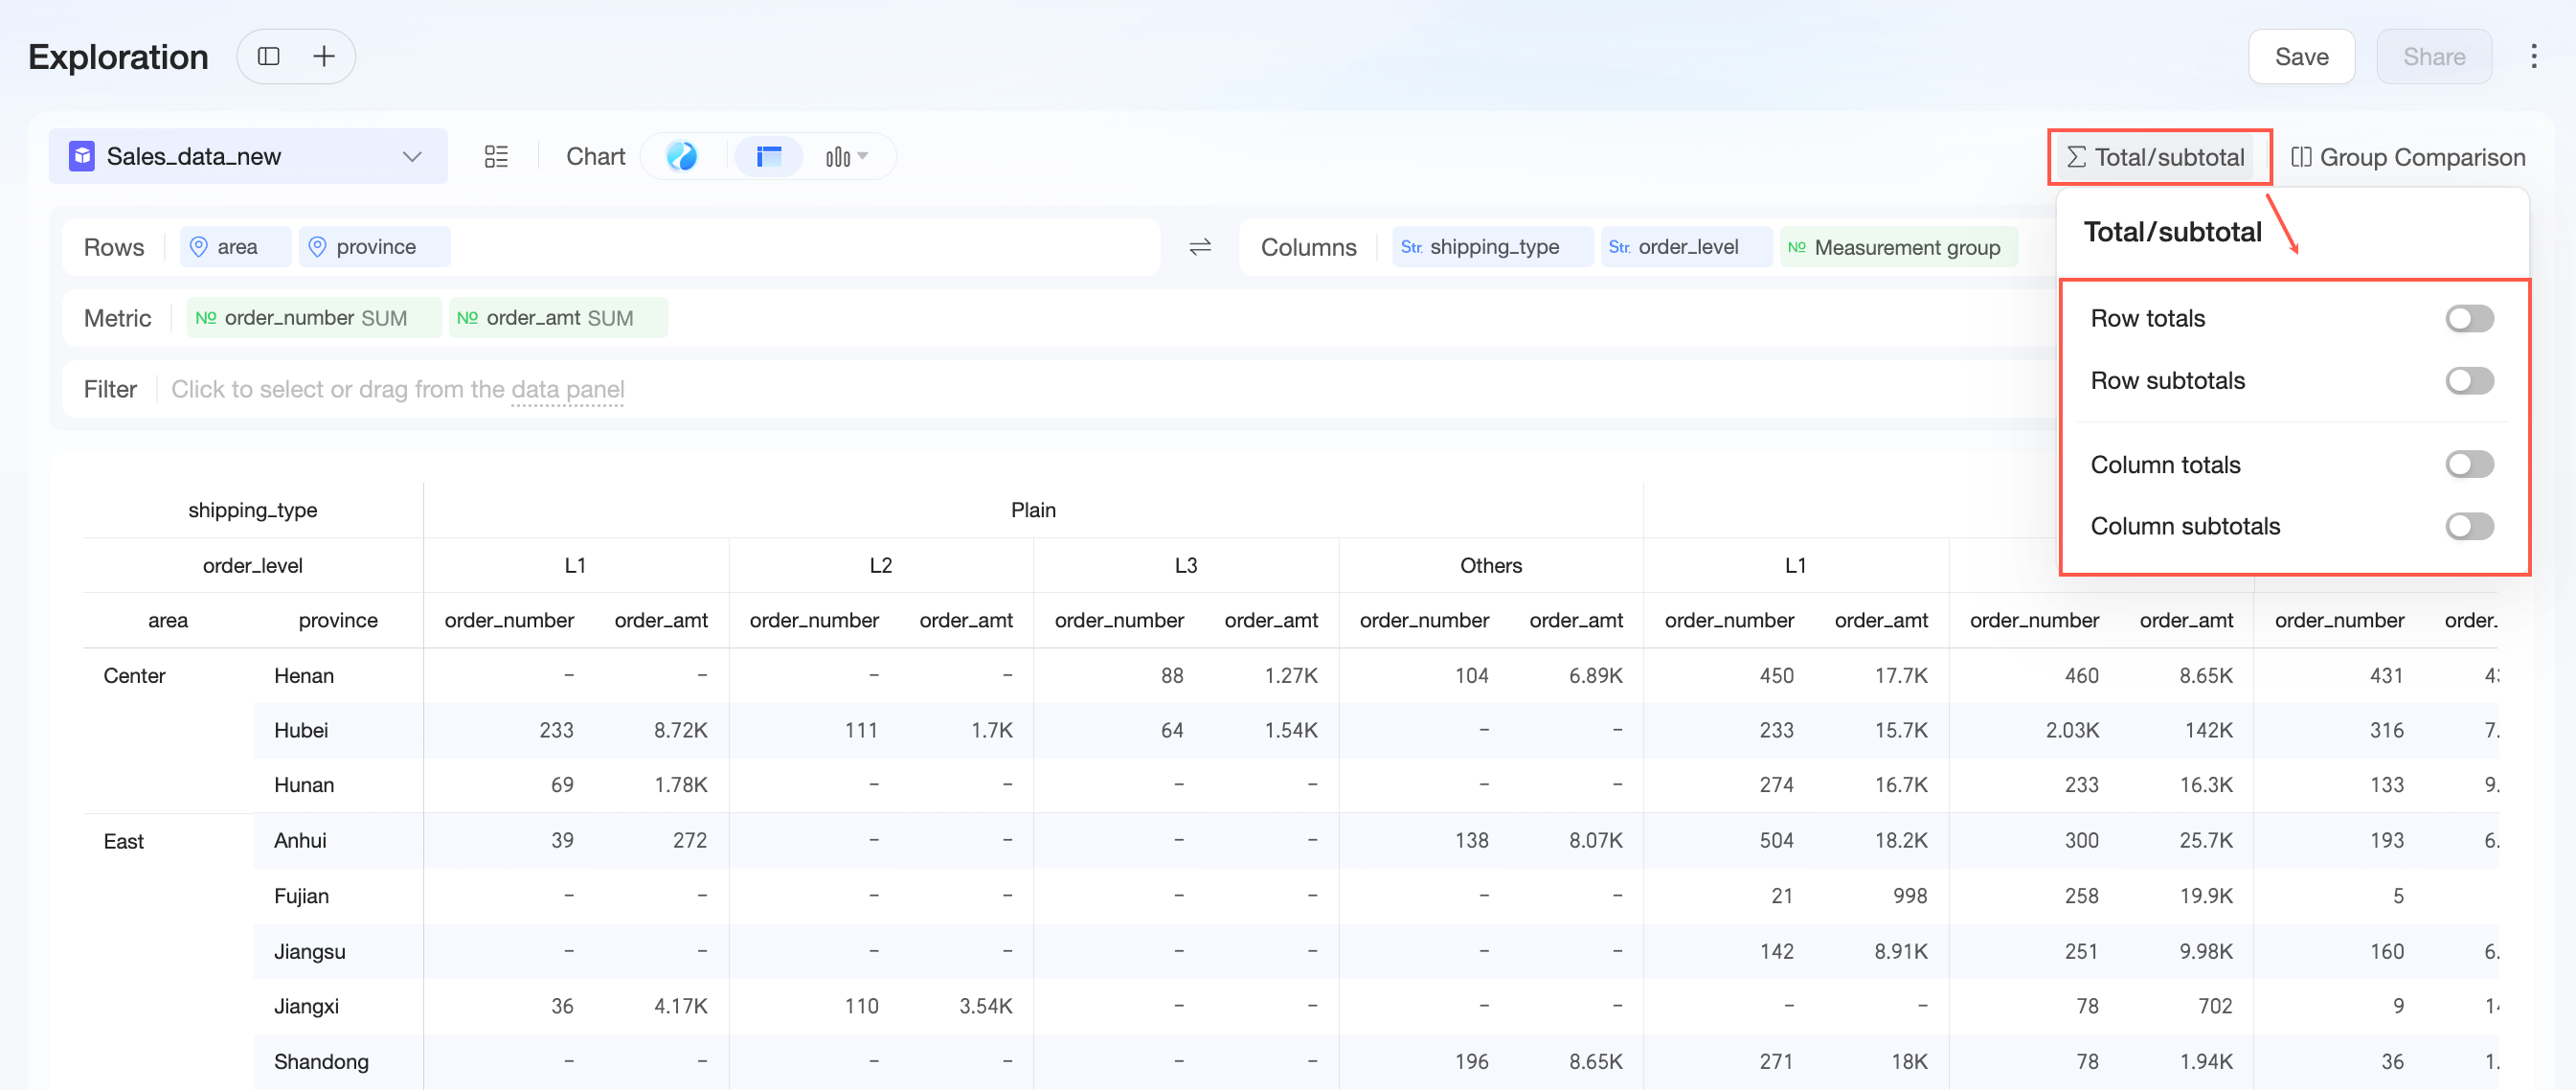
When the chart type is Table, you can set totals and subtotals.
-
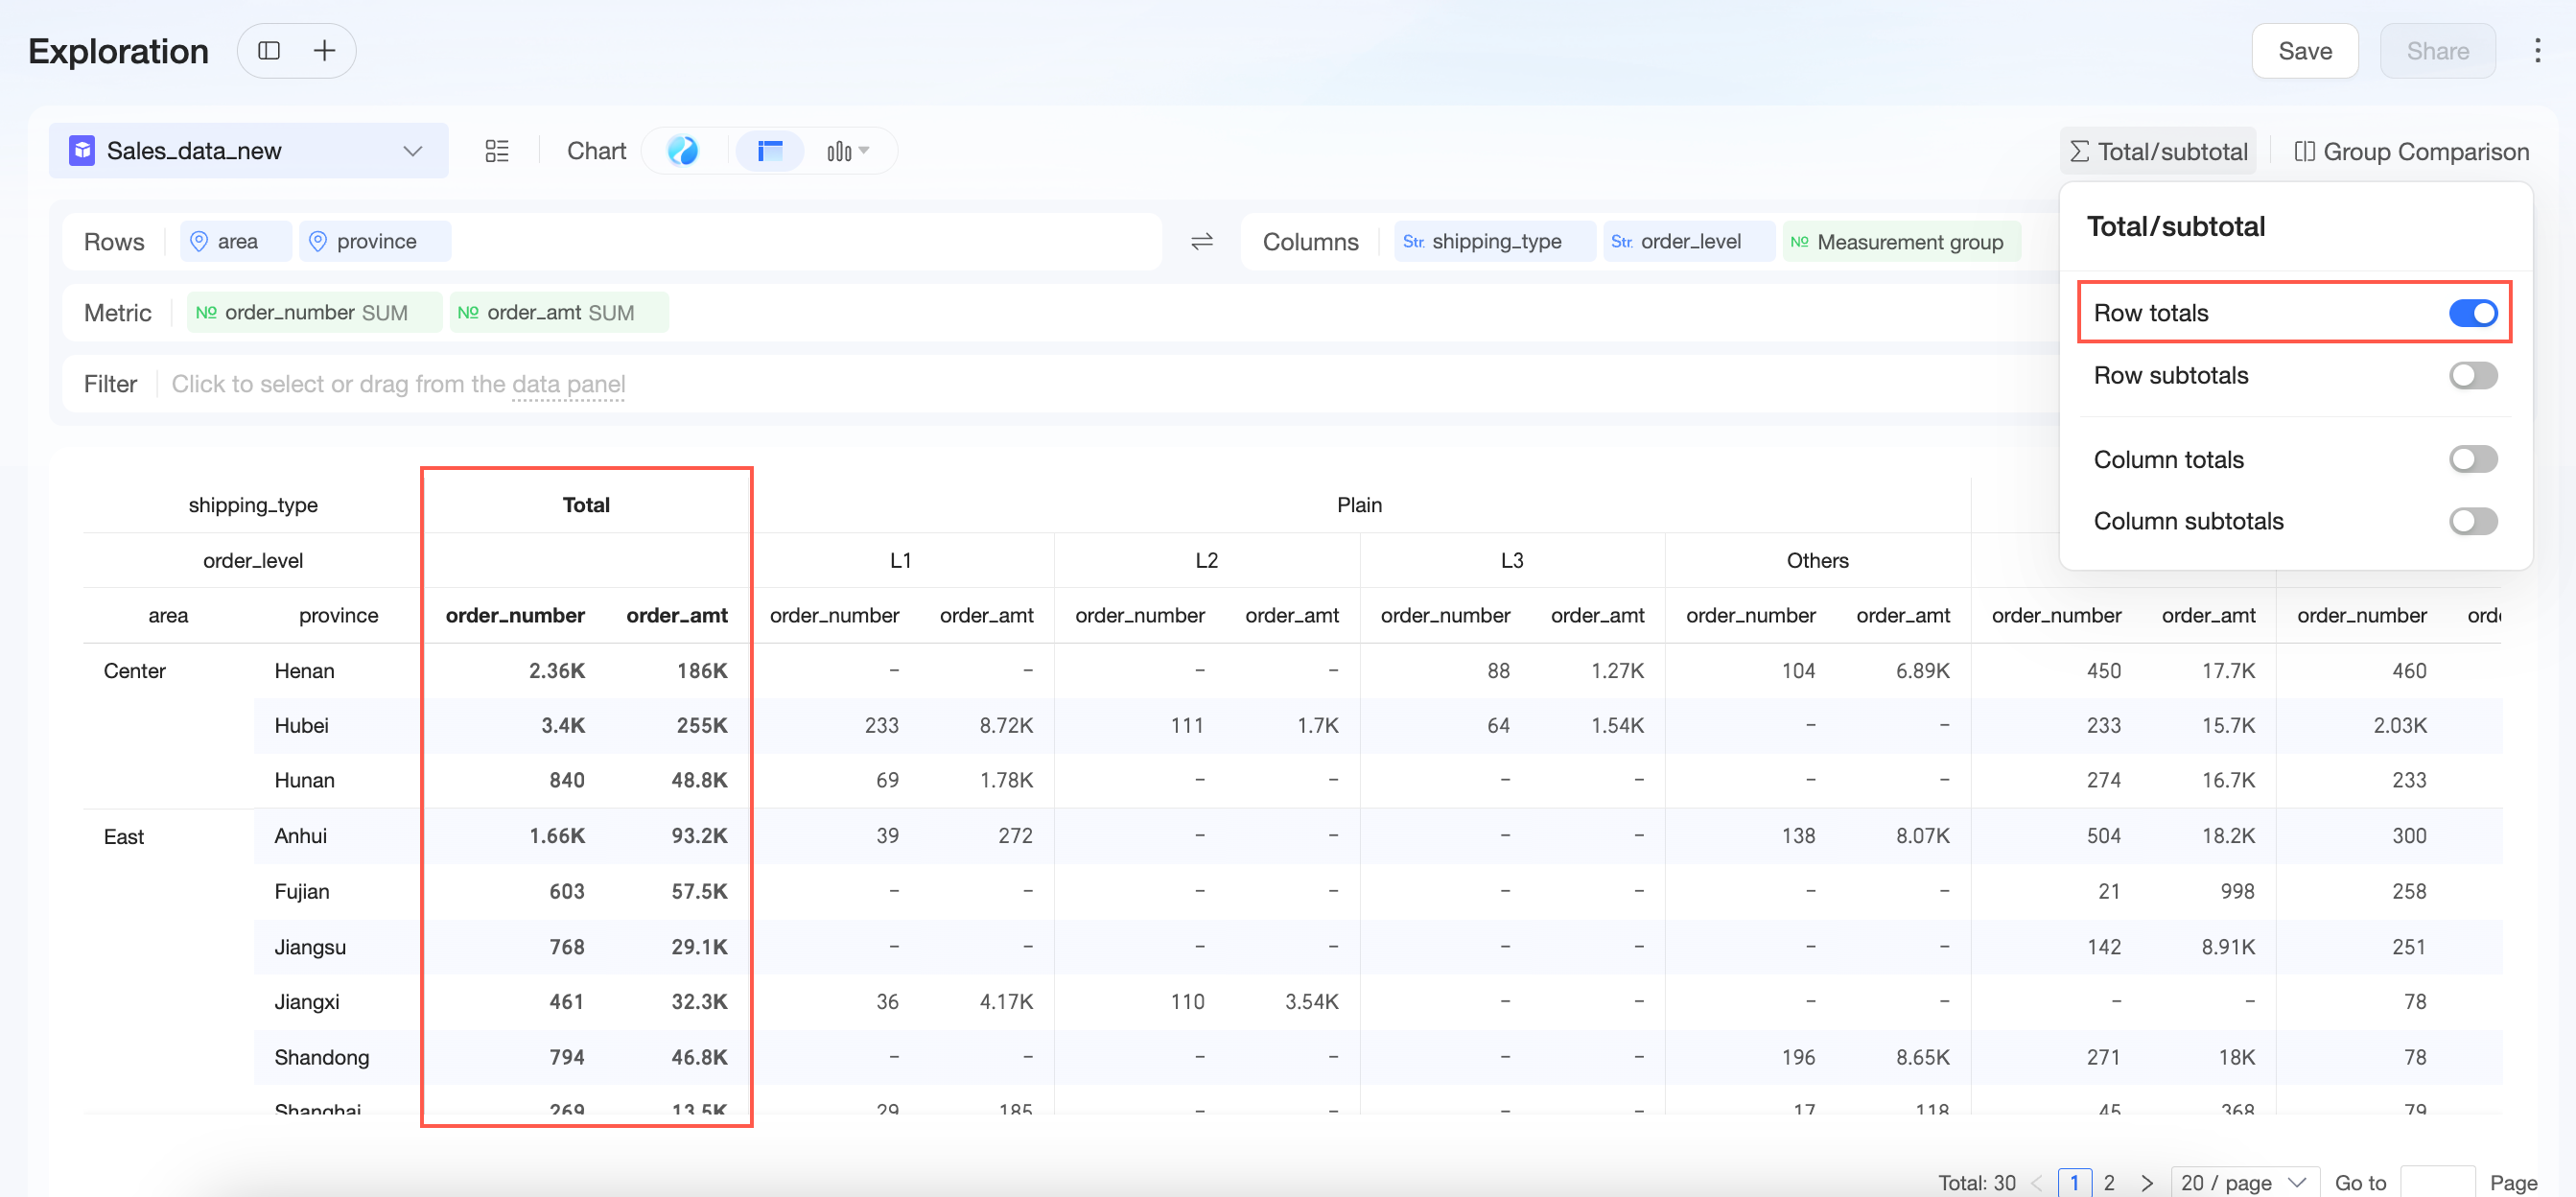
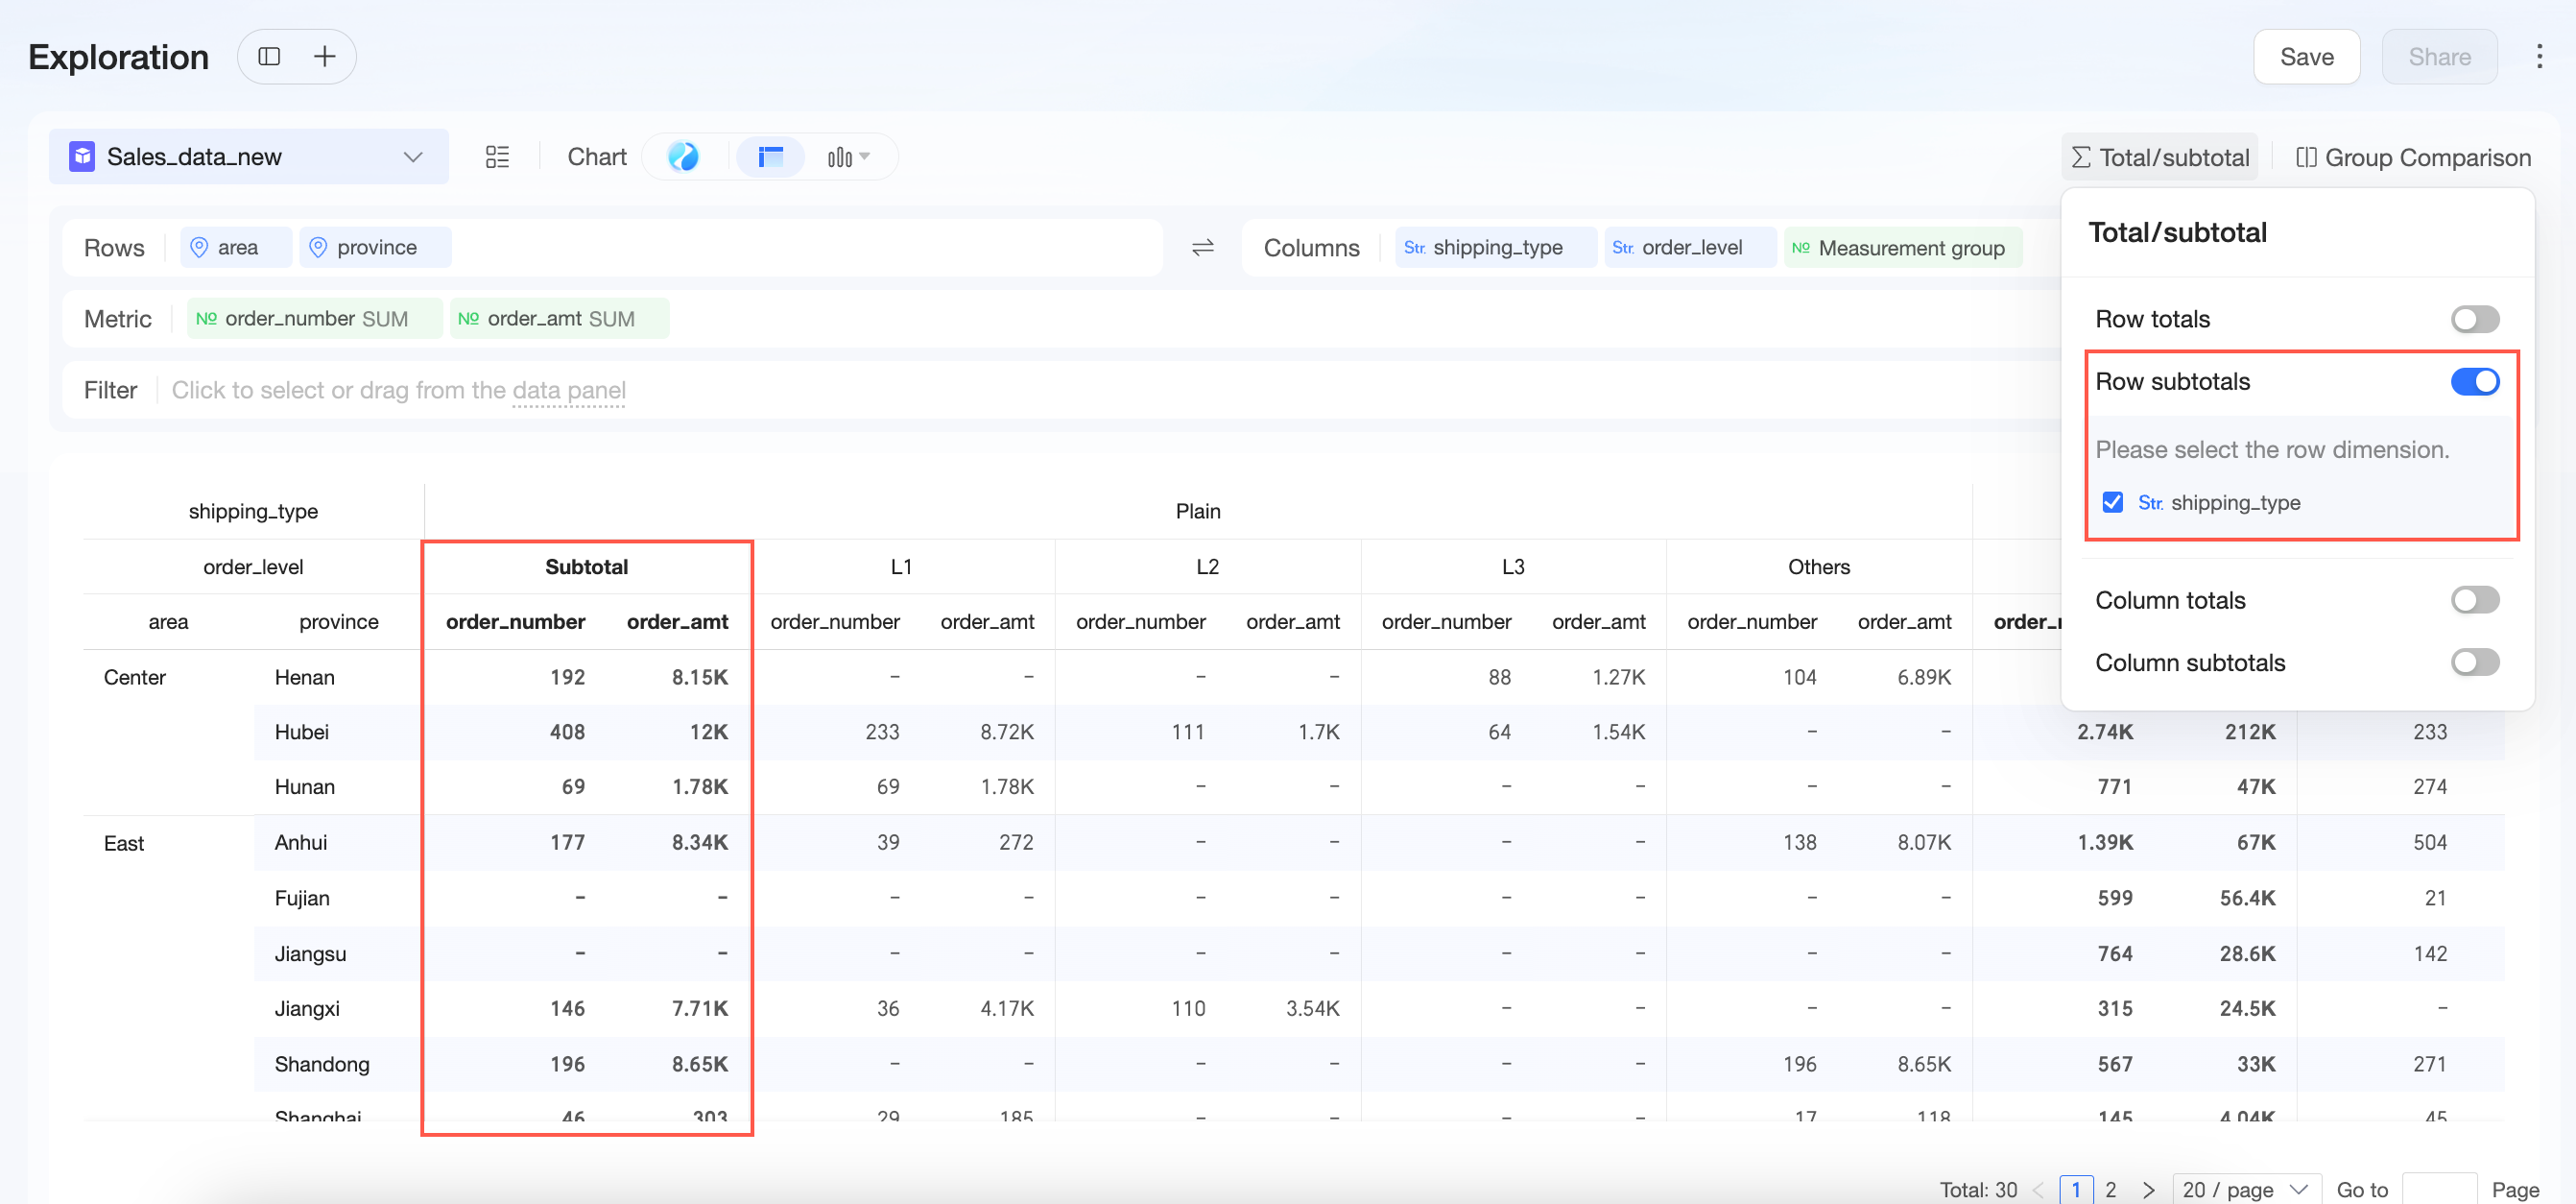
A row grand total aggregates the numeric values in a row. To use this feature, you must have at least one measure and one column dimension.
-
A row subtotal aggregates values within a specific row dimension group. You can choose which dimension to subtotal. To use this feature, you must have at least one measure and multiple column dimensions.
-
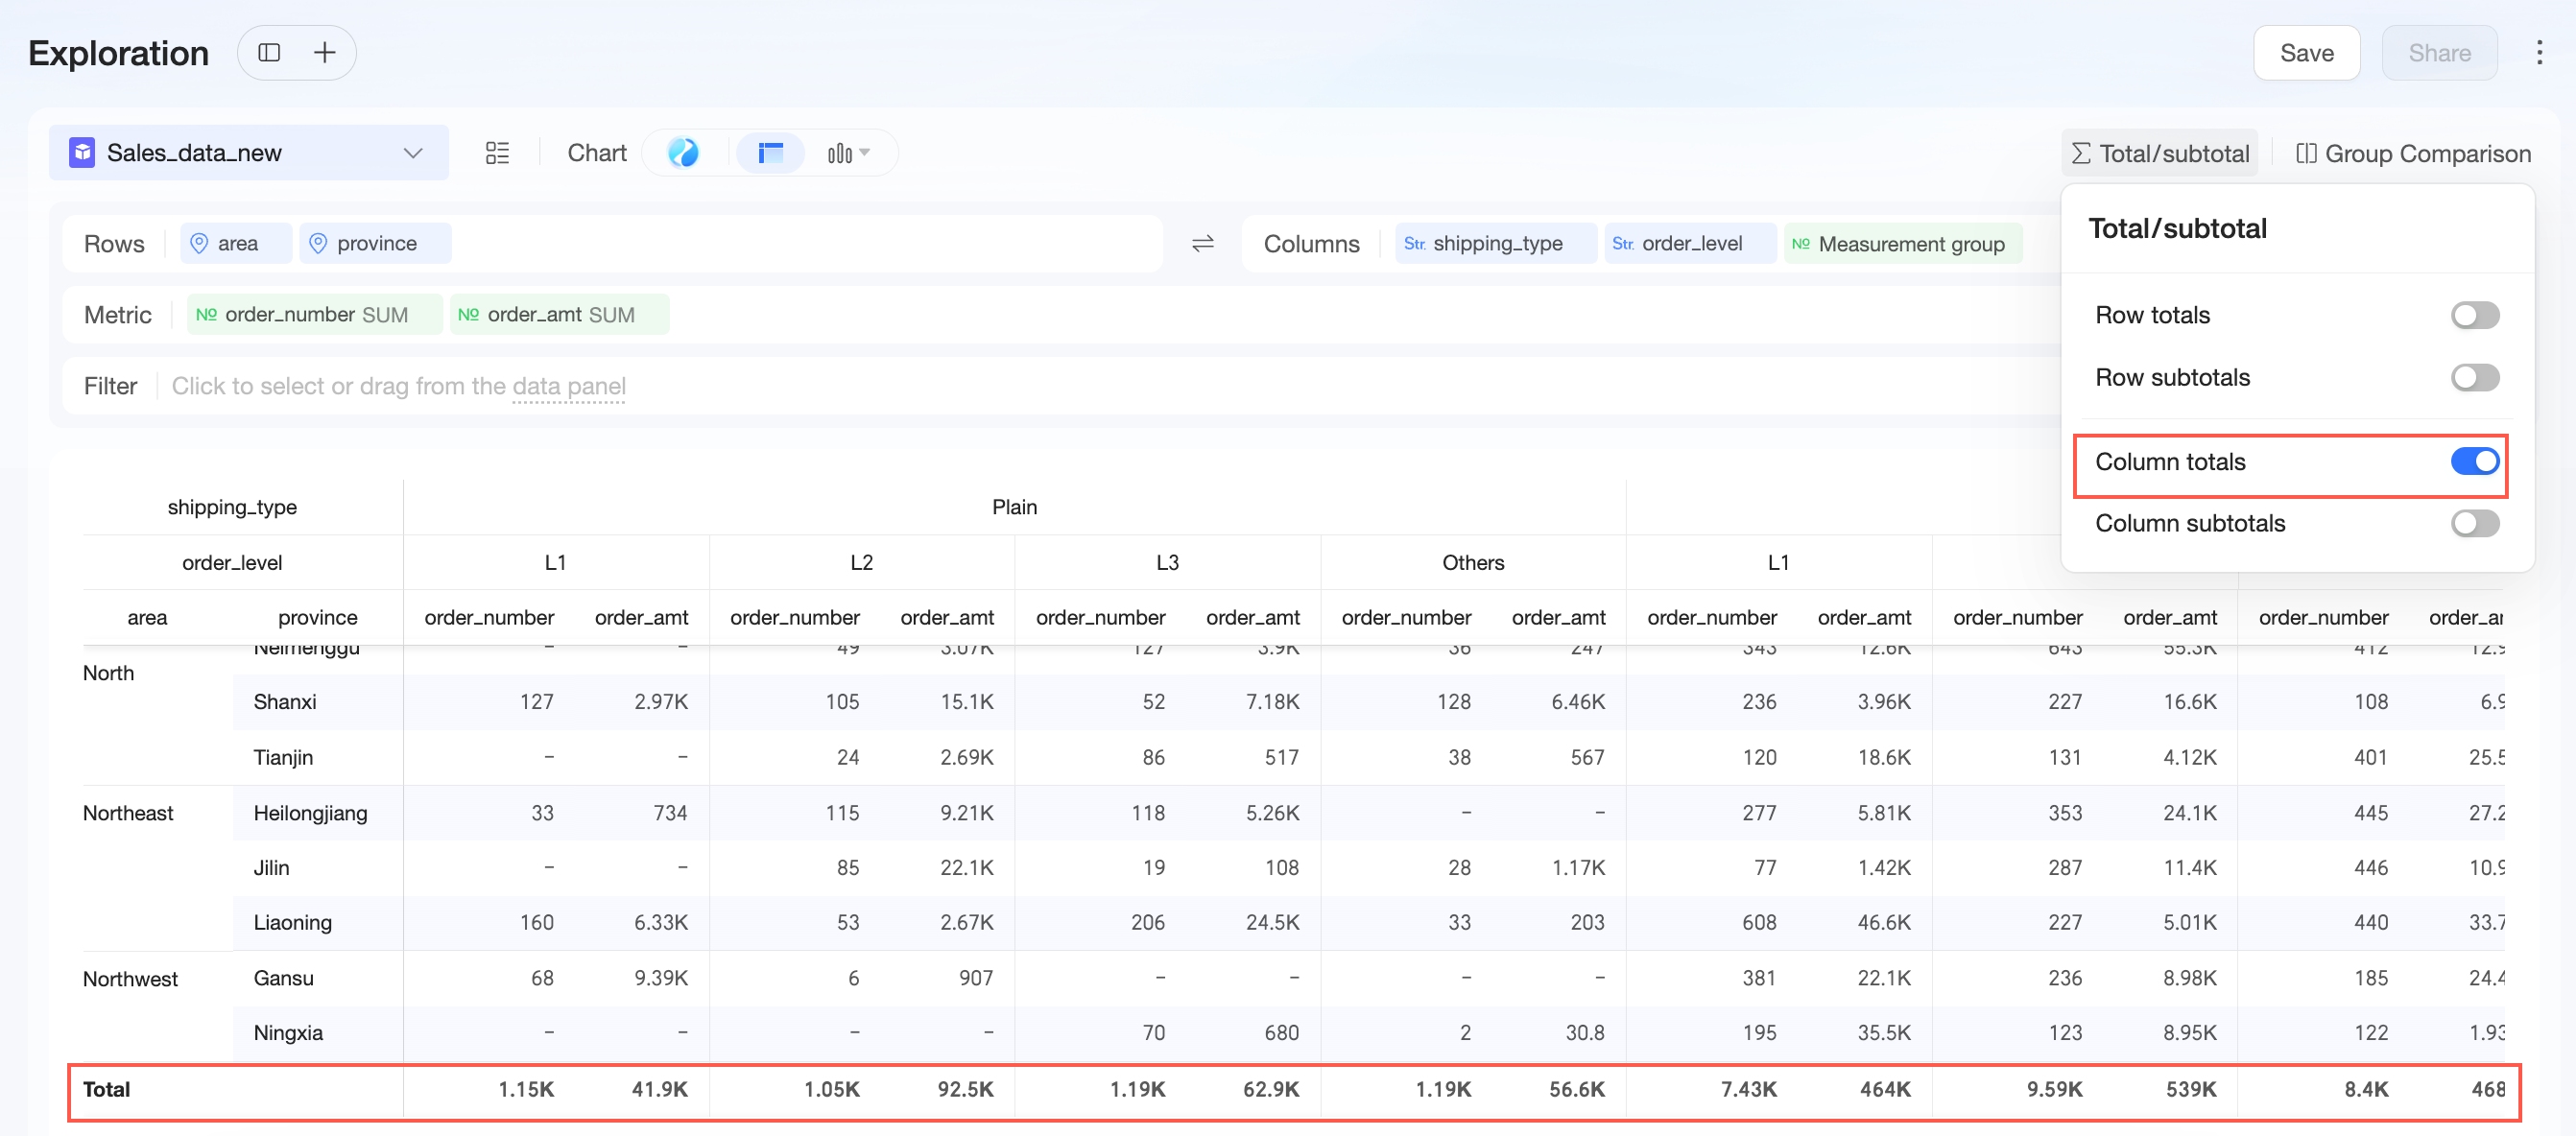
A column grand total aggregates the numeric values in a column. To use this feature, you must have at least one measure and one row dimension.
-
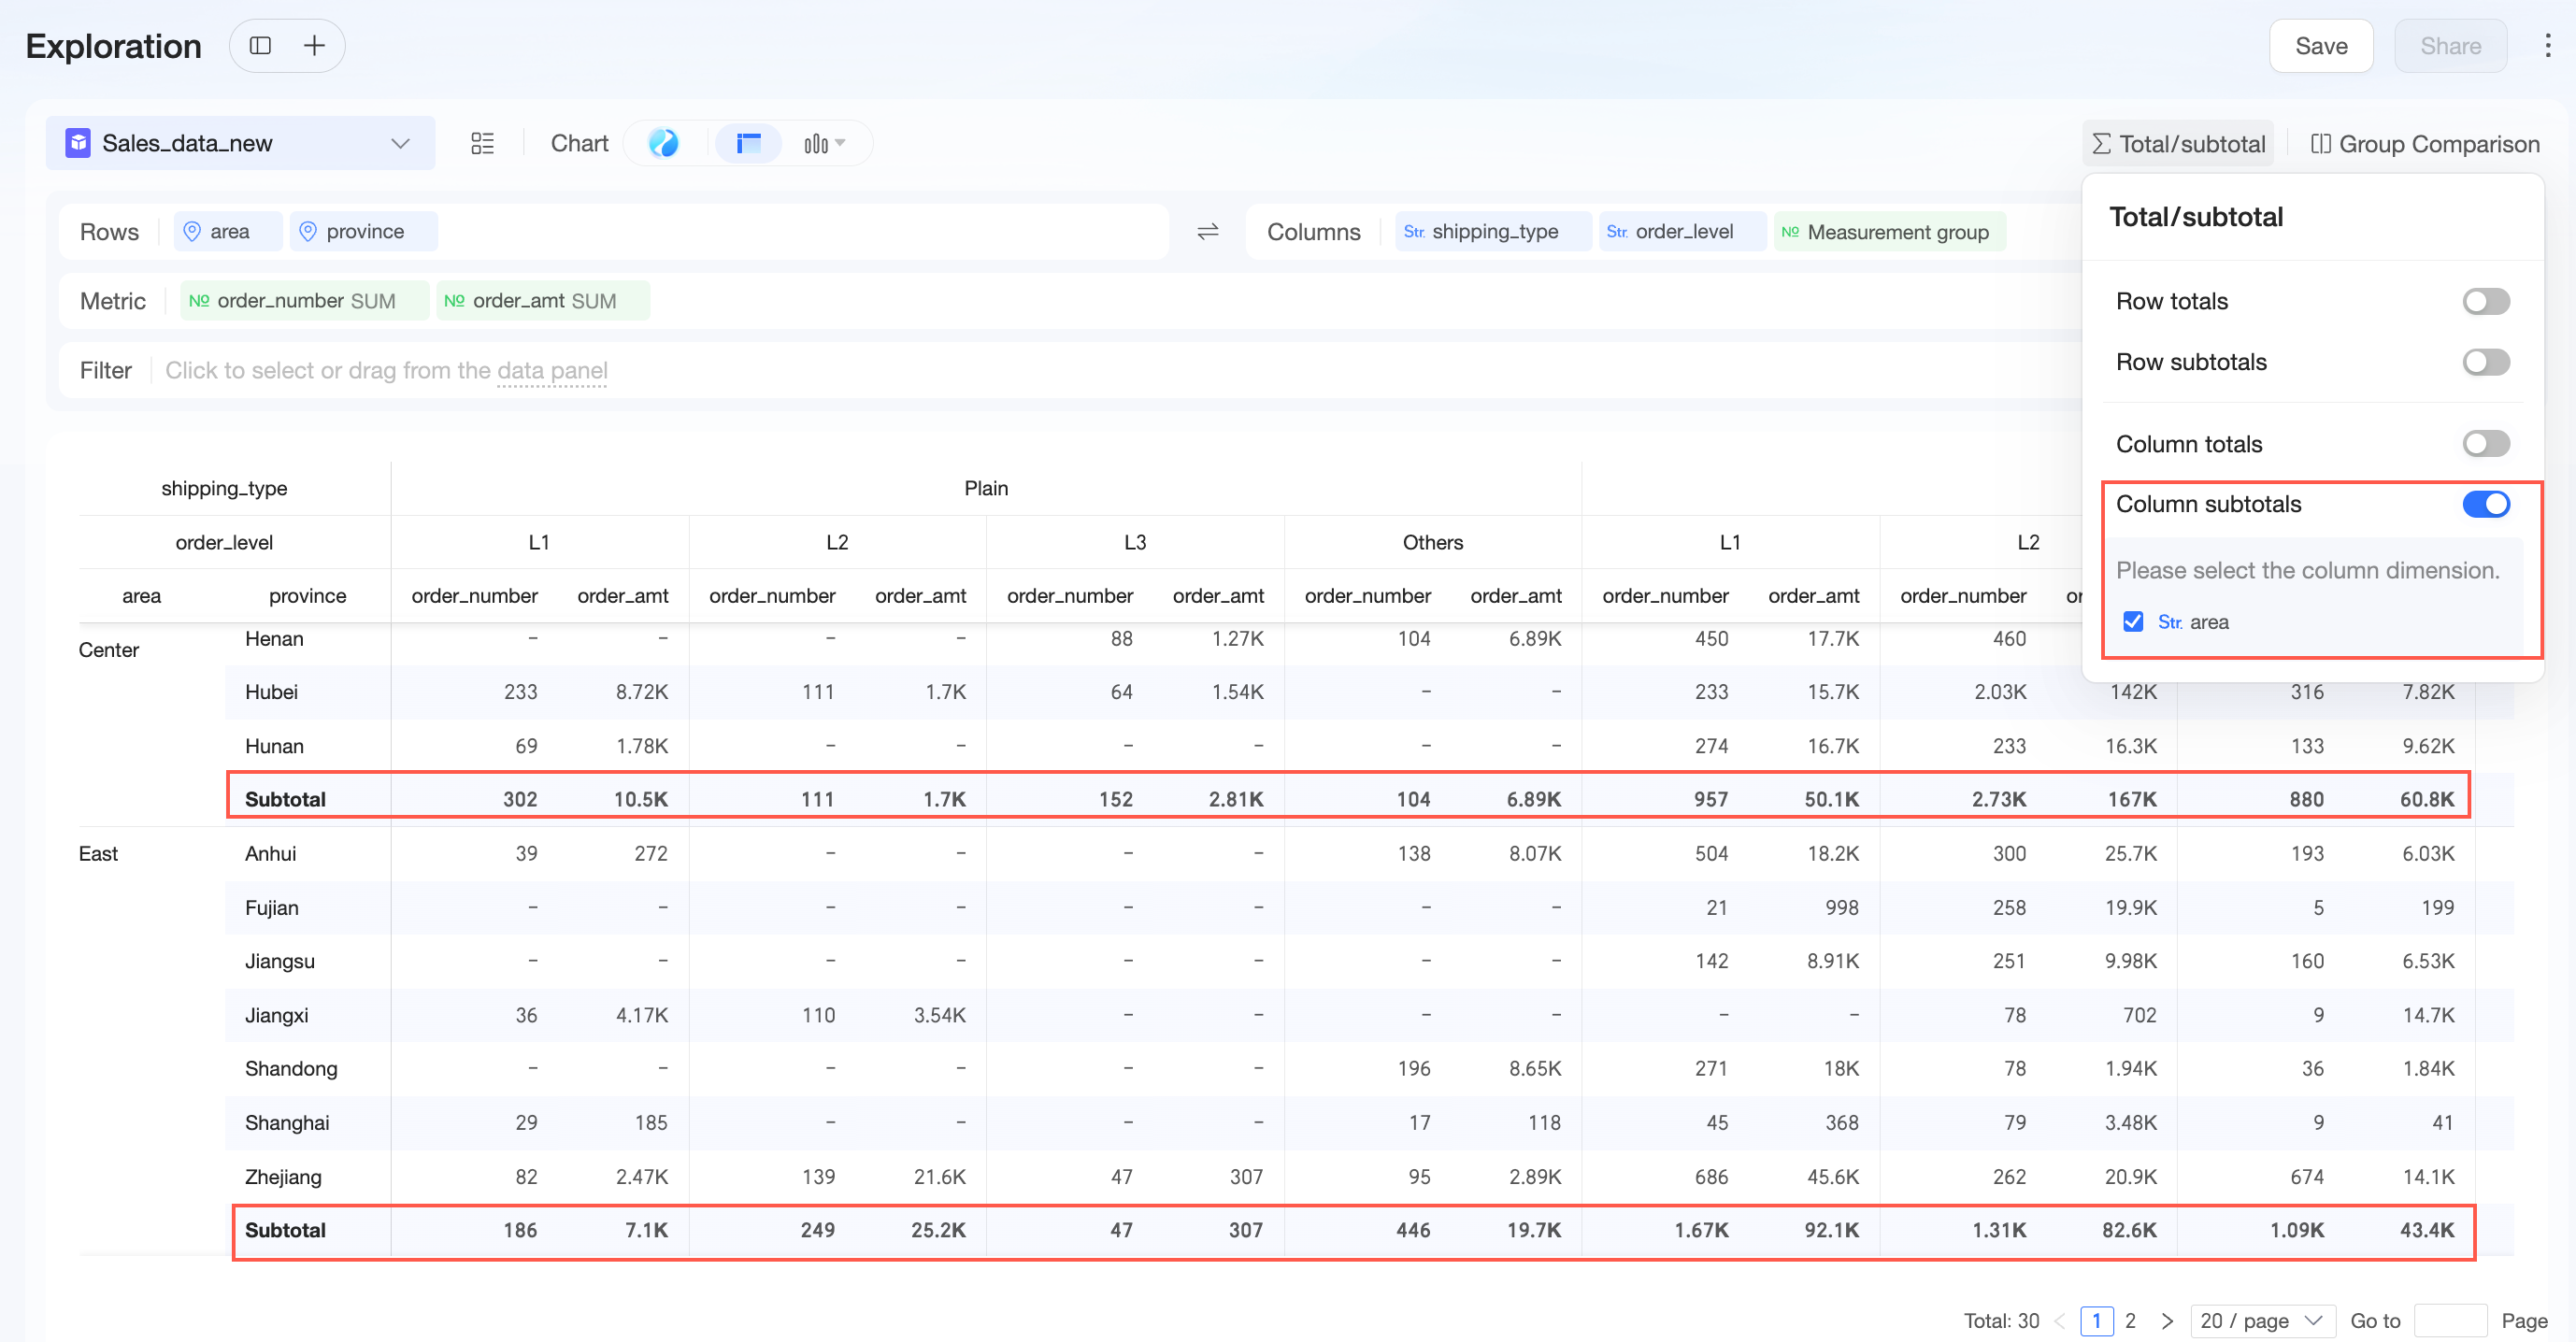
A column subtotal aggregates values within a specific column dimension group. You can choose which dimension to subtotal. To use this feature, you must have at least one measure and multiple row dimensions.
Advanced calculations
-
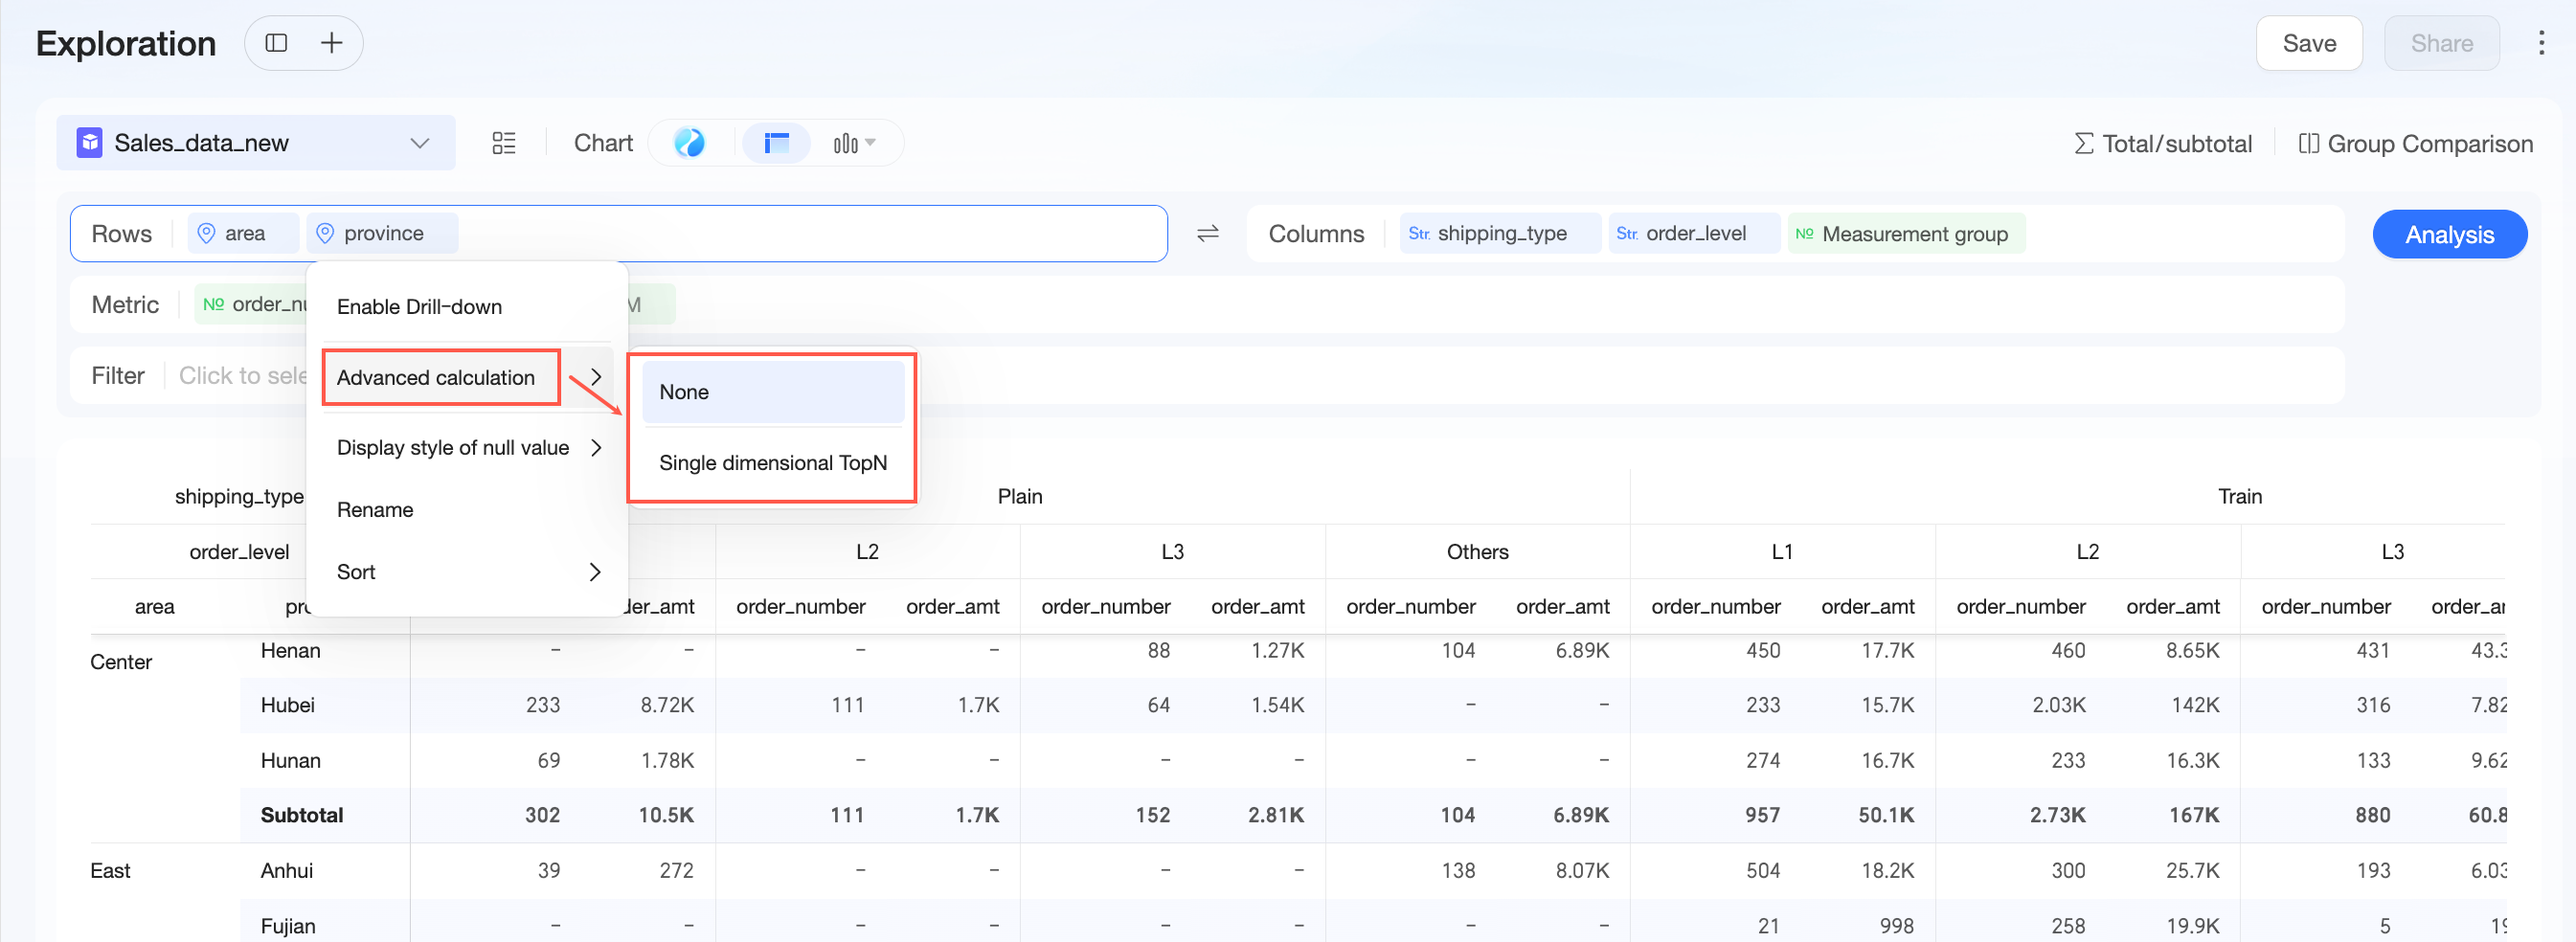
Numeric fields support period-over-period, date accumulation, running total, percent of total, data ranking, Top N, percentile, difference calculation, moving calculation, nested calculation, and multi-field combination.
-
Dimension fields support single-dimension Top N.
Drill down
Dimension fields support drill-down. Set drill-down fields based on your business requirements.
-
When the chart type is Table, you can set up to three drill-down fields. Other chart types support only one drill-down field.
-
You can set a maximum of six drill-down levels.
-
You cannot drill down on fields in the columns area of a table.
Create a drill-down path
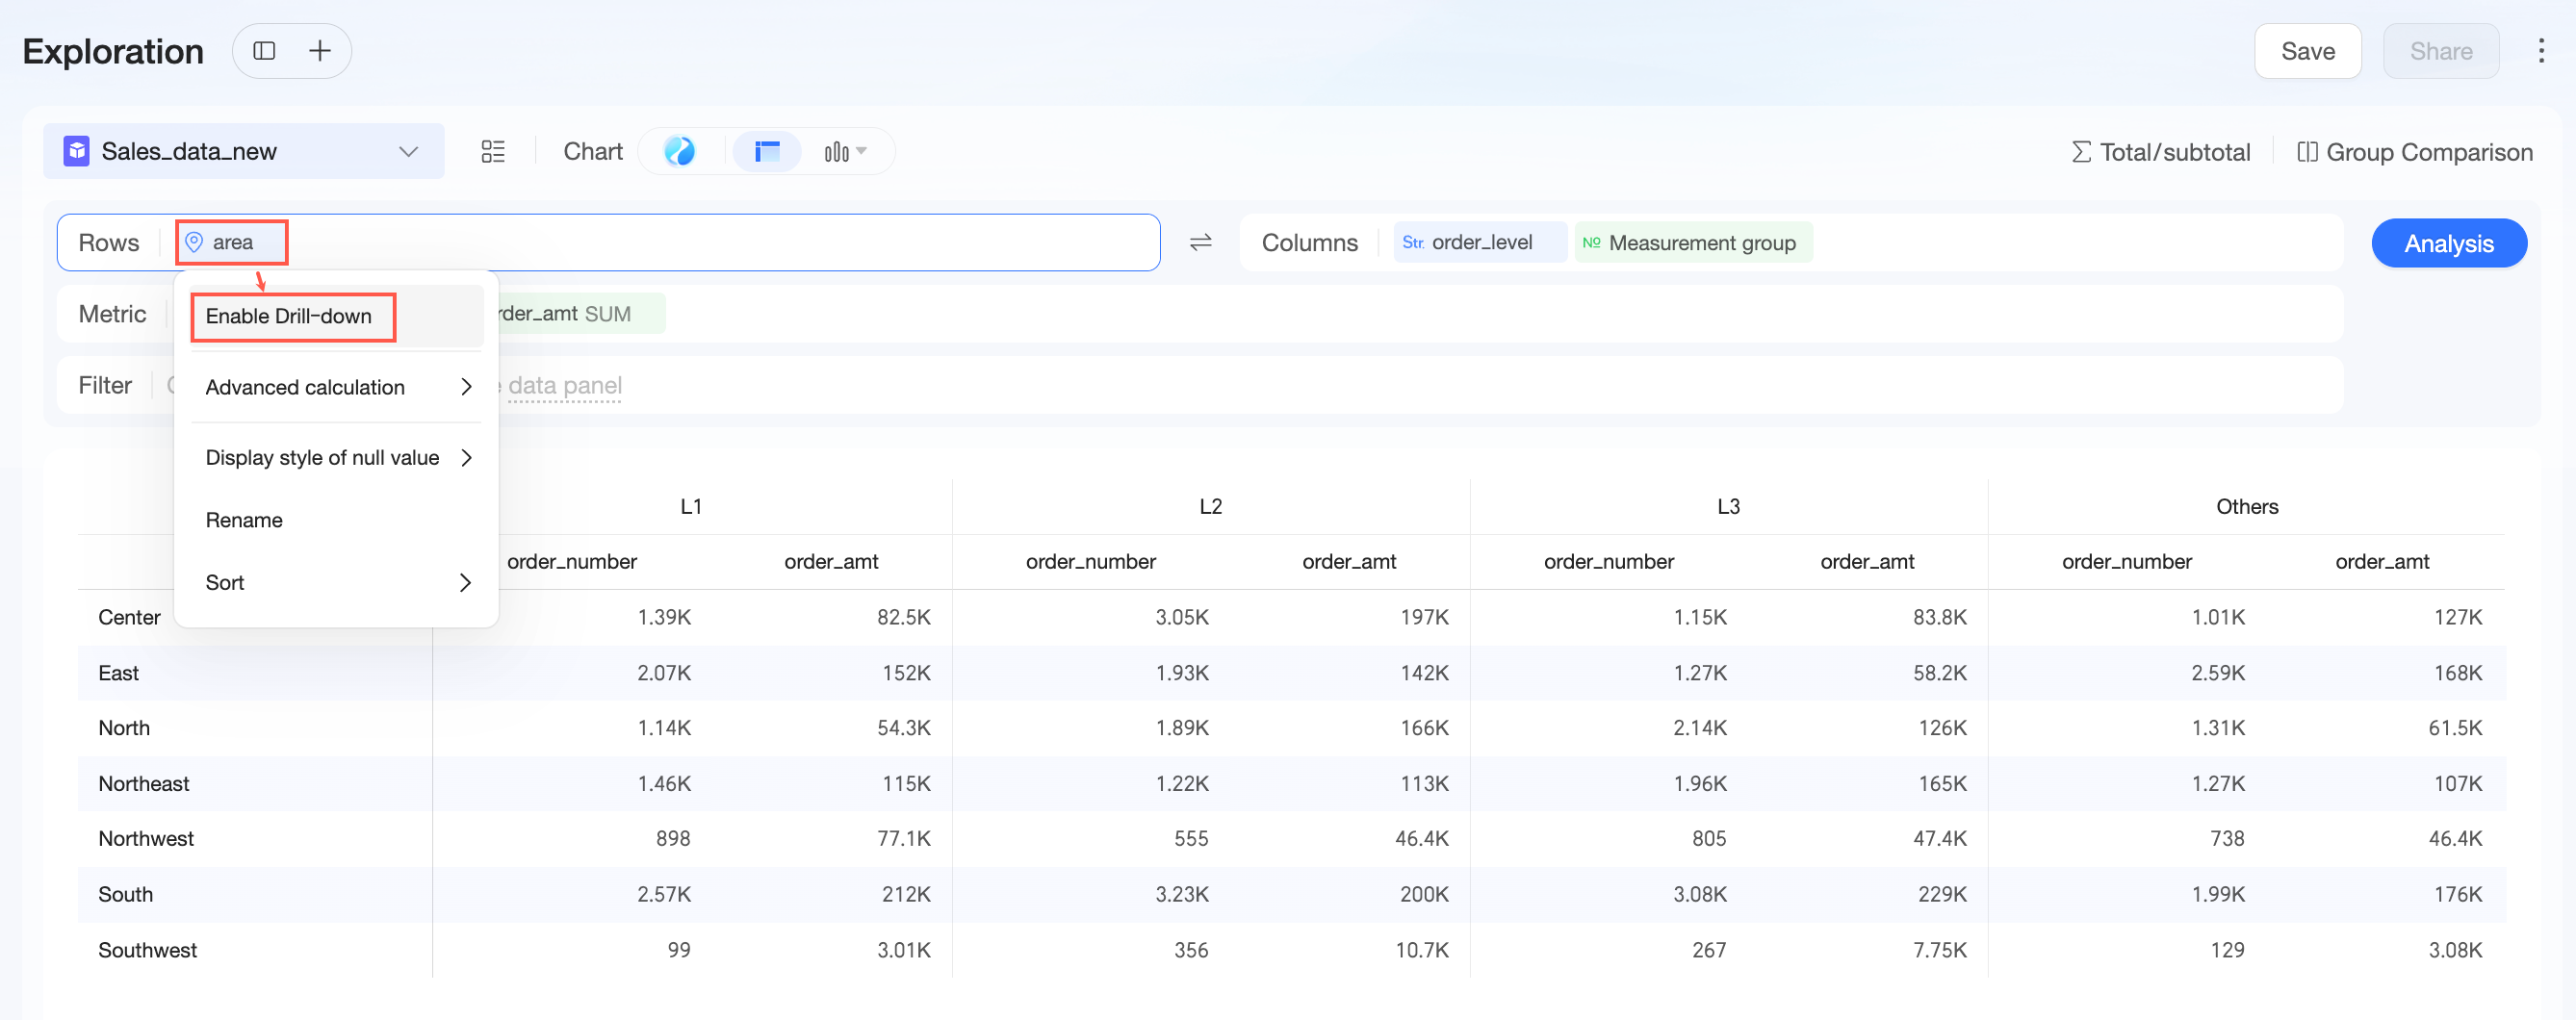
You can create a drill-down path from the selection box.
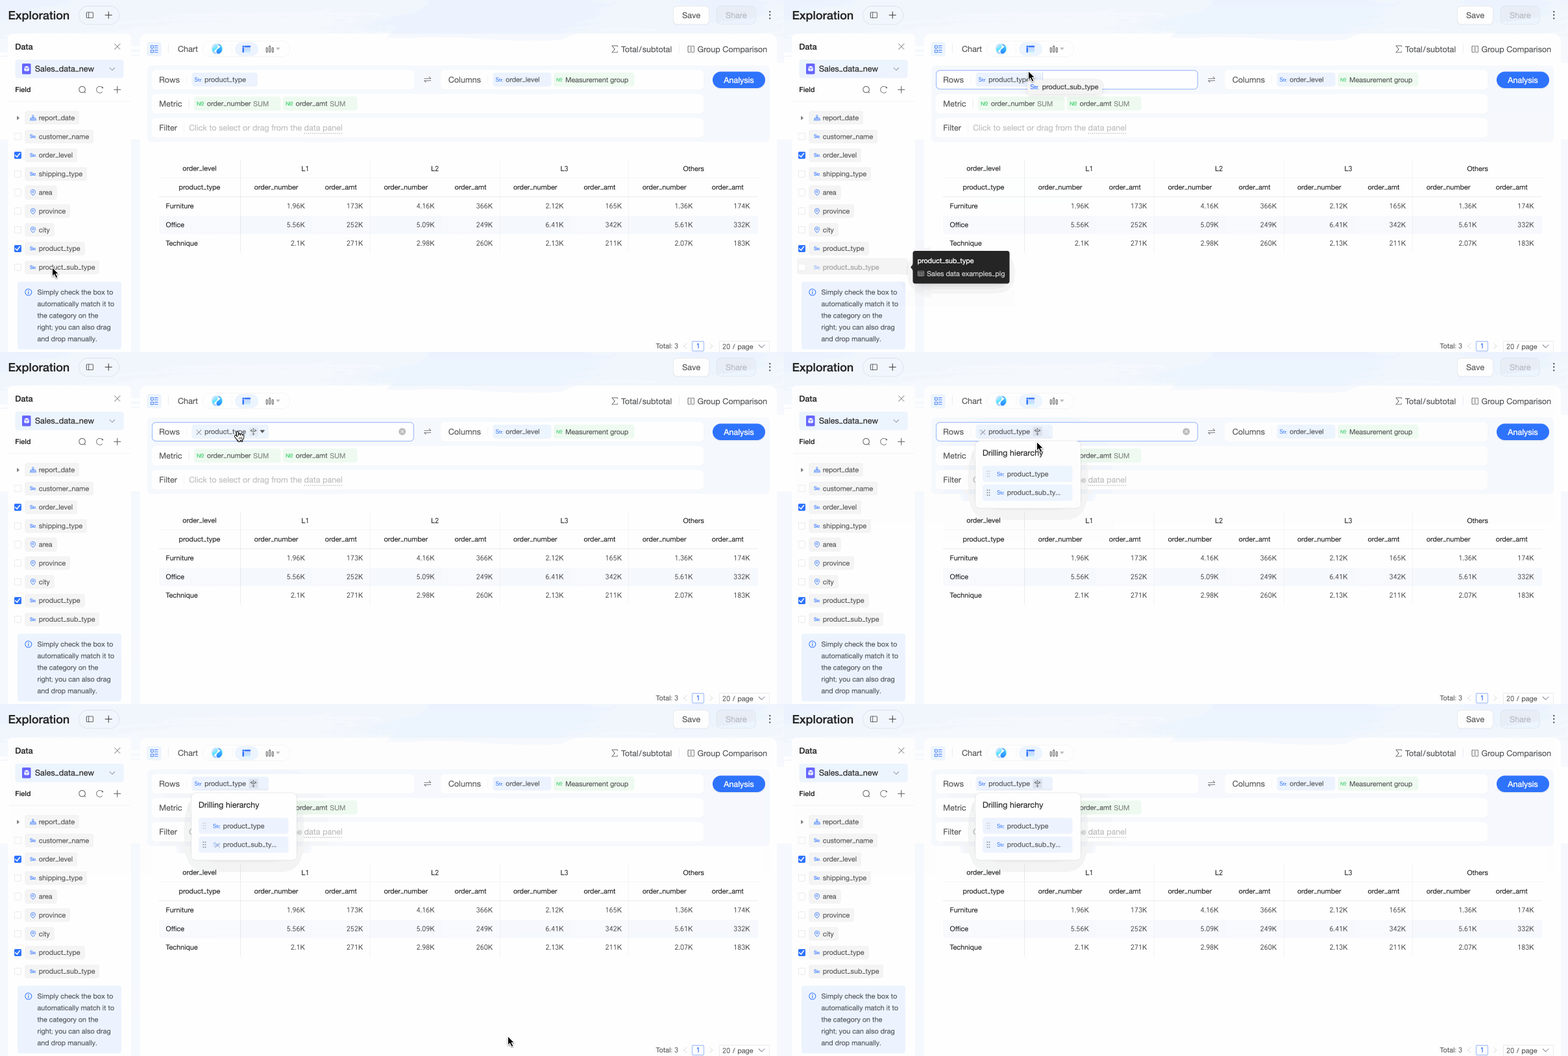
You can also drag a field from the data pane to an existing field in a configuration area to create a drill-down path.
-
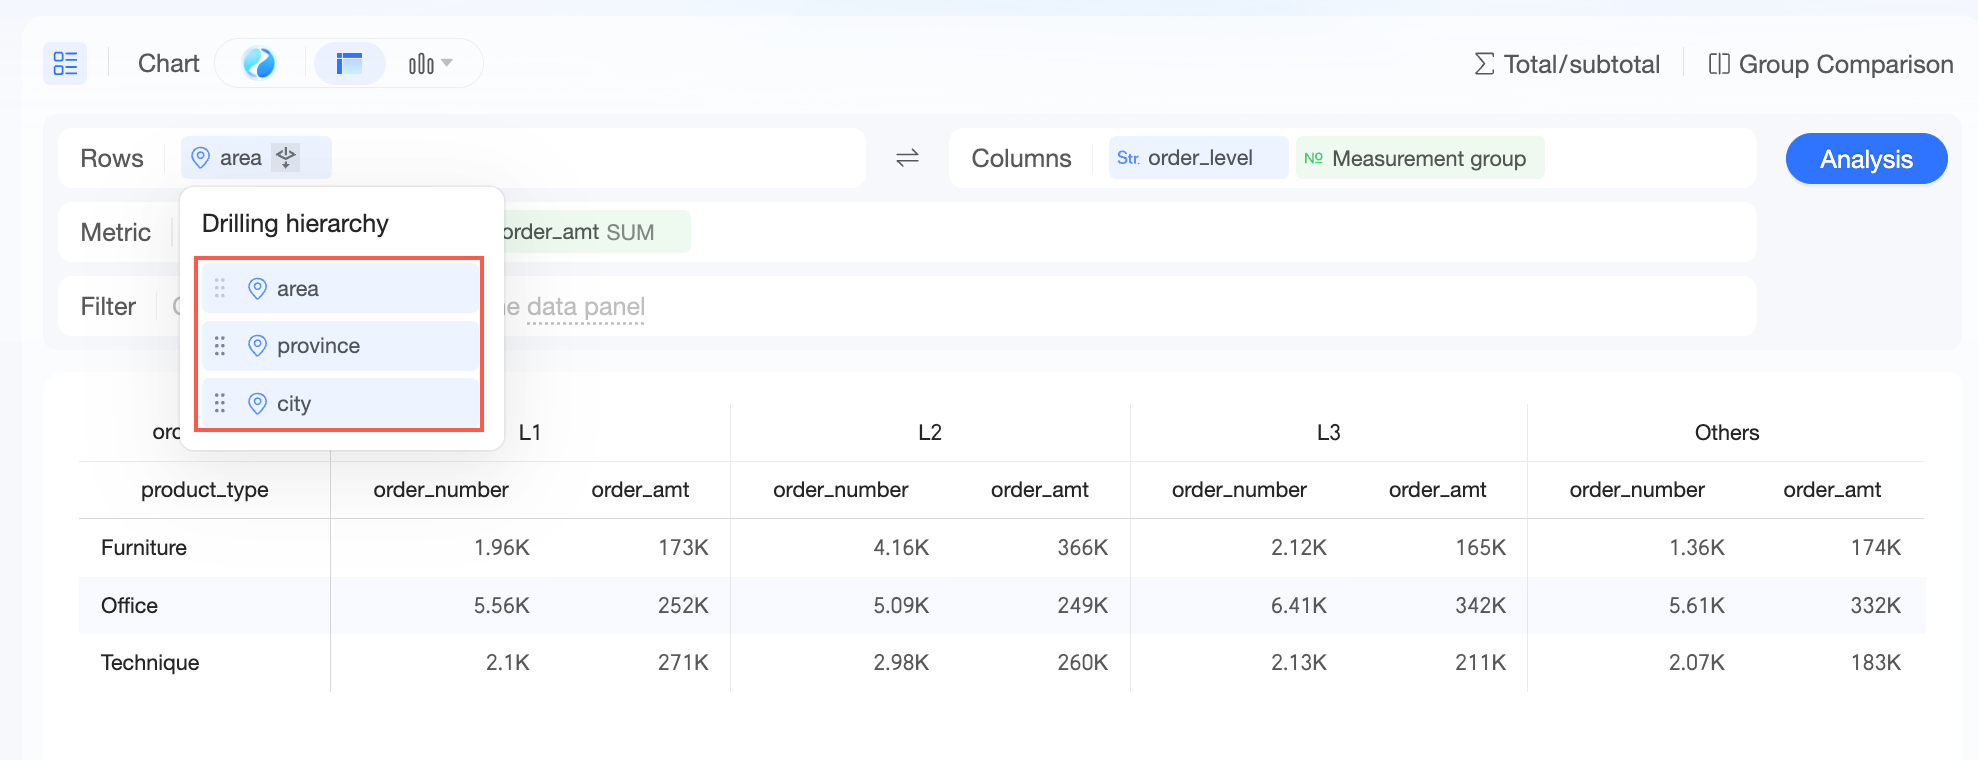
If a hierarchy is already configured for the field in the dataset, the drill-down levels are displayed by default.
-
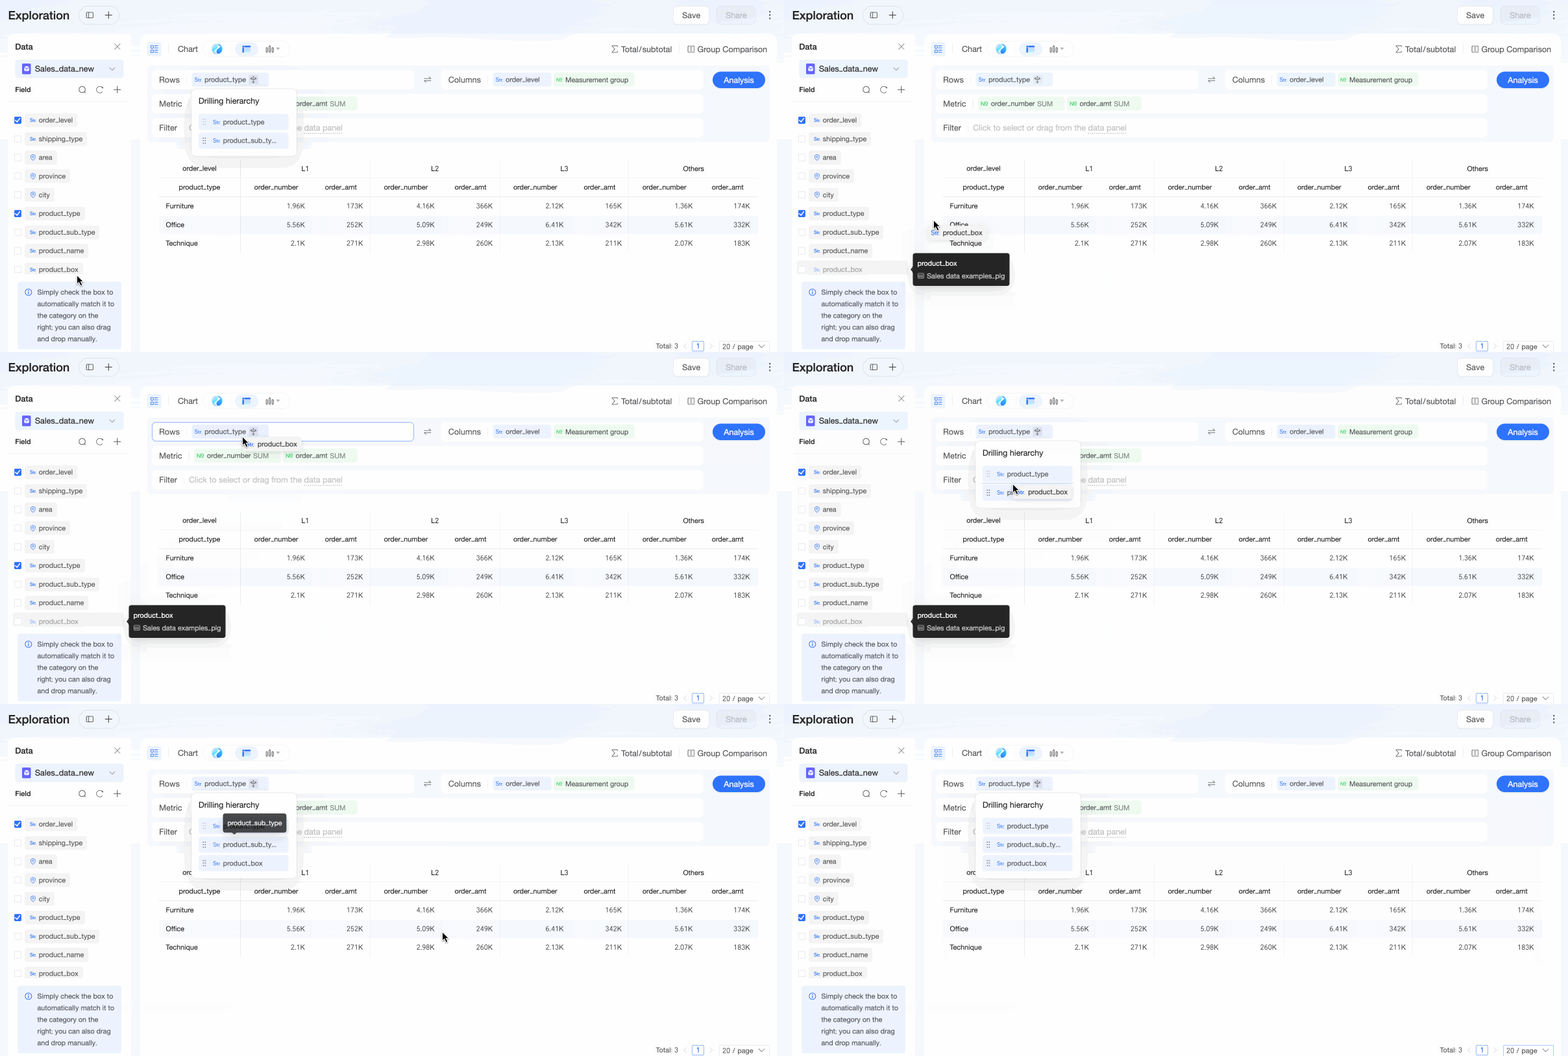
If no hierarchy is configured for the field, only the current field is displayed by default. You can add or remove dimension fields to or from the current drill-down path.
Drill-down level configuration
Click the  icon to the right of the drill-down field, or click the
  icon and select Configure drill-down levels.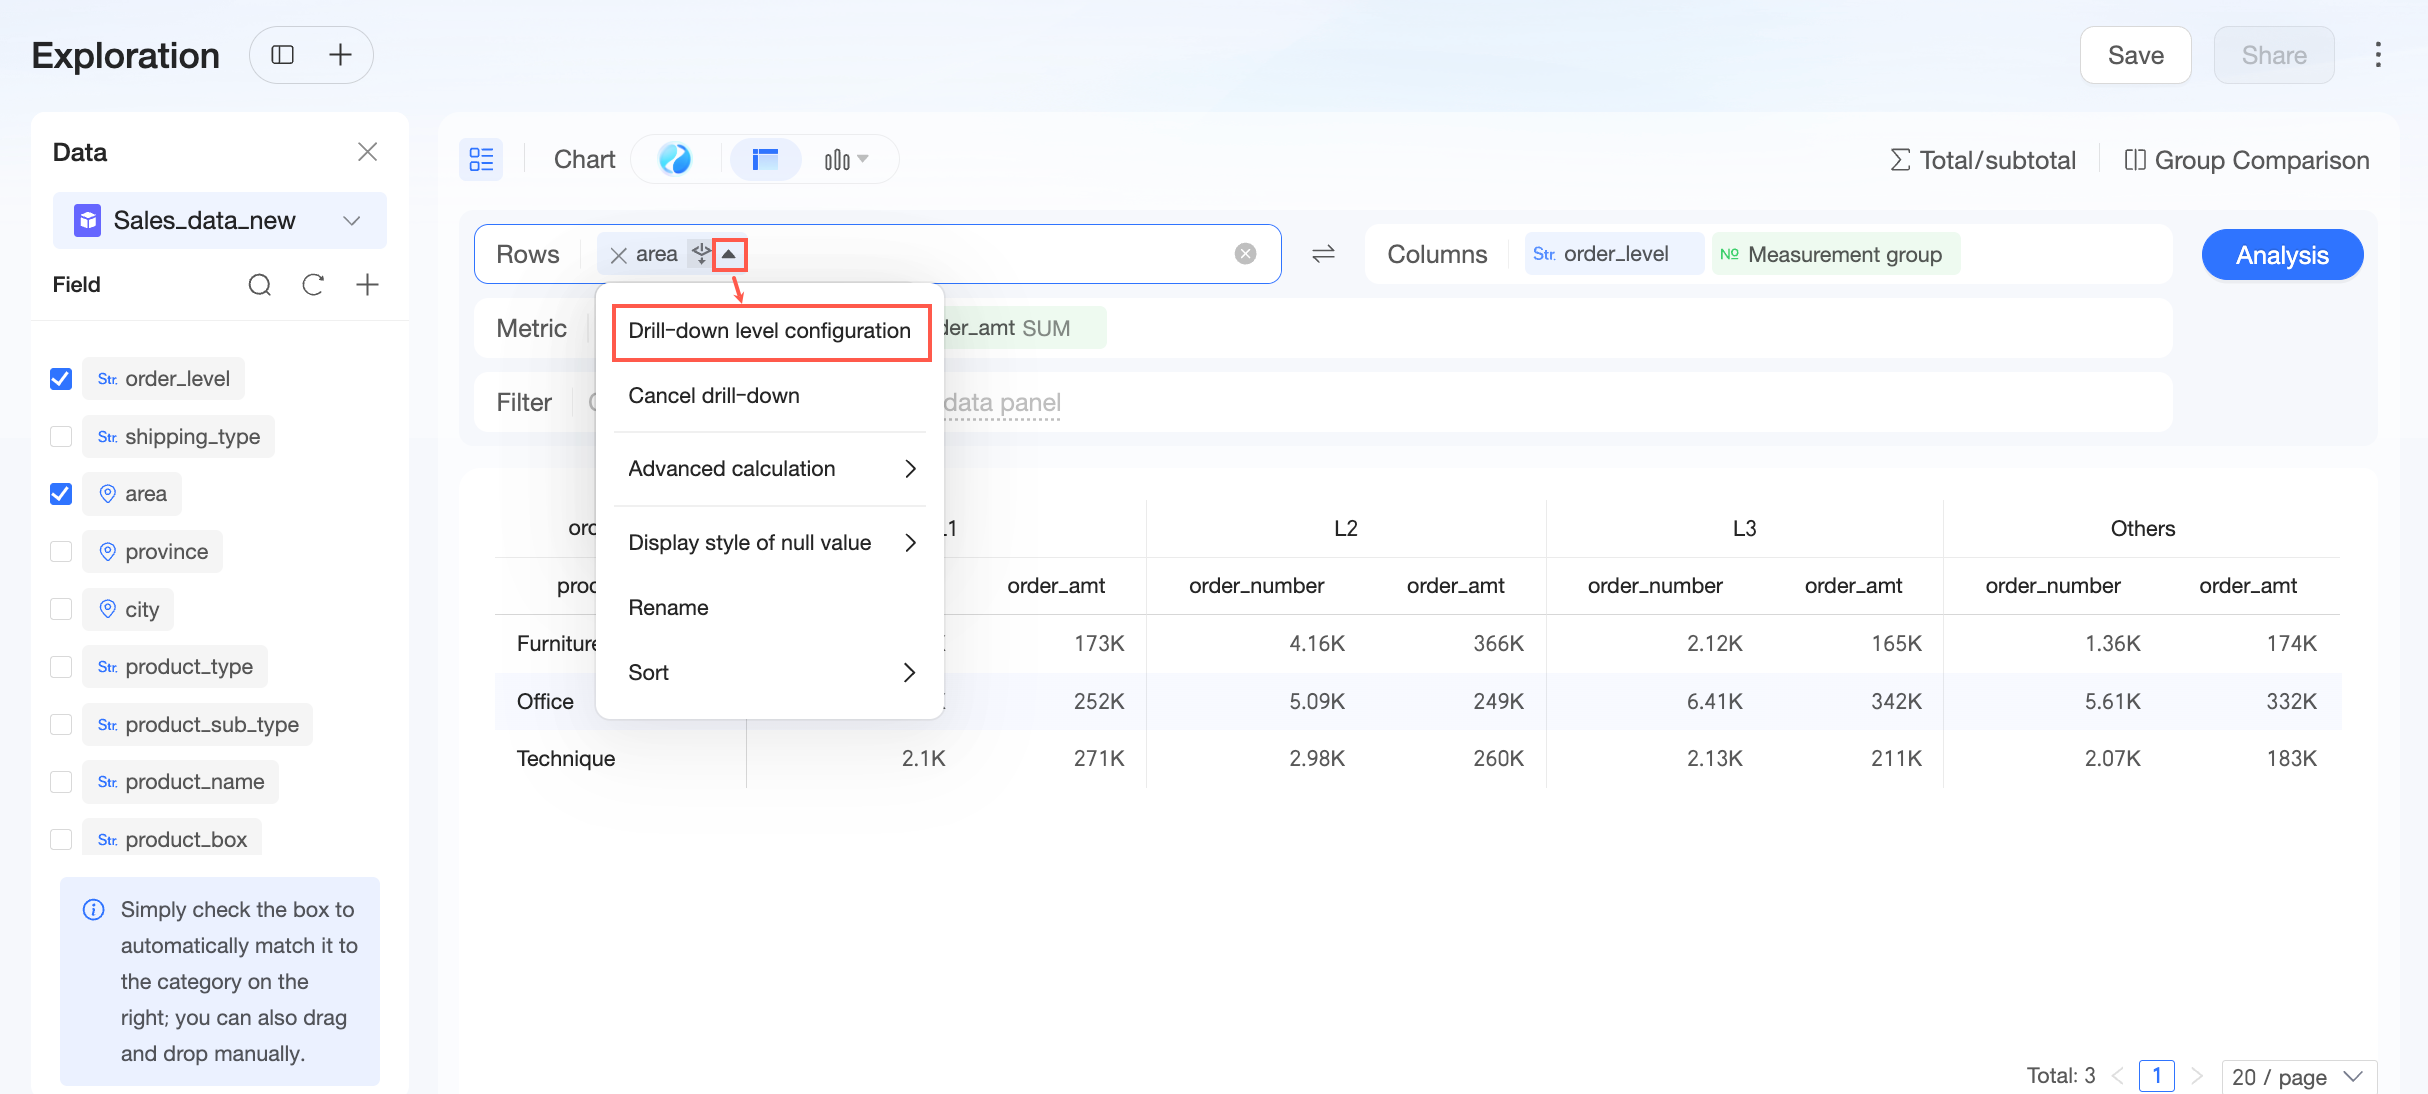
In the Configure drill-down levels pane, you can perform the following operations:
-
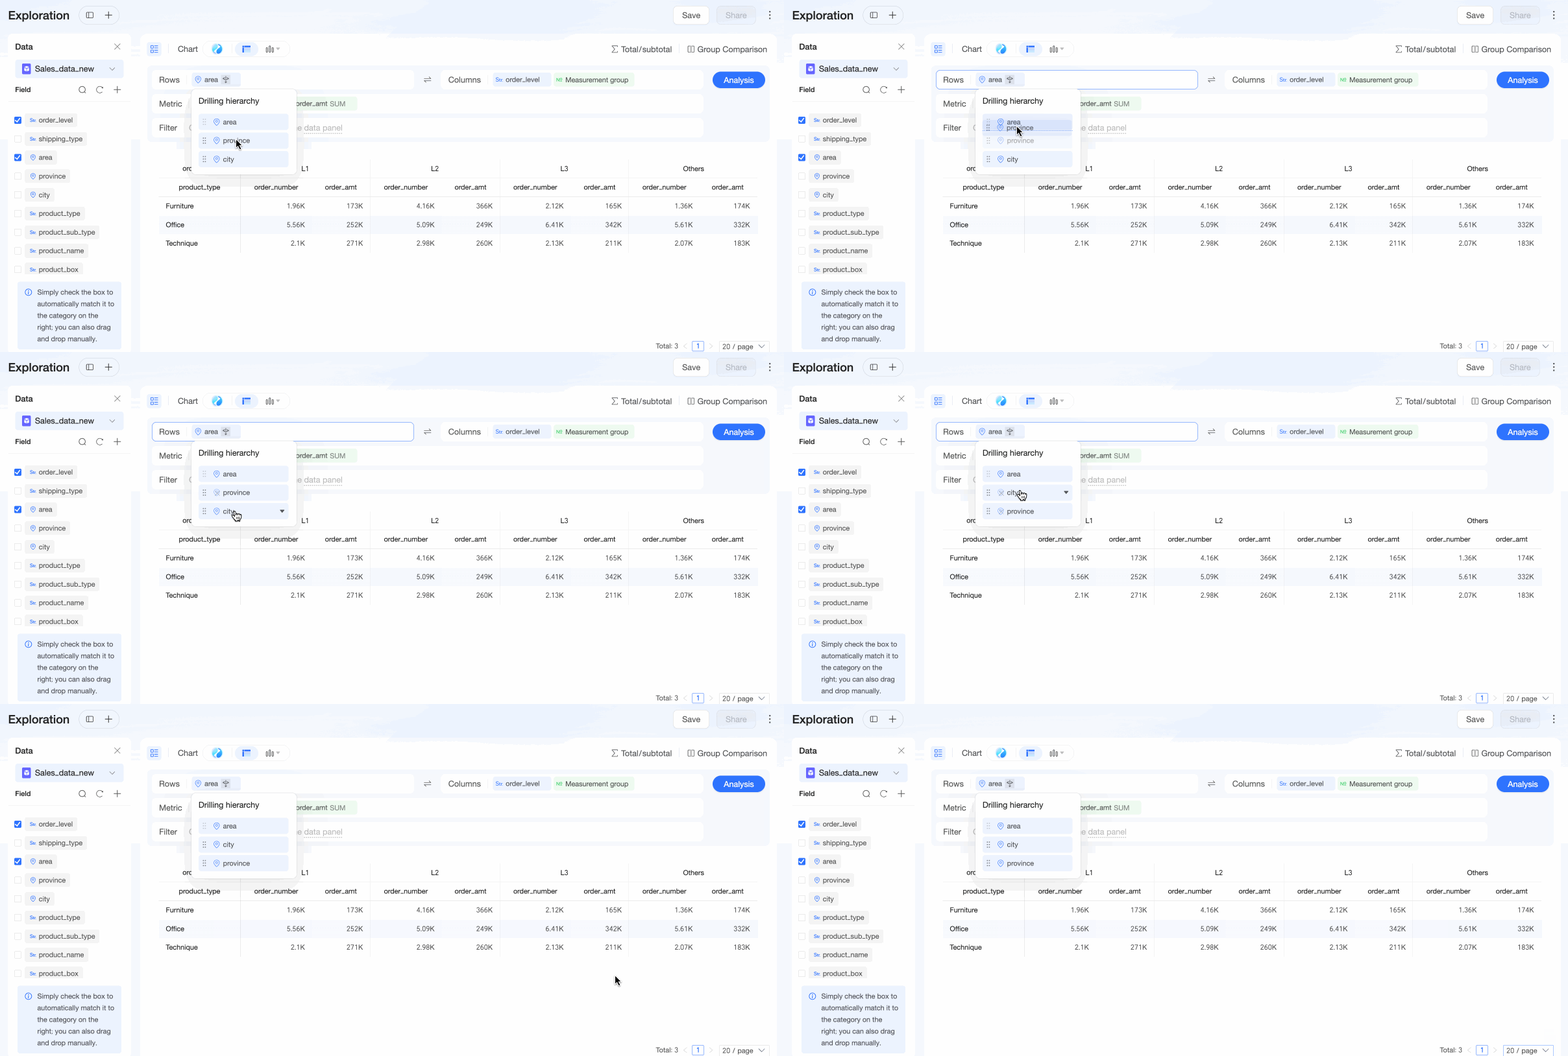
Drag the level fields to adjust the hierarchy.
-
Configure the settings for level fields.
NoteConfigure the settings for the first-level drill-down field (except for helper fields) directly in the chart field configuration area.
-
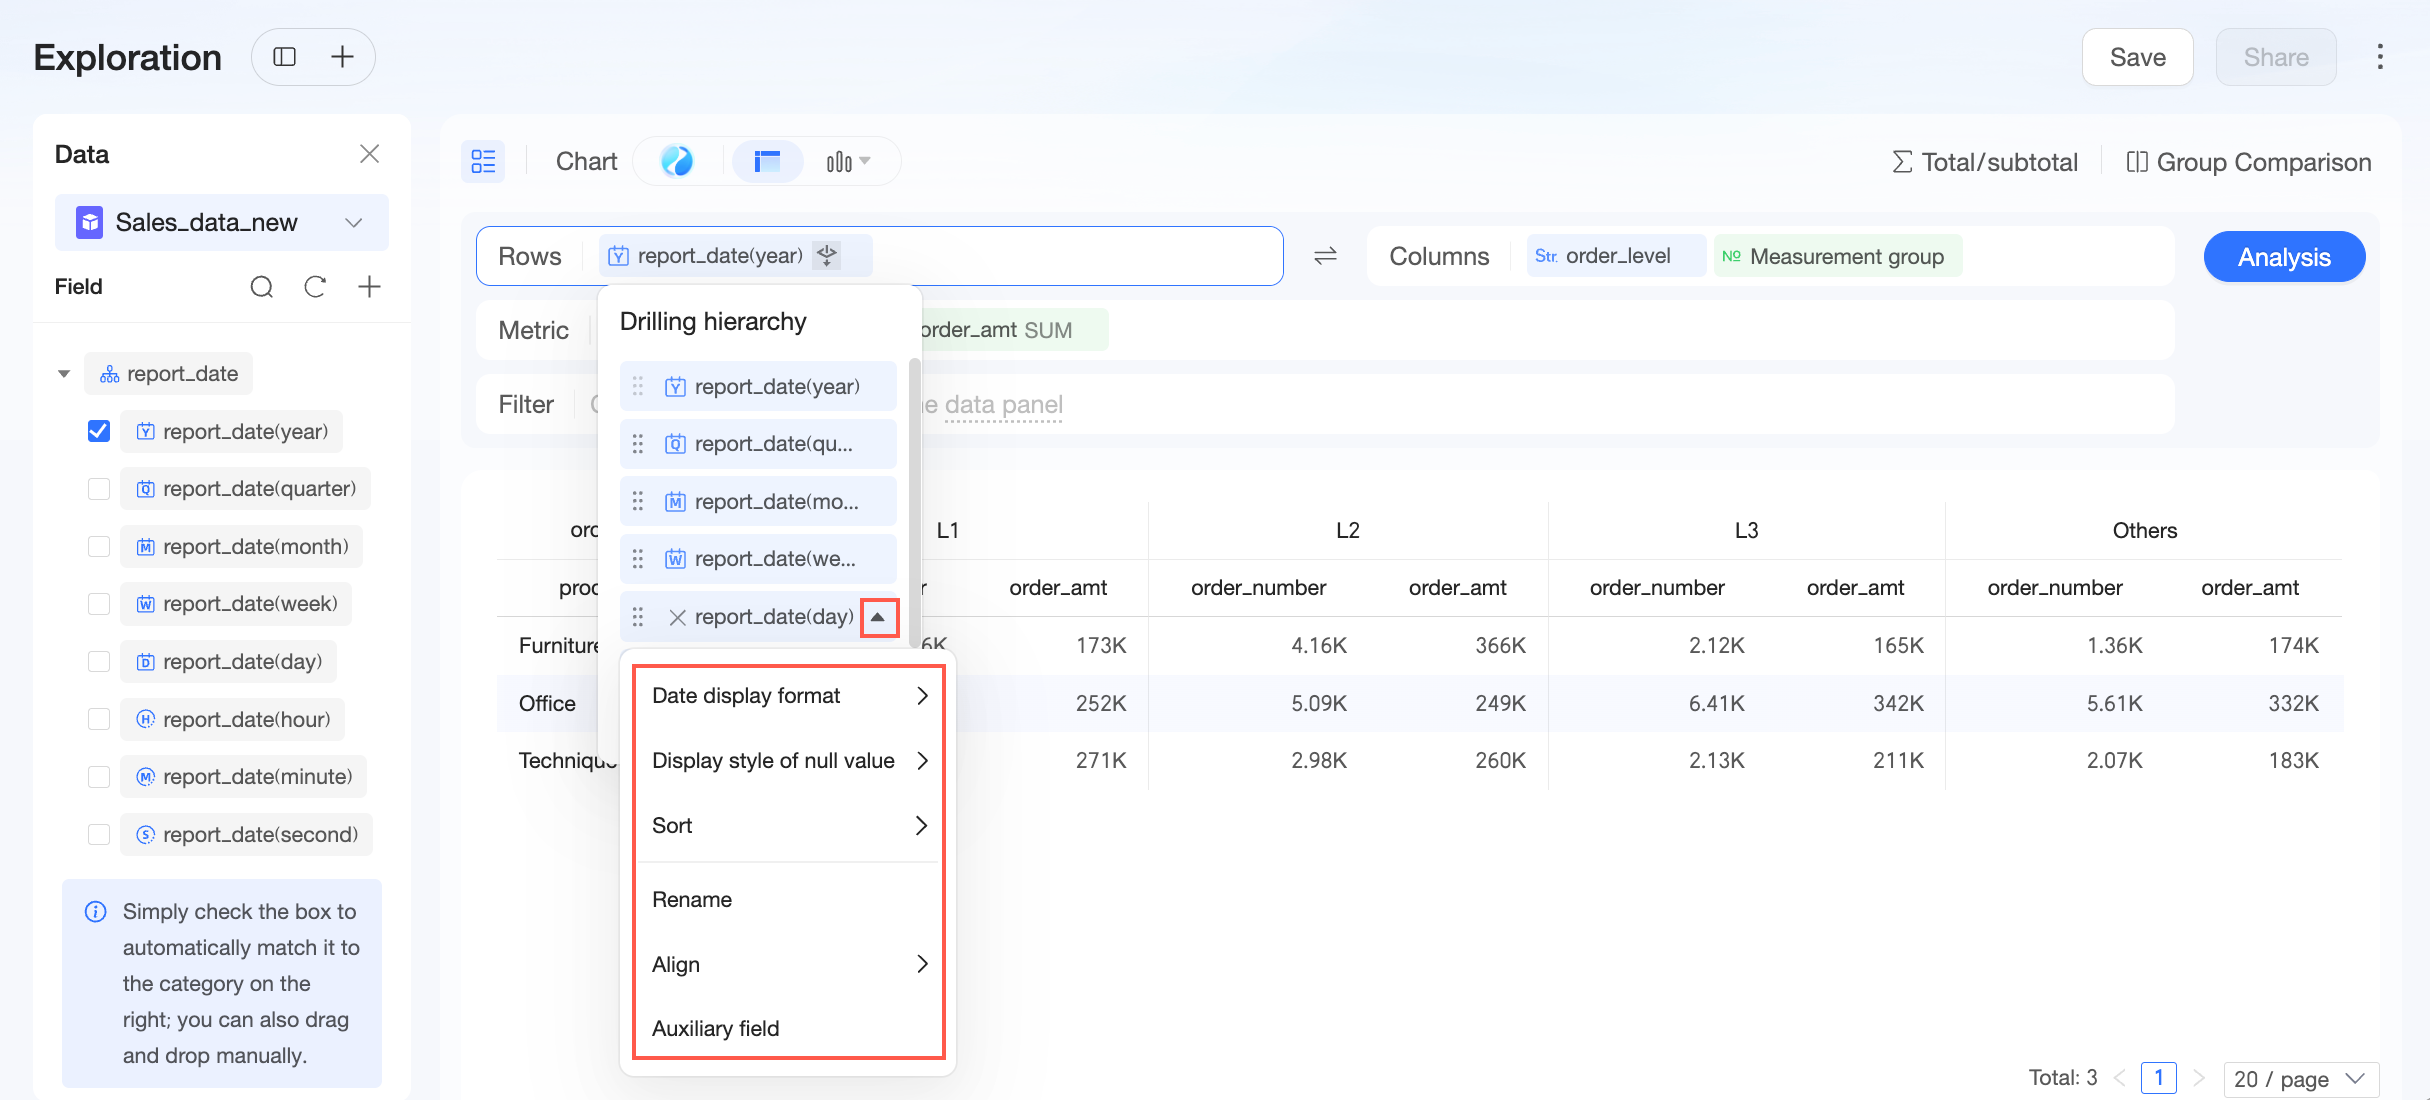
You can set the date display format, sort order, null value display style, and rename the field. These settings are the same as those described in Configure chart fields.
NoteThe date display format is supported only for date fields.
-
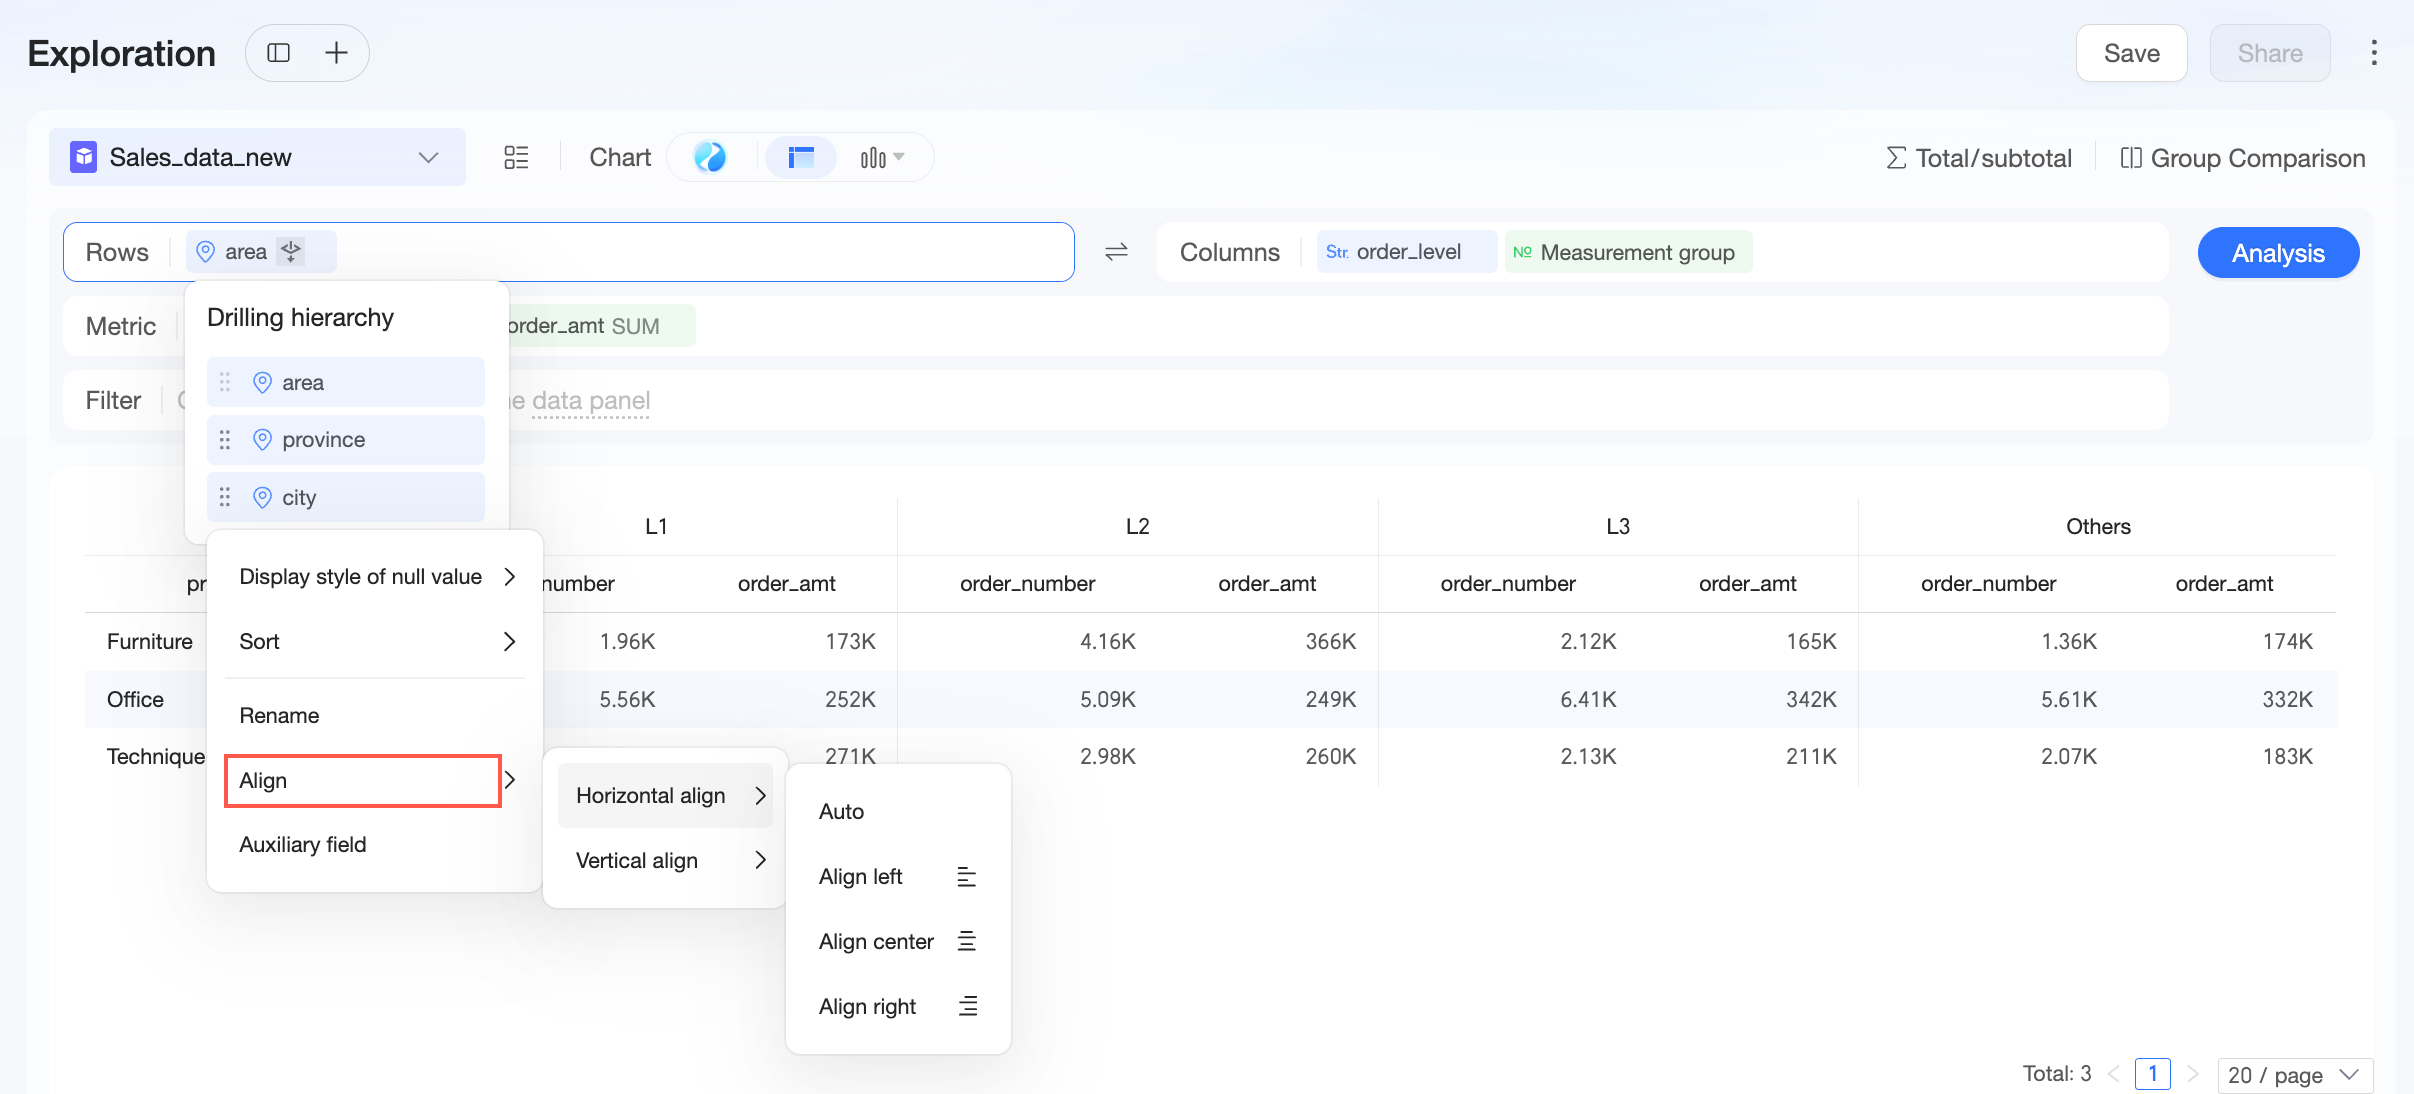
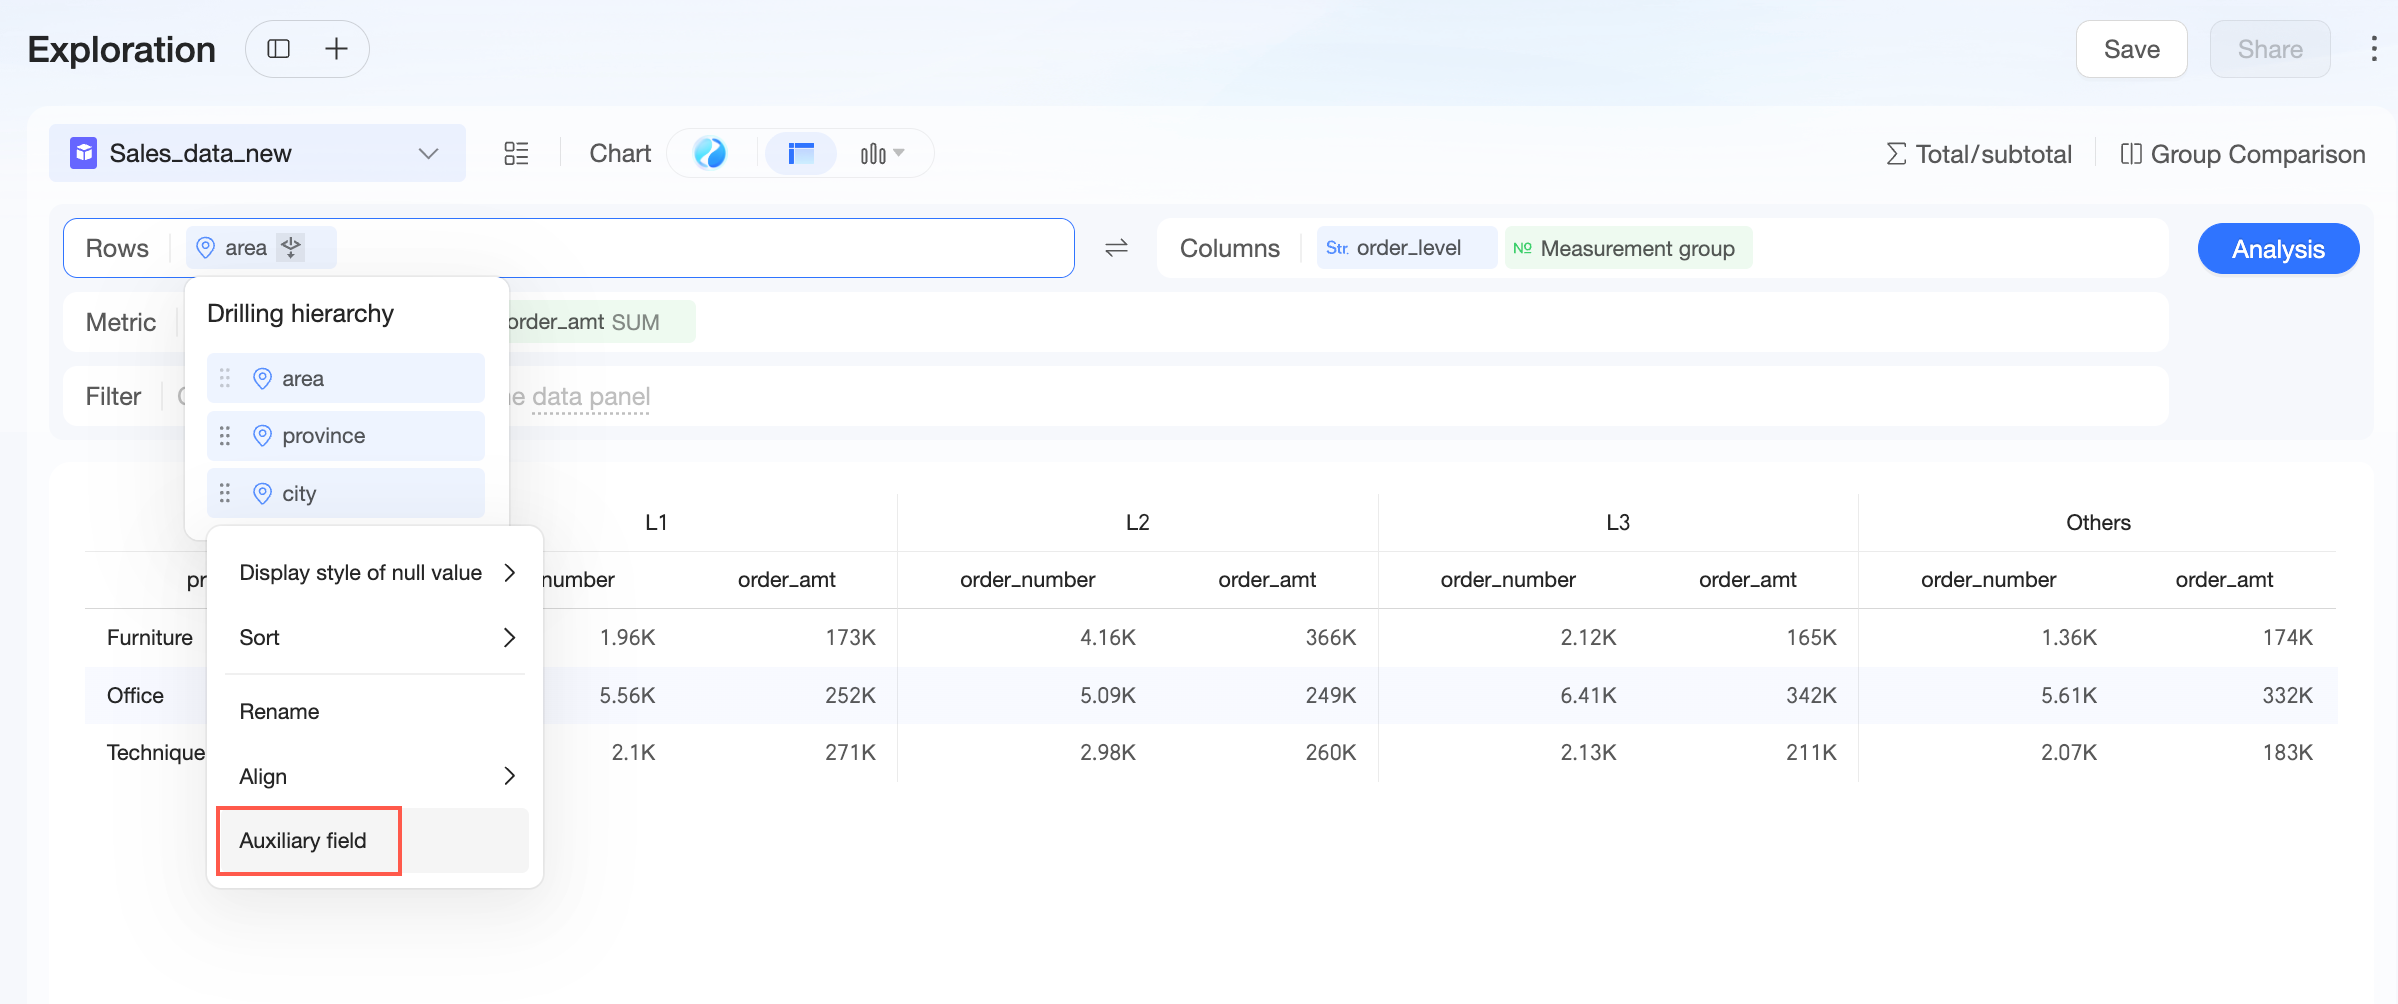
When the chart mode is Table, you can set the alignment and helper field.
-
For alignment, you can set horizontal alignment and vertical alignment.
-
For horizontal alignment, you can select Left, Center, Right, or Auto.
-
For vertical alignment, you can select Top, Middle, Bottom, or Auto.
-
-
A helper field is dynamically added after the drill-down field to provide descriptions or additional information for the main field.
For more information, see Configure drill-down helper fields.
-
-
-
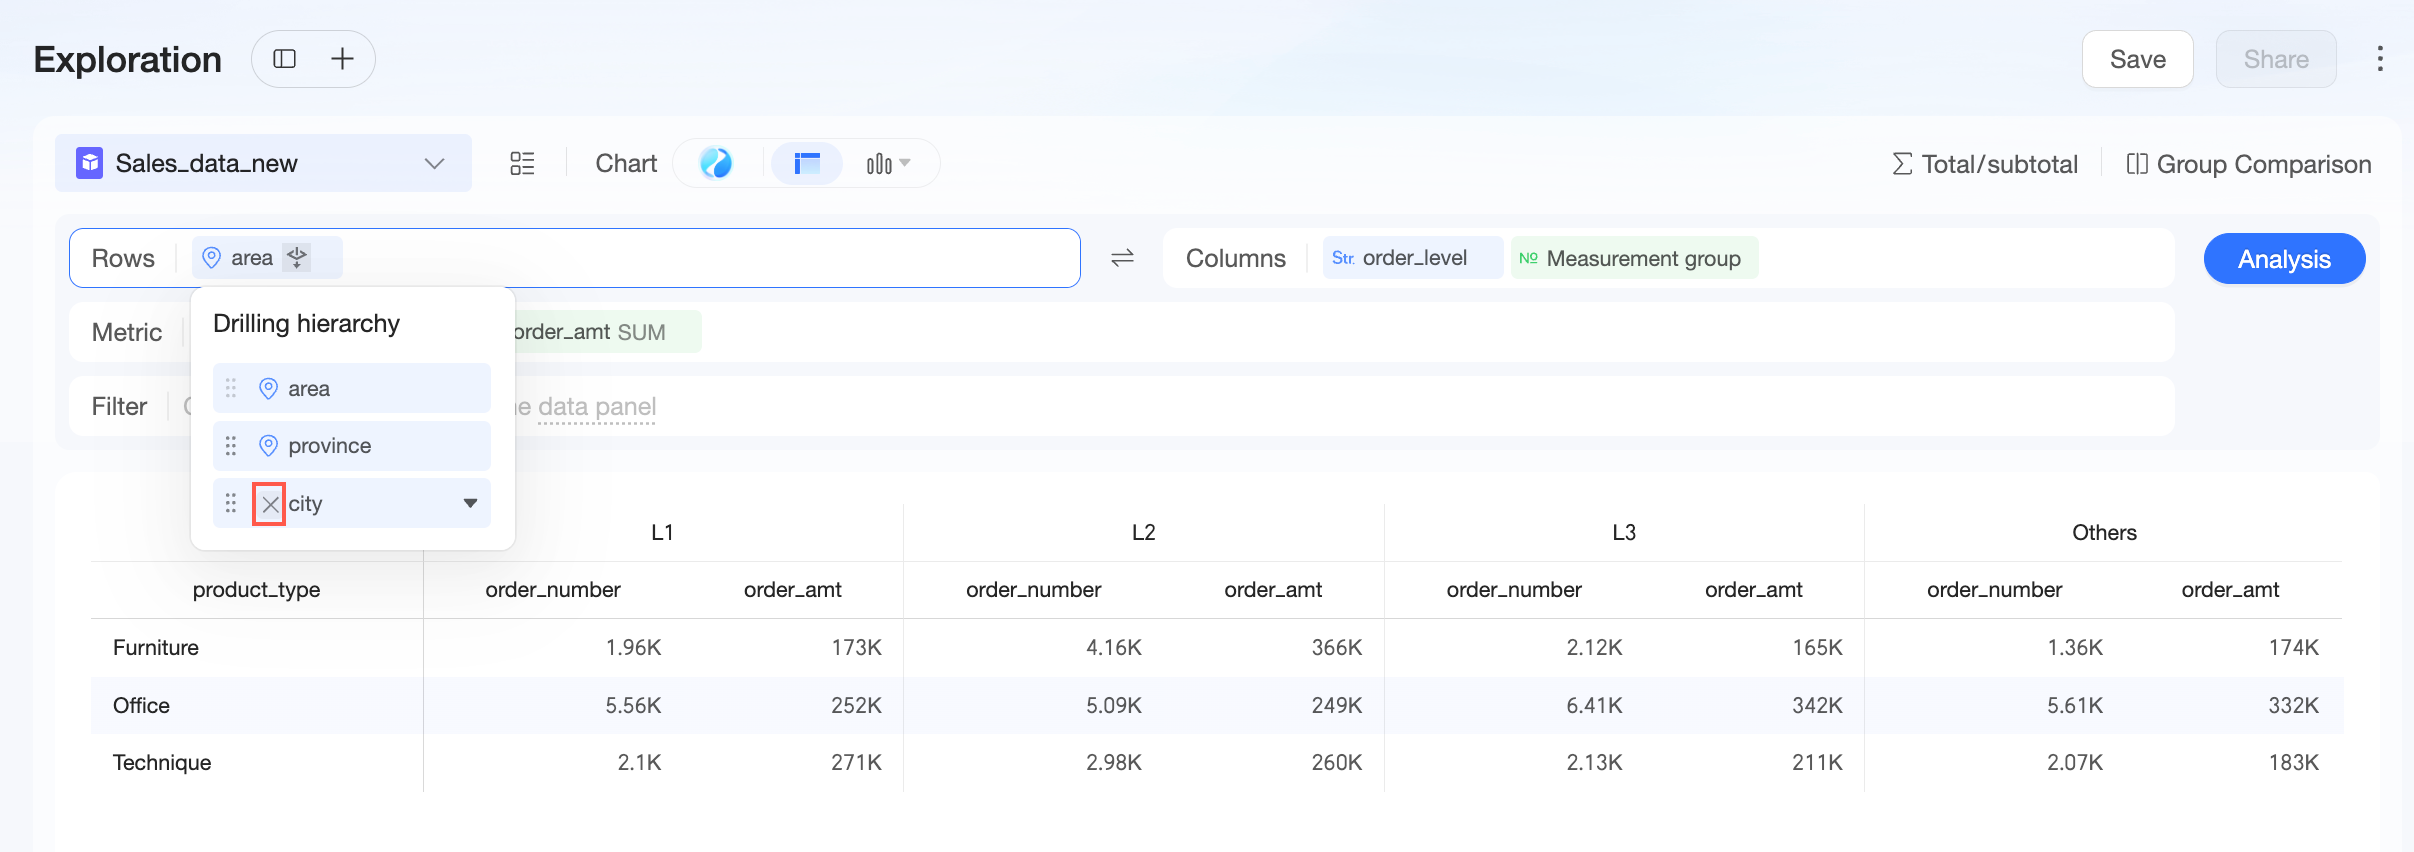
You can delete level fields.
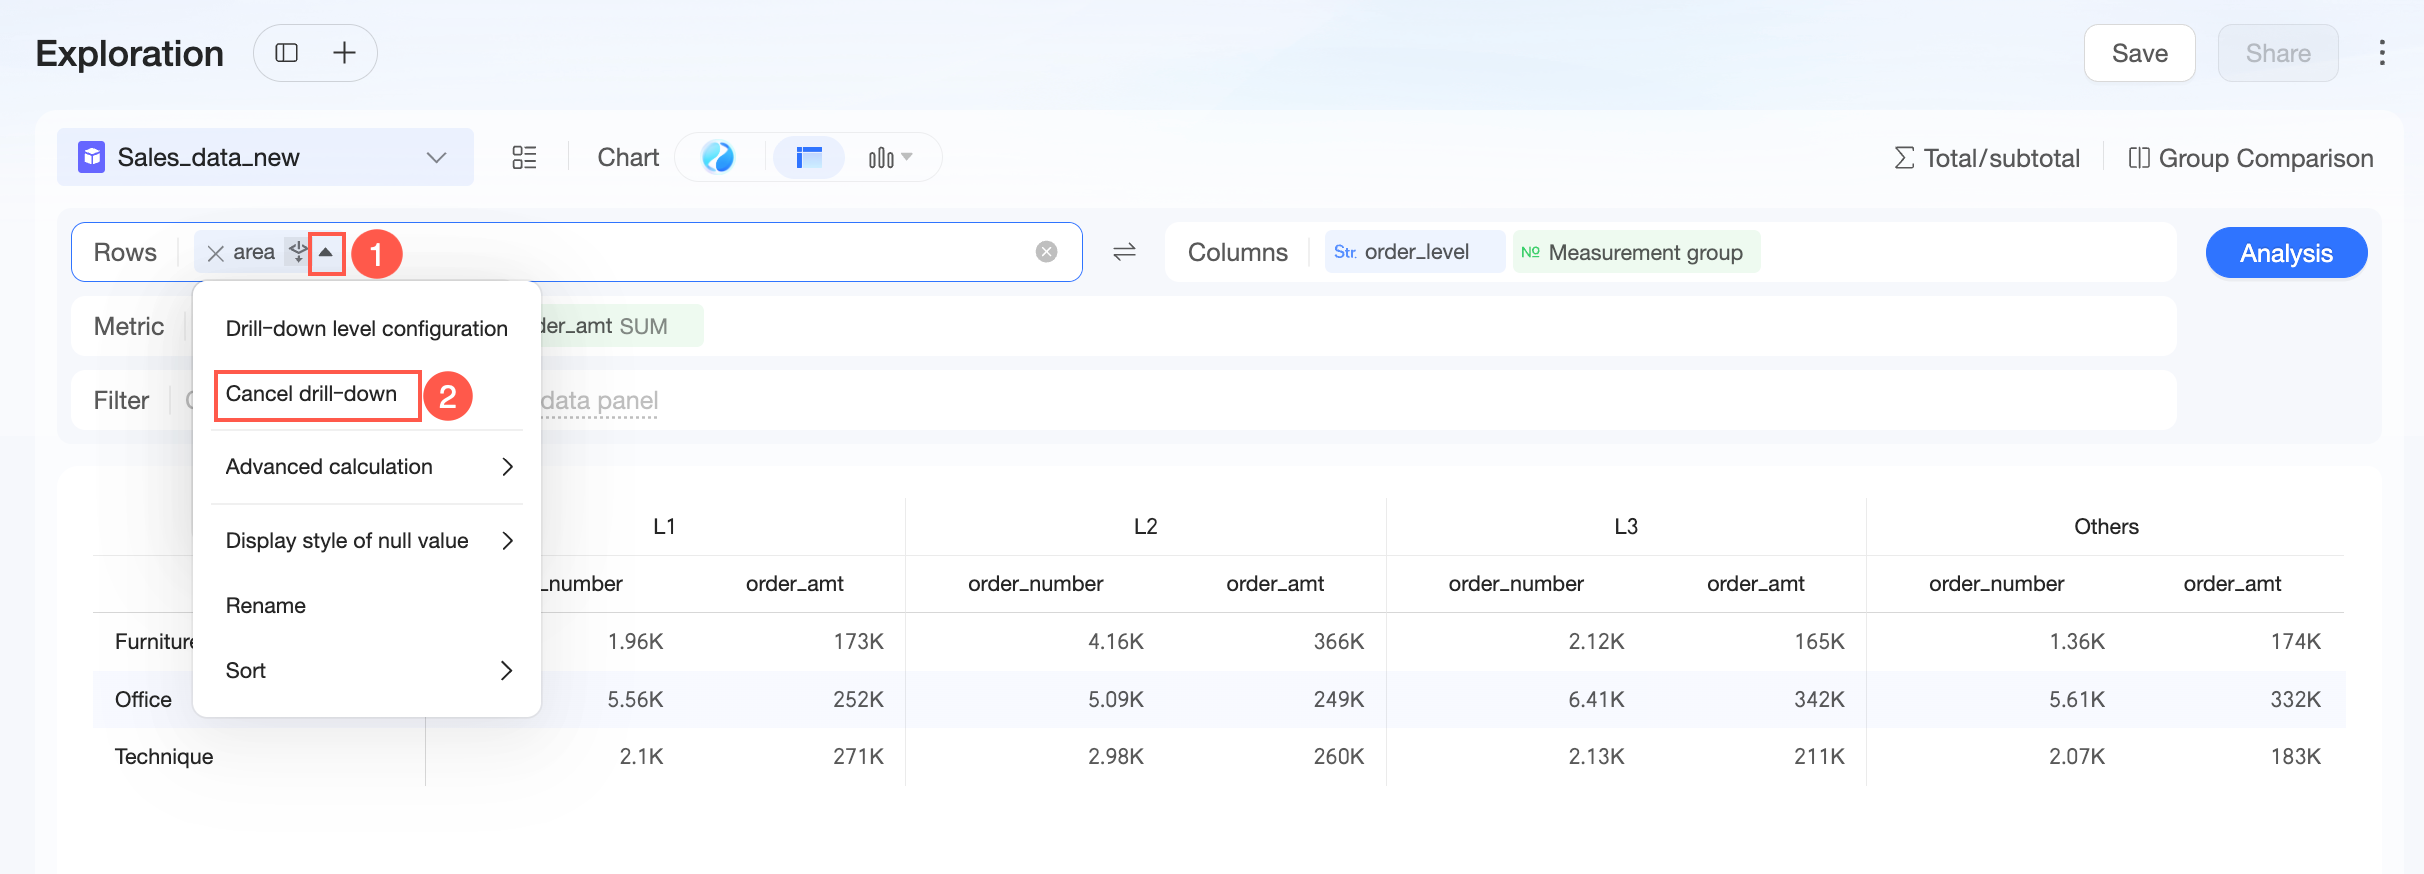
If you no longer need the drill-down feature, click the icon to the right of the drill-down field and select Cancel drill down.
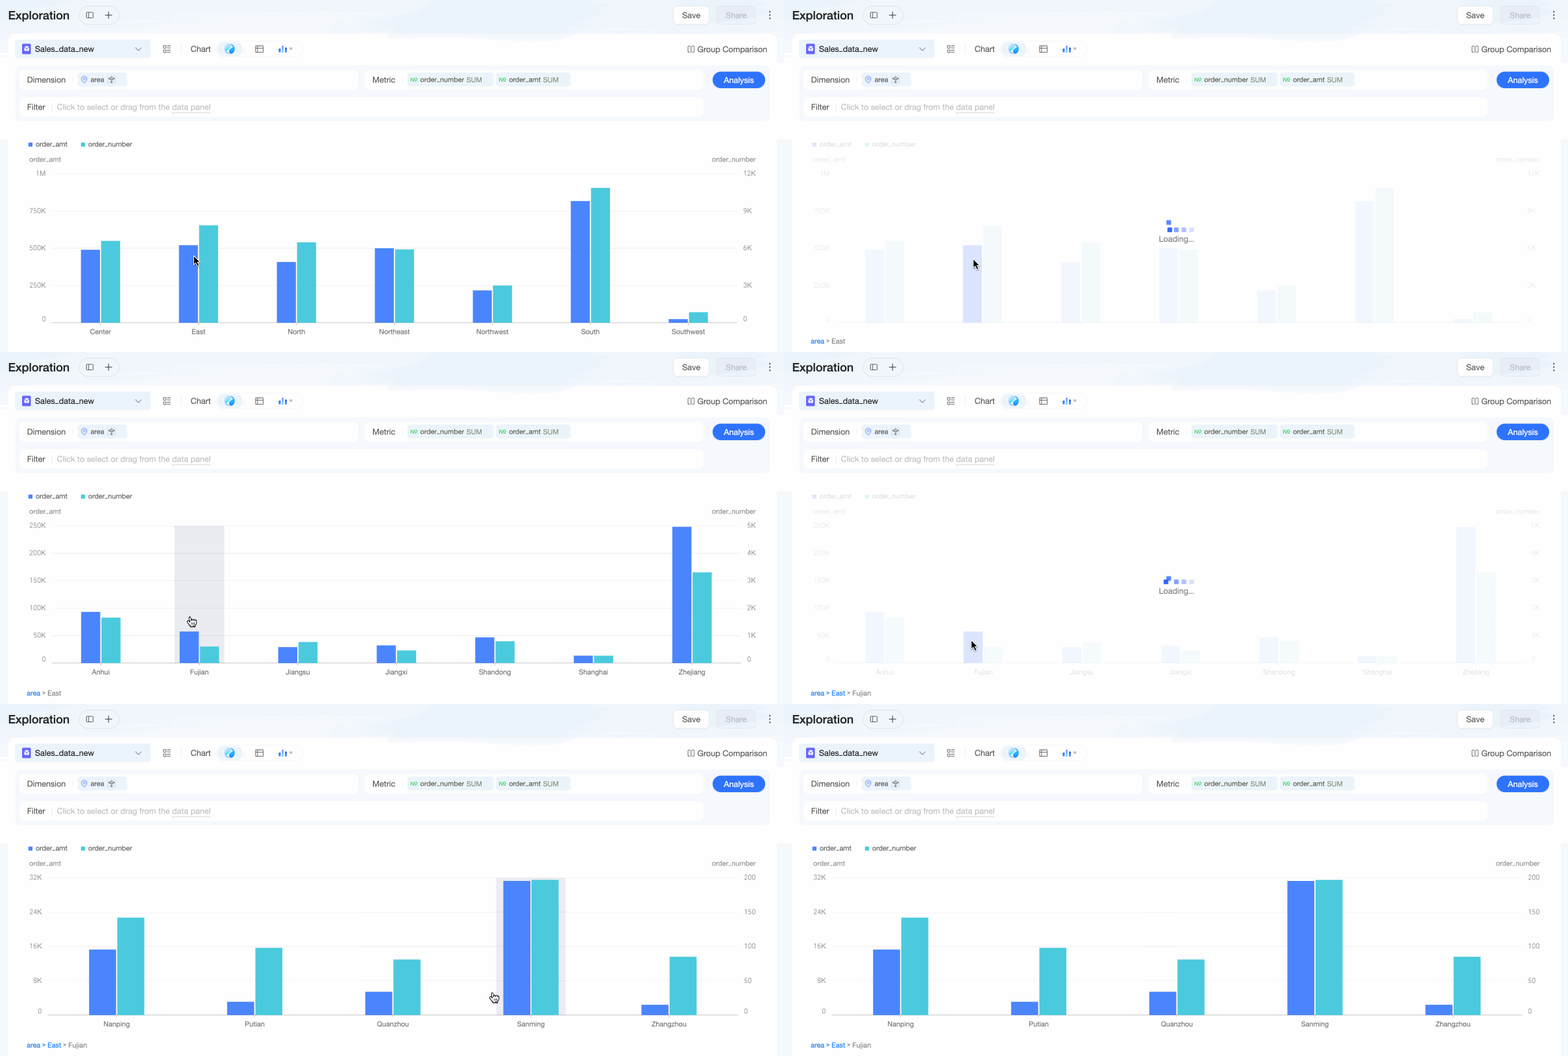
Drill-down example
Generate analysis
After configuring the chart, click Generate analysis to view the results. You can click Generate analysis at any time to preview your changes.