
温度平均值计算
本文以计算五秒温度平均值为例,详细说明如何使用流数据分析预置的算子(统计、窗口等)实现五秒温度平均值的计算并存入数据库中。
本文操作中,步骤一至步骤四主要说明如何计算平均温度,步骤五主要说明如何将计算结果保存到数据库中,步骤六主要说明如何根据需求修改分组维度。步骤五至步骤六为可选步骤,可根据自身需求选择操作。
前提条件
请您确保已创建边缘实例,具体操作请参见专业版环境搭建。
背景信息
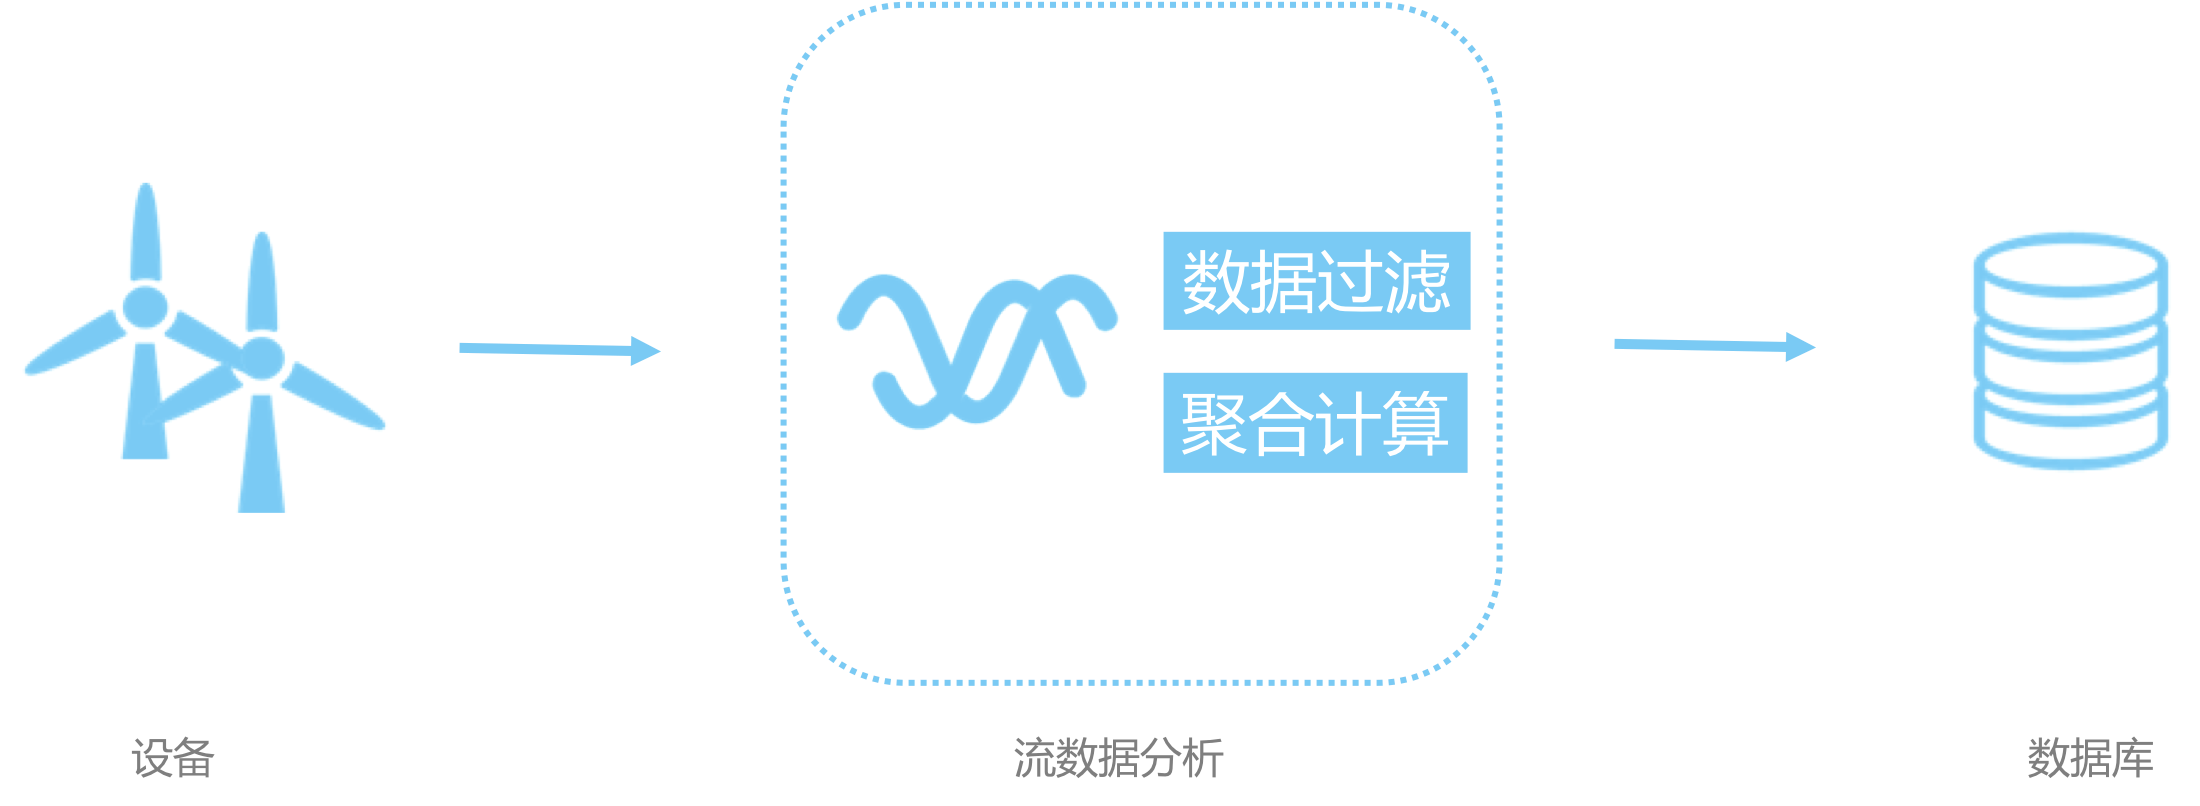
物联网数据有频率高、数据量大、数据变化小、数据价值较低等特点,将数据直接存储或全部上云的性价比非常低。为减少数据存储及传输成本,需要先将数据进行过滤、聚合之后再存储或上云。
例如,在工厂中有一台机器上安装了多个温度传感器,用于检测机器各部位的温度变化,现在需要把这些传感器的状态变化记录下来,以便进行数据分析及问题追溯。由于传感器每次产生的变化都非常小,为节约成本,需要每五秒(真实场景中可能为一分钟甚至会更长,为了让读者更快看到计算结果,本例采用5秒)求一次温度的平均值再存储到数据库中。
一、添加设备
参考设备模拟器章节中使用设备模拟器驱动部分的内容,创建一个使用设备模拟器驱动的设备,并将设备分配到边缘实例中。
- 设备分配到边缘实例后,请先不要部署边缘实例,待完成其他操作后统一部署。
- 若已操作过高温报警示例内容,并创建了温度传感器产品和设备,则无需重复创建。
二、添加流数据分析任务
- 参考流数据任务开发,创建、设置并发布流数据任务。
其中,开发类型选择SQL,运行环境选择边缘。
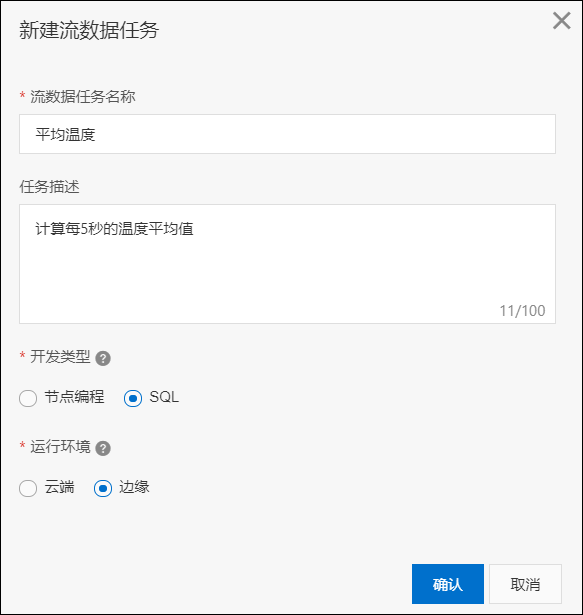
- 系统自动进入流数据任务开发SQL工作台。
复制如下SQL内容到编辑框中。
-- 计算5秒平均温度,并将结果输出到本地文件中 -- 定义数据源表 create table property ( propertyName varchar, propertyValue varchar, productKey varchar, deviceName varchar, ts varchar, -- 属性变化的时间 tstamp as to_timestamp (cast (ts as bigint)), -- ts为long型字符串,单位为毫秒,需要转化为时间戳格式 WATERMARK wk FOR tstamp as withOffset (tstamp, 2000) -- 使用时间窗口必须要在源表定义时声明Watermark。Watermark是插入到数据流中的一种特殊的数据,Watermark上带了一个时间戳,其含义是:在这个之后不会收到小于或等于该时间戳的数据。假设数据的乱序程度是1分钟,也就是说等1分钟之后,绝大部分迟到的数据都到了,那么我们就可以定义watermark计算方式为偏移1分钟。2000表示偏移为2秒 ) with ( type = 'edgebus', jsonParser = 'device_property' ); -- 定义数据结果表 create table output ( productKey varchar, deviceName varchar, avg_temperature double, t_start timestamp, t_end timestamp ) with ( type = 'file', -- 定义了结果表类型,file表示将结果输出到文件中 filePath = '/linkedge/run/debug/case02_avg_temperature.txt' -- 定义了输出的文件路径 ); -- 计算平均温度并写入结果表中 insert into output select productKey, deviceName, avg (temperature) as avg_temperature, -- 计算平均温度 tumble_start (tstamp, interval '5' second), -- 时间窗口开始时间(时间窗口长度为5秒) tumble_end (tstamp, interval '5' second) -- 时间窗口结束时间(时间窗口长度为5秒) from ( select productKey, deviceName, cast (propertyValue as int) as temperature, tstamp from property where propertyName = 'temperature' -- 筛选出温度属性 ) where temperature >= 0 and temperature <=100 -- 数据过滤,只计算合法数据 group by tumble (tstamp, interval '5' second), -- 按时间窗口维度分组计算(时间窗口长度为5秒) productKey, -- 按productKey维度分组计算 deviceName; -- 按deviceName维度分组计算 - 保存任务并发布。
- 将该SQL任务分配到边缘实例中,具体操作请参见分配流数据分析到边缘实例。
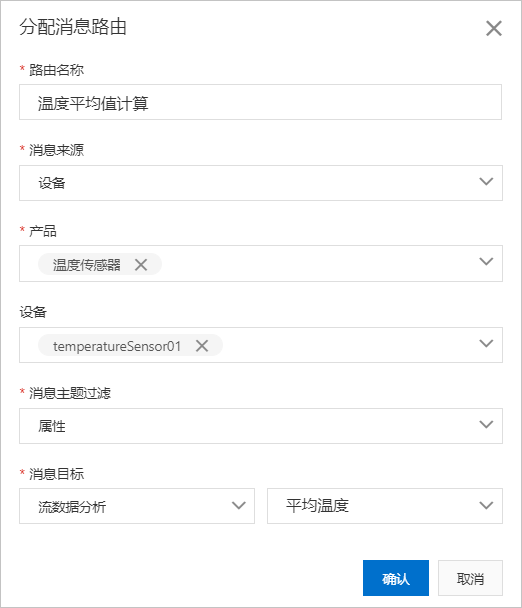
三、添加消息路由
在边缘实例的实例详情页面,选择消息路由,将温度传感器的属性变化数据路由到平均温度的流数据分析任务中。
四、部署边缘实例
- 在边缘实例的实例详情页面,单击部署,将子设备、流数据分析作业及消息路由下发到边缘端。
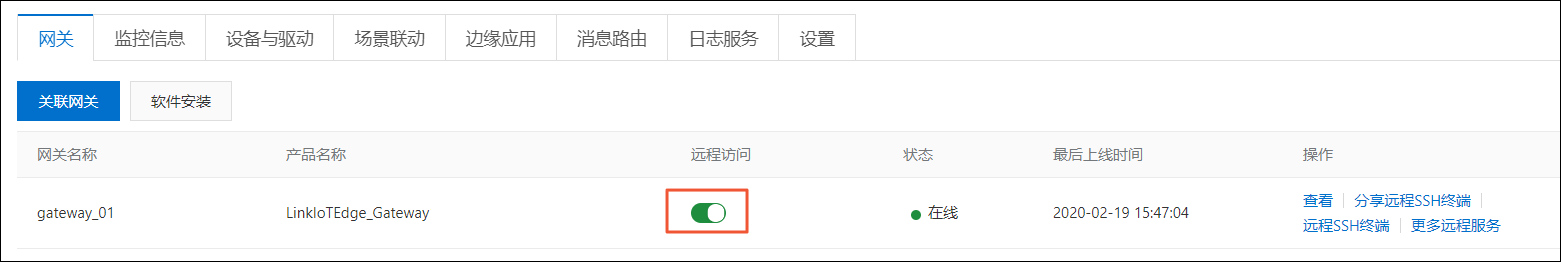
- 在实例详情页面网关页签,单击网关名称右侧的远程SSH终端,打开两个远程控制台,例如远程控制台1和远程控制台2。远程控制台1用于改变温度传感器温度值,远程控制台2用于查看计算结果。
说明 需要您先打开网关名称右侧的远程访问按钮,远程SSH终端才可以使用。
- 在远程控制台2,执行
tail -f /linkedge/run/debug/case01_high_temperature_alarm.txt命令 ,查看输出结果。在有数据产生的情况下,计算结果每五秒产生一次。 - 在远程控制台1,进入/linkedge/gateway/build/bin目录,多次执行./ds_ctrl property a1WuxHr**** temperatureSensor01 '{"temperature":30}'命令,改变温度传感器状态,温度值可以在30、31两个数值间不断变化,5秒后将会在远程控制台2可看到如下信息。
2019-01-30 15:46:43.045 -> a1WuxHr****,temperatureSensor01,30.5,2019-01-30 15:46:35.0,2019-01-30 15:46:40.0执行25秒后可看到如下信息。2019-01-30 15:46:43.045 -> a1WuxHr****,temperatureSensor01,30.5,2019-01-30 15:46:35.0,2019-01-30 15:46:40.0 2019-01-30 15:46:49.783 -> a1WuxHr****,temperatureSensor01,30.5,2019-01-30 15:46:40.0,2019-01-30 15:46:45.0 2019-01-30 15:46:53.096 -> a1WuxHr****,temperatureSensor01,30.666666666666668,2019-01-30 15:46:45.0,2019-01-30 15:46:50.0 2019-01-30 15:46:58.119 -> a1WuxHr****,temperatureSensor01,30.333333333333332,2019-01-30 15:46:50.0,2019-01-30 15:46:55.0 2019-01-30 15:47:02.710 -> a1WuxHr****,temperatureSensor01,30.833333333333332,2019-01-30 15:46:55.0,2019-01-30 15:47:00.0
五、(可选)保存温度平均值计算结果到数据库
- 在数据库中创建表。
- (可选)新建一个RDS实例,或者在搭建边缘环境的机器上安装一个MySQL数据库(也可以跨机器安装,但必须保证两台机器网络互通)。安装命令如下所示。
说明 若已有MySQL数据库(本地数据库或RDS),可直接跳过本步骤。
sudo docker run --name mysql -p your_db_port:3306 -e MYSQL_ROOT_PASSWORD=your_db_password -d mysql:5.6.35其中,your_db_port为在宿主机(即启动mysql docker的机器)访问数据库的端口号,your_db_password为数据库root账户的密码,请根据实际情况更改。例如,端口号为1234,密码为xxxxxxxx,则实例执行的命令为。
sudo docker run --name mysql -p 1234:3306 -e MYSQL_ROOT_PASSWORD=xxxxxxxx -d mysql:5.6.35 - 为了保证数据库用户名密码的安全性,您需要把数据库用户名密码保存在配置中心(会加密后再存储)。按如下方式设置。
- 在物联网平台控制台左侧导航栏中,单击。
- 在相应的边缘实例右侧单击查看,进入实例详情页面,在网关页签下单击远程SSH终端,登录远程控制台,执行如下命令。
cd /linkedge/gateway/build/bin ./tool_config -s local_db_username root ./tool_config -s local_db_password xxxxxxxx - 查看数据库host,即安装MySQL的宿主机IP。在宿主机上执行
ifconfig命令可看到如下结果。lo0: flags=8049<UP,LOOPBACK,RUNNING,MULTICAST> mtu 16384 options=1203<RXCSUM,TXCSUM,TXSTATUS,SW_TIMESTAMP> inet 127.0.0.1 netmask 0xff000000 inet6 ::1 prefixlen 128 inet6 fe80::1%lo0 prefixlen 64 scopeid 0x1 nd6 options=201<PERFORMNUD,DAD> gif0: flags=8010<POINTOPOINT,MULTICAST> mtu 1280 stf0: flags=0<> mtu 1280 XHC0: flags=0<> mtu 0 XHC20: flags=0<> mtu 0 en0: flags=8863<UP,BROADCAST,SMART,RUNNING,SIMPLEX,MULTICAST> mtu 1500 ether f0:18:98:37:81:b4 inet6 fe80::1c6e:7a87:1c27:724d%en0 prefixlen 64 secured scopeid 0x6 inet 30.43.83.169 netmask 0xfffff000 broadcast 30.43.95.255 nd6 options=201<PERFORMNUD,DAD> media: autoselect status: active其中,inet参数后的
30.43.83.169为宿主机对外IP,即数据库host(用于流数据分析任务中替换your_db_host)。 - 下载mysql-client命令行工具或者mysql-client图形化工具(如Navicat、Sequel Pro),进行MySQL数据库的访问,并创建
iot_data数据库,用于在流数据分析任务中替换your_db_name参数 。CREATE DATABASE iot_data; USE iot_data; - 创建名为
table_case_02的表,用于在流数据分析任务会中替换your_table_name参数。CREATE TABLE table_case_02 ( id INT UNSIGNED NOT NULL AUTO_INCREMENT PRIMARY KEY, productKey varchar(255), deviceName varchar(255), avg_temperature double NOT NULL, t_start timestamp NOT NULL, t_end timestamp NOT NULL );
- (可选)新建一个RDS实例,或者在搭建边缘环境的机器上安装一个MySQL数据库(也可以跨机器安装,但必须保证两台机器网络互通)。安装命令如下所示。
- 更新流数据分析任务,并将结果存入数据库。
在实例详情页面流数据分析页签,单击流数据任务后的查看,进入流数据任务开发SQL工作台页面撤回任务,并将任务内容改为如下SQL后保存并发布。
-- 计算5秒平均温度,并将结果输出到数据库中 -- 定义数据源表 create table property ( propertyName varchar, propertyValue varchar, productKey varchar, deviceName varchar, ts varchar, -- 属性变化的时间 tstamp as to_timestamp (cast (ts as bigint)), -- ts为long型字符串,单位为毫秒,需要转化为时间戳格式 WATERMARK wk FOR tstamp as withOffset (tstamp, 2000) -- 使用时间窗口必须要在源表定义时声明Watermark。Watermark是插入到数据流中的一种特殊的数据,Watermark上带了一个时间戳,其含义是:在这个之后不会收到小于或等于该时间戳的数据。假设数据的乱序程度是1分钟,也就是说等1分钟之后,绝大部分迟到的数据都到了,那么我们就可以定义watermark计算方式为偏移1分钟。2000表示偏移为2秒 ) with ( type = 'edgebus', jsonParser = 'device_property' ); -- 定义数据结果表[此处为变化部分,由之前的文件改成了数据库] create table output ( productKey varchar, deviceName varchar, avg_temperature double, t_start timestamp, t_end timestamp ) with ( type = 'rds', url='jdbc:mysql://30.43.83.169:1234/iot_data', -- 格式:'jdbc:mysql://your_db_host:your_db_port/your_db_name' tableName = 'table_case_02', -- your_table_name userName = 'config://local_db_username', -- local_db_username为在配置中存储的用户名的key password = 'config://local_db_password' -- local_db_password为在配置中存储的密码的key ); -- 计算平均温度并写入结果表中 insert into output select productKey, deviceName, avg (temperature) as avg_temperature, -- 计算平均温度 tumble_start (tstamp, interval '5' second), -- 时间窗口开始时间(时间窗口长度为5秒) tumble_end (tstamp, interval '5' second) -- 时间窗口结束时间(时间窗口长度为5秒) from ( select productKey, deviceName, cast (propertyValue as int) as temperature, tstamp from property where propertyName = 'temperature' -- 筛选出温度属性 ) where temperature >= 0 and temperature <=100 group by tumble (tstamp, interval '5' second), -- 按时间窗口维度分组计算(时间窗口长度为5秒) productKey, -- 按productKey维度分组计算 deviceName; -- 按deviceName维度分组计算 - 部署边缘实例并查看设备运行结果。
- 在边缘实例的实例详情页面,单击部署,将子设备、流数据分析任务及消息路由下发到边缘端。
- 在实例详情页面网关页签下,单击网关右侧的远程SSH终端进入远程控制台。
- 在远程控制台中,进入/linkedge/gateway/build/bin目录,多次执行如下命令,每次执行时改变temperature参数后的值。
./ds_ctrl property a1WuxHr**** temperatureSensor01 '{"temperature":30}'5秒后可在数据库中看到类似如下数据。mysql> select * from table_case_02; +----+-------------+---------------------+-----------------+---------------------+---------------------+ | id | productKey | deviceName | avg_temperature | t_start | t_end | +----+-------------+---------------------+-----------------+---------------------+---------------------+ | 1 | a1WuxHr**** | temperatureSensor01 | 31 | 2019-01-30 16:05:30 | 2019-01-30 16:05:35 | | 2 | a1WuxHr**** | temperatureSensor01 | 30 | 2019-01-30 16:05:35 | 2019-01-30 16:05:40 | | 3 | a1WuxHr**** | temperatureSensor01 | 31.6 | 2019-01-30 16:05:40 | 2019-01-30 16:05:45 | +----+-------------+---------------------+-----------------+---------------------+---------------------+ 3 rows in set (0.00 sec)
六、(可选)增加数据计算维度
- 添加一个温度传感器。
- 参考一、添加设备内容,再添加一个温度传感器设备temperatureSensor02。
- 将温度传感器temperatureSensor02的属性变化数据,路由到平均温度的流数据分析任务中。
- 参考四、部署边缘实例内容,部署边缘实例并查看设备运行状态。
需多次改变温度传感器temperatureSensor01和temperatureSensor02状态,每5秒可在数据库中看到两条结果(每个传感器产生一条结果)。
mysql> select * from table_case_02 order by t_start desc limit 10;
+----+-------------+---------------------+-----------------+---------------------+---------------------+
| id | productKey  | deviceName          | avg_temperature | t_start             | t_end               |
+----+-------------+---------------------+-----------------+---------------------+---------------------+
| 24 | a1WuxHr**** | temperatureSensor02 |              31 | 2019-01-30 16:31:30 | 2019-01-30 16:31:35 |
| 25 | a1WuxHr**** | temperatureSensor01 |              31 | 2019-01-30 16:31:30 | 2019-01-30 16:31:35 |
| 23 | a1WuxHr**** | temperatureSensor01 |              30 | 2019-01-30 16:31:25 | 2019-01-30 16:31:30 |
| 22 | a1WuxHr**** | temperatureSensor02 |              30 | 2019-01-30 16:31:25 | 2019-01-30 16:31:30 |
| 21 | a1WuxHr**** | temperatureSensor02 |            30.5 | 2019-01-30 16:31:20 | 2019-01-30 16:31:25 |
| 20 | a1WuxHr**** | temperatureSensor01 |            30.5 | 2019-01-30 16:31:20 | 2019-01-30 16:31:25 |
| 19 | a1WuxHr**** | temperatureSensor02 |              31 | 2019-01-30 16:31:15 | 2019-01-30 16:31:20 |
| 18 | a1WuxHr**** | temperatureSensor01 |              31 | 2019-01-30 16:31:15 | 2019-01-30 16:31:20 |
| 17 | a1WuxHr**** | temperatureSensor01 |              31 | 2019-01-30 16:31:10 | 2019-01-30 16:31:15 |
| 16 | a1WuxHr**** | temperatureSensor02 |              31 | 2019-01-30 16:31:10 | 2019-01-30 16:31:15 |
+----+-------------+---------------------+-----------------+---------------------+---------------------+
10 rows in set (0.00 sec)
- 求所有传感器的平均温度。
将本文中的SQL按时间窗口、productKey、deviceName三个维度进行分组计算,可以计算出每个温度传感器5秒的平均温度。若在某些不需要关注每个温度的平均值,只需要知道机器温度的平均值(即所有温度传感器的平均值)的场景中可以将流数据分析任务的SQL改为如下内容(从分组维度中去掉productKey和deviceName)。
-- 计算5秒平均温度,并将结果输出到数据库中 -- 定义数据源表 create table property ( propertyName varchar, propertyValue varchar, productKey varchar, deviceName varchar, ts varchar, -- 属性变化的时间 tstamp as to_timestamp (cast (ts as bigint)), -- ts为long型字符串,单位为毫秒,需要转化为时间戳格式 WATERMARK wk FOR tstamp as withOffset (tstamp, 2000) -- 使用时间窗口必须要在源表定义时声明Watermark。Watermark是插入到数据流中的一种特殊的数据,Watermark上带了一个时间戳,其含义是:在这个之后不会收到小于或等于该时间戳的数据。假设数据的乱序程度是1分钟,也就是说等1分钟之后,绝大部分迟到的数据都到了,那么我们就可以定义watermark计算方式为偏移1分钟。2000表示偏移为2秒 ) with ( type = 'edgebus', jsonParser = 'device_property' ); -- 定义数据结果表[此处为变化部分,由之前的文件改成了数据库] create table output ( productKey varchar, deviceName varchar, avg_temperature double, t_start timestamp, t_end timestamp ) with ( type = 'rds', url='jdbc:mysql://30.43.83.169:1234/iot_data', -- 格式:'jdbc:mysql://your_db_host:your_db_port/your_db_name' tableName = 'table_case_02', -- your_table_name userName = 'config://local_db_username', -- local_db_username为在配置中存储的用户名的key password = 'config://local_db_password' -- local_db_password为在配置中存储的密码的key ); -- 计算平均温度并写入结果表中 insert into output select '', '', avg (temperature) as avg_temperature, -- 计算平均温度 tumble_start (tstamp, interval '5' second), -- 时间窗口开始时间(时间窗口长度为5秒) tumble_end (tstamp, interval '5' second) -- 时间窗口结束时间(时间窗口长度为5秒) from ( select cast (propertyValue as int) as temperature, tstamp from property where propertyName = 'temperature' -- 筛选出温度属性 ) where temperature >= 0 and temperature <=100 group by tumble (tstamp, interval '5' second); -- 按时间窗口维度分组计算(时间窗口长度为5秒)运行结果如下所示。mysql> select * from table_case_02 order by t_start desc limit 5; +----+------------+------------+-----------------+---------------------+---------------------+ | id | productKey | deviceName | avg_temperature | t_start | t_end | +----+------------+------------+-----------------+---------------------+---------------------+ | 35 | | | 30.5 | 2019-01-30 16:40:55 | 2019-01-30 16:41:00 | | 34 | | | 31 | 2019-01-30 16:40:50 | 2019-01-30 16:40:55 | | 33 | | | 31 | 2019-01-30 16:40:40 | 2019-01-30 16:40:45 | | 32 | | | 30.5 | 2019-01-30 16:40:35 | 2019-01-30 16:40:40 | | 31 | | | 30 | 2019-01-30 16:40:05 | 2019-01-30 16:40:10 | +----+------------+------------+-----------------+---------------------+---------------------+ 5 rows in set (0.00 sec)