阿里云提供了ECS系统事件用于记录和通知云资源信息,例如ECS实例的启停、是否到期、任务执行情况等。在大规模集群、实时资源调度等场景,如果您需要主动监控和响应阿里云提供的ECS系统事件,来实现故障处理、动态调度等自动化运维,可通过云助手插件ecs-tool-event实现。
方案原理
监控和响应ECS系统事件可通过控制台或对接OpenAPI两种方式。然而,这两种方式都存在一定的局限:
通过控制台监控或响应系统事件:要手动干预,且对于多实例场景容易出现事件遗漏,无法做到自动化的响应。
通过对接ECS OpenAPI监控或响应系统事件:需要自行开发程序,有一定的开发成本和技术要求。
为了解决上述问题,阿里云提供了云助手插件ecs-tool-event,该插件会每分钟定时请求metaserver获取ECS系统事件,并将ECS系统事件转化为日志格式存储在操作系统内部。用户无需进行额外的程序开发,直接在操作系统内部采集系统事件日志来实现监控和响应ECS系统事件。例如,具备K8s自动化运维能力的用户,可以通过采集host_event.log的流式日志来适配自身运维系统。
方案实践
请确保您的实例已安装云助手Agent。如何安装云助手Agent?
启动、停止云助手插件或查看云助手插件状态需要使用root权限。
登录ECS实例,启用云助手插件
ecs-tool-event。启用后,该插件会每分钟定时请求metaserver获取ECS系统事件,并将ECS系统事件转化为日志格式存储在操作系统内部。
sudo acs-plugin-manager --exec --plugin=ecs-tool-event --params --start说明启动后,可通过
ls /var/log查看自动生成的host_event.log文件。日志保存地址:/var/log/host_event.log
日志格式:
%Y-%m-%d %H:%M:%S - WARNING - Ecs event type is: ${事件类型},event status is: ${事件状态}, action ISO 8601 time is ${实际执行ISO 8601时间}
示例:
2024-01-08 17:02:01 - WARNING - Ecs event type is: InstanceFailure.Reboot,event status is: Executed,action ISO 8601 time is 2023-12-27T11:49:28Z
查询插件状态。
sudo acs-plugin-manager --status结合自身业务场景,采集host_event.log的流式日志来适配自身运维系统。
(可选)如果您不再需要主动响应ECS系统事件,可停止云助手插件
ecs-tool-event。sudo acs-plugin-manager --remove --plugin ecs-tool-event
应用示例:Kubernetes集群场景自动化响应ECS系统事件
场景介绍
当ECS被用作Kubernetes集群的Node节点时,若单个节点出现异常(例如重启、内存耗尽、操作系统错误等),可能会影响线上业务的稳定性,主动监测和响应节点异常事件至关重要。您可以通过云助手插件ecs-tool-event,将ECS系统事件转化为操作系统日志,并结合K8s社区开源组件NPD(Node Problem Detector)、Draino和Autoscaler,实现免程序开发、便捷高效地监测和响应ECS系统事件,从而提升集群的稳定性和可靠性。
方案架构
方案的实现原理和技术架构如下所示:
云助手插件ecs-tool-event每分钟定时请求metaserver获取ECS系统事件,转化为系统日志存储到操作系统内部(存储路径为
/var/log/host_event.log)。集群组件NPD采集到系统事件日志后,将问题上报给APIServer。
集群控制器Draino从APIServer接收K8s事件(ECS系统事件),将异常节点上的Pod迁移到其他正常节点。
完成容器驱逐后,您可以结合业务场景使用已有的集群下线方案完成异常节点下线,或者可以选择使用Kubernetes社区的开源组件Autoscaler自动释放异常节点并创建新实例加入到集群中。

方案实践
步骤一:为节点启动ecs-tool-event插件
登录节点内部(即ECS实例),启动ecs-tool-event插件。
实际应用场景中,需要给集群的每个节点都启动该插件。您可以通过云助手批量为多个实例执行如下启动命令。具体操作,请参见创建并执行命令。
sudo acs-plugin-manager --exec --plugin=ecs-tool-event --params --start启动后,ecs-tool-event插件会自动把ECS系统事件以日志形式输出并保存到操作系统内部。
步骤二:为集群配置NPD和Draino
登录集群中的任一节点。
为集群配置NPD组件(该配置作用于整个集群)。
配置NPD文件,需要用到如下3个文件。
说明详细配置说明,可参见官方文档。
node-problem-detector-config.yaml:定义NPD需要监控的指标,例如系统日志。node-problem-detector.yaml:定义了NPD的在集群中的运行方式。rbac.yaml:定义NPD在Kubernetes集群中所需的权限。实例未配置NPD
在ECS实例添加上述3个YAML文件。
实例已配置NPD
在
node-problem-detector-config.yaml文件中,添加host_event.json日志监控。如下所示:... host_event.json: | { "plugin": "filelog", #指定使用的日志采集插件,固定为filelog "pluginConfig": { "timestamp": "^.{19}", "message": "Ecs event type is: .*", "timestampFormat": "2006-01-02 15:04:05" }, "logPath": "/var/log/host_event.log", #系统事件日志路径,固定为/var/log/host_event.log "lookback": "5m", "bufferSize": 10, "source": "host-event", "conditions": [ { "type": "HostEventRebootAfter48", #自定义事件名称,Draino配置中会用到 "reason": "HostEventWillRebootAfter48", "message": "The Host Is Running In Good Condition" } ], "rules": [ { "type": "temporary", "reason": "HostEventRebootAfter48temporary", "pattern": "Ecs event type is: SystemMaintenance.Reboot,event status is: Scheduled.*|Ecs event type is: SystemMaintenance.Reboot,event status is: Inquiring.*" }, { "type": "permanent", "condition": "HostEventRebootAfter48", "reason": "HostEventRebootAfter48Permanent", "pattern": "Ecs event type is: SystemMaintenance.Reboot,event status is: Scheduled.*|Ecs event type is: SystemMaintenance.Reboot,event status is: Inquiring.*" } ] } ...在
node-problem-detector.yaml文件中在
- --config.system-log-monitor行中添加/config/host_event.json,告诉NPD监控系统事件日志。如下所示:containers: - name: node-problem-detector command: ... - --config.system-log-monitor=/config/kernel-monitor.json,/config/docker-monitor.json,/config/host_event.json和
- name: config的items:行下,按照如下注释添加相关行。... - name: config configMap: name: node-problem-detector-config items: - key: kernel-monitor.json path: kernel-monitor.json - key: docker-monitor.json path: docker-monitor.json - key: host_event.json #待添加的行 path: host_event.json #待添加的行 ...
执行以下命令,使文件生效。
sudo kubectl create -f rbac.yaml sudo kubectl create -f node-problem-detector-config.yaml sudo kubectl create -f node-problem-detector.yaml执行如下命令,查看NPD配置是否生效。
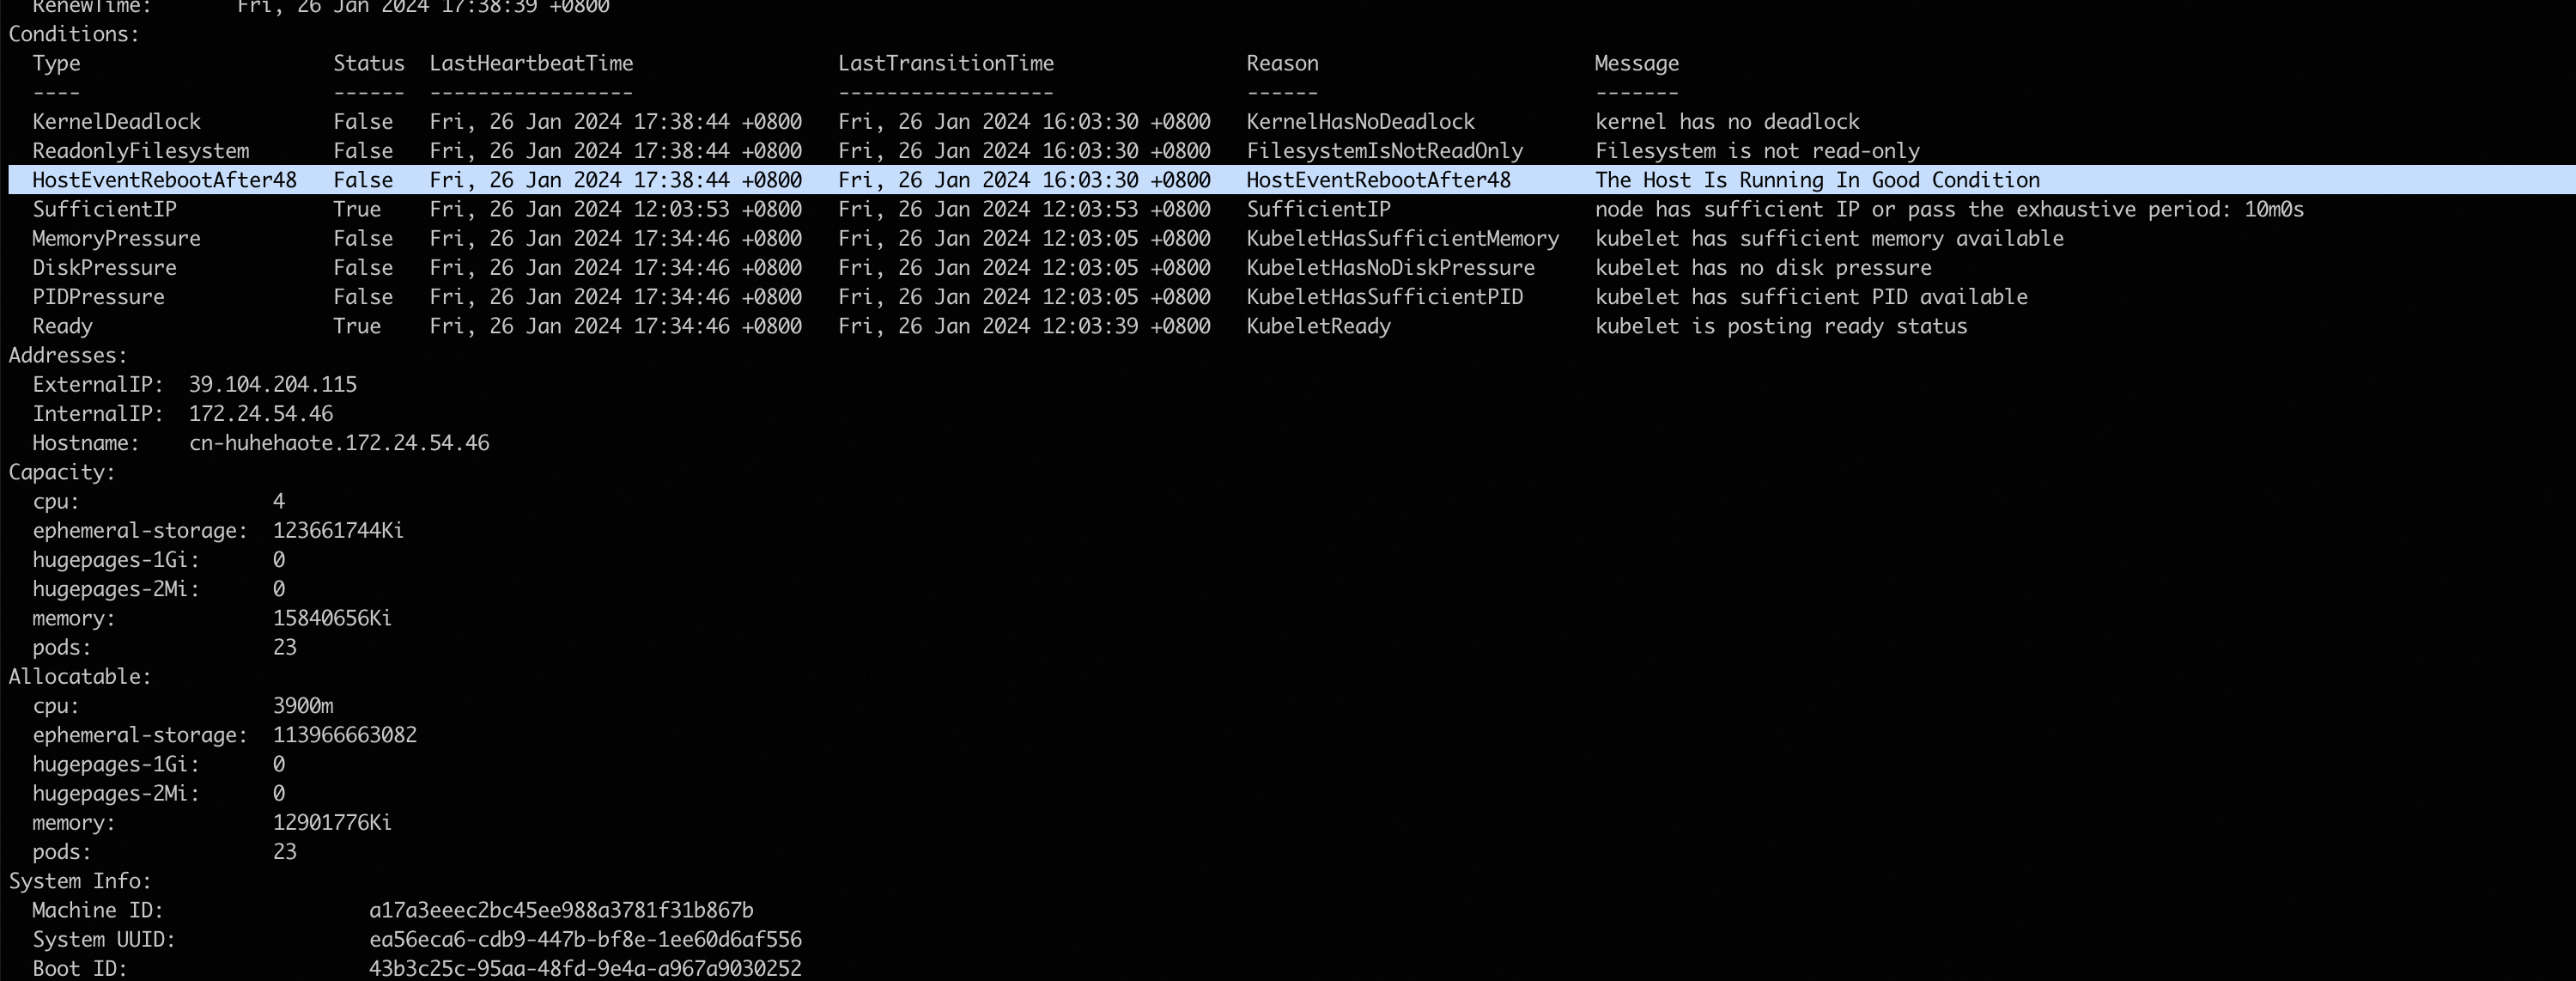
sudo kubectl describe nodes -n kube-system如以下回显所示,condition已经新增HostEventRebootAfter48,表示NPD配置已完成并生效(若未出现,可稍等3~5分钟)。
为集群配置控制器Draino(该配置作用于整个集群)。
根据实际情况,配置或修改Draino配置。
执行如下命令,使Draino配置生效。
实例未配置过Draino:安装Draino
在实例内部添加如下YAML文件。
实例已配置Draino:修改Draino配置
打开Draino配置文件,找到
containers:行,添加步骤2在node-problem-detector-config.yaml文件中定义的事件名称(例如HostEventRebootAfter48),如下所示:containers: - name: draino image: planetlabs/draino:dbadb44 # You'll want to change these labels and conditions to suit your deployment. command: - /draino - --debug ...... - KernelDeadlock - OutOfDisk - HostEventRebootAfter48 # 添加的行sudo kubectl create -f draino.yaml
步骤三:下线异常节点并增加新节点
完成容器驱逐后,您可以结合业务场景用已有的集群下线方案完成异常节点下线,或者可以选择使用社区开源的Autoscaler自动释放异常节点并创建新实例加入到集群节点。如果需要使用Autoscaler,请参见Autoscaler官方文档。
结果验证
登录任意节点,执行以下命令,模拟生成一条ECS系统事件日志。
重要时间需替换为系统当前最新时间。
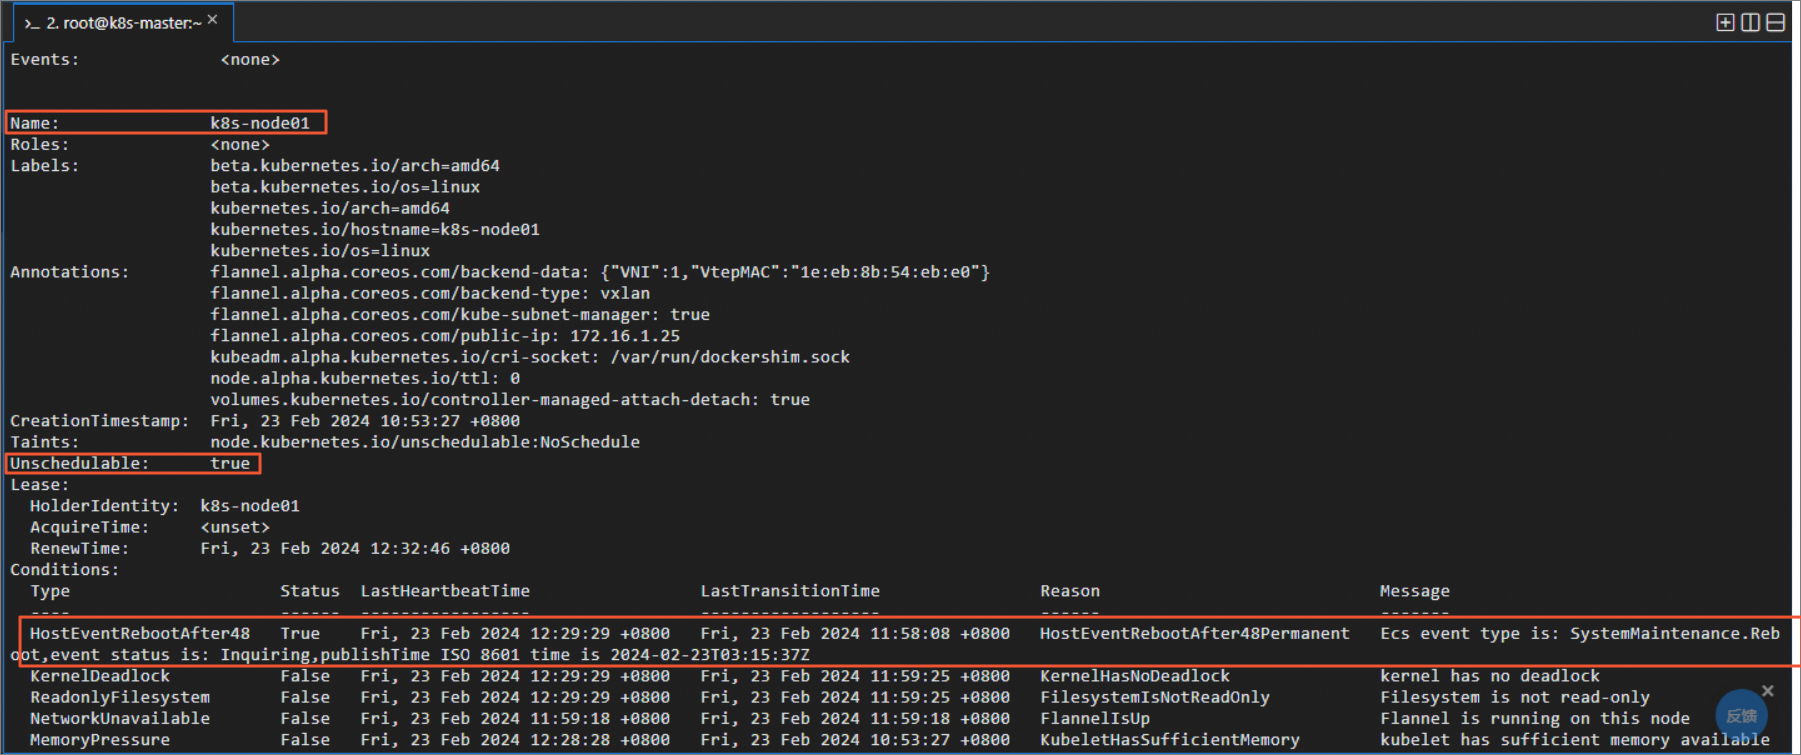
sudo echo '2024-02-23 12:29:29 - WARNING - Ecs event type is: InstanceFailure.Reboot,event status is: Executed,action ISO 8601 time is 2023-12-27T11:49:28Z' > /var/log/host_event.log执行如下命令,可看到插件会根据检测到事件自动生成k8s事件,并将该节点置为不可调度。
sudo kubectl describe nodes -n kube-system