在Kubernetes集群中部署大型语言模型(LLM)推理服务时,基于低秩适应LoRA(Low-Rank Adaptation)技术对大模型进行微调并提供定制化推理能力,已成为高效且灵活的最佳实践。本文介绍在服务网格 ASM(Service Mesh)中,如何基于Multi-LoRA的微调LLM推理服务,指定多LoRA模型的流量分发策略,从而实现LoRA模型灰度。
阅读前提示
阅读本文前,您需要了解:
通过阅读本文,您可以了解到:
LoRA与Multi-LoRA技术的背景信息。
LoRA微调模型灰度场景实现原理。
基于Multi-LoRA技术,实现LoRA模型灰度发布场景的实践操作。
背景信息
LoRA与Multi-LoRA
LoRA是一种流行的大语言模型(LLM)微调技术,可以以较小的代价对LLM进行微调,以满足LLM在垂直领域(例如医疗、金融、教育)的定制化需求。在构建推理服务时,可以基于同一个基础大模型加载多个不同的LoRA模型权重进行推理。通过这种方式,可以实现多个LoRA模型共享GPU资源的效果,这被称作Multi-LoRA技术。由于LoRA技术的高效性,因此被广泛应用于部署垂直领域定制化大模型的场景中。当前,vLLM已经支持Multi-LoRA的加载与推理。
LoRA微调模型灰度场景
在Multi-LoRA场景下,多个LoRA模型可以被加载到同一LLM推理服务中,对不同LoRA模型的请求通过请求中的模型名称进行区分。通过这种方式,可以在同一基础大模型上训练不同的LoRA模型,并在不同的LoRA模型之间进行灰度测试,以评估大模型的微调效果。
前提条件
实践步骤
本实践以在集群中部署基于vLLM的Llama2大模型为基础模型,并注册了基于该基础模型的10个LoRA模型,分别是sql-lora到sql-lora-4,以及tweet-summary到tweet-summary-4。您可以根据实际情况选择在ACK GPU集群或ACS集群中进行验证。
步骤一:部署示例LLM推理服务
使用以下内容,创建vllm-service.yaml。
说明本文使用的镜像需要GPU显存大于16GiB,T4卡型(16GiB显存)的实际可用显存不足以启动此应用。因此ACK集群卡型推荐使用A10,ACS集群卡型推荐使用8代GPU B。具体对应型号请提交工单咨询。
同时,由于LLM镜像体积较大,建议您提前转存到ACR,使用内网地址进行拉取。直接从公网拉取的速度取决于集群EIP的带宽配置,会有较长的等待时间。
ACK集群
展开查看YAML内容
apiVersion: v1 kind: Service metadata: name: vllm-llama2-7b-pool spec: selector: app: vllm-llama2-7b-pool ports: - protocol: TCP port: 8000 targetPort: 8000 type: ClusterIP --- apiVersion: v1 kind: ConfigMap metadata: name: chat-template data: llama-2-chat.jinja: | {% if messages[0]['role'] == 'system' %} {% set system_message = '<<SYS>>\n' + messages[0]['content'] | trim + '\n<</SYS>>\n\n' %} {% set messages = messages[1:] %} {% else %} {% set system_message = '' %} {% endif %} {% for message in messages %} {% if (message['role'] == 'user') != (loop.index0 % 2 == 0) %} {{ raise_exception('Conversation roles must alternate user/assistant/user/assistant/...') }} {% endif %} {% if loop.index0 == 0 %} {% set content = system_message + message['content'] %} {% else %} {% set content = message['content'] %} {% endif %} {% if message['role'] == 'user' %} {{ bos_token + '[INST] ' + content | trim + ' [/INST]' }} {% elif message['role'] == 'assistant' %} {{ ' ' + content | trim + ' ' + eos_token }} {% endif %} {% endfor %} --- apiVersion: apps/v1 kind: Deployment metadata: name: vllm-llama2-7b-pool namespace: default spec: replicas: 3 selector: matchLabels: app: vllm-llama2-7b-pool template: metadata: annotations: prometheus.io/path: /metrics prometheus.io/port: '8000' prometheus.io/scrape: 'true' labels: app: vllm-llama2-7b-pool spec: containers: - name: lora image: "registry-cn-hangzhou-vpc.ack.aliyuncs.com/dev/llama2-with-lora:v0.2" imagePullPolicy: IfNotPresent command: ["python3", "-m", "vllm.entrypoints.openai.api_server"] args: - "--model" - "/model/llama2" - "--tensor-parallel-size" - "1" - "--port" - "8000" - '--gpu_memory_utilization' - '0.8' - "--enable-lora" - "--max-loras" - "10" - "--max-cpu-loras" - "12" - "--lora-modules" - 'sql-lora=/adapters/yard1/llama-2-7b-sql-lora-test_0' - 'sql-lora-1=/adapters/yard1/llama-2-7b-sql-lora-test_1' - 'sql-lora-2=/adapters/yard1/llama-2-7b-sql-lora-test_2' - 'sql-lora-3=/adapters/yard1/llama-2-7b-sql-lora-test_3' - 'sql-lora-4=/adapters/yard1/llama-2-7b-sql-lora-test_4' - 'tweet-summary=/adapters/vineetsharma/qlora-adapter-Llama-2-7b-hf-TweetSumm_0' - 'tweet-summary-1=/adapters/vineetsharma/qlora-adapter-Llama-2-7b-hf-TweetSumm_1' - 'tweet-summary-2=/adapters/vineetsharma/qlora-adapter-Llama-2-7b-hf-TweetSumm_2' - 'tweet-summary-3=/adapters/vineetsharma/qlora-adapter-Llama-2-7b-hf-TweetSumm_3' - 'tweet-summary-4=/adapters/vineetsharma/qlora-adapter-Llama-2-7b-hf-TweetSumm_4' - '--chat-template' - '/etc/vllm/llama-2-chat.jinja' env: - name: PORT value: "8000" ports: - containerPort: 8000 name: http protocol: TCP livenessProbe: failureThreshold: 2400 httpGet: path: /health port: http scheme: HTTP initialDelaySeconds: 5 periodSeconds: 5 successThreshold: 1 timeoutSeconds: 1 readinessProbe: failureThreshold: 6000 httpGet: path: /health port: http scheme: HTTP initialDelaySeconds: 5 periodSeconds: 5 successThreshold: 1 timeoutSeconds: 1 resources: limits: nvidia.com/gpu: 1 requests: nvidia.com/gpu: 1 volumeMounts: - mountPath: /data name: data - mountPath: /dev/shm name: shm - mountPath: /etc/vllm name: chat-template restartPolicy: Always schedulerName: default-scheduler terminationGracePeriodSeconds: 30 volumes: - name: data emptyDir: {} - name: shm emptyDir: medium: Memory - name: chat-template configMap: name: chat-templateACS集群
展开查看YAML内容
apiVersion: v1 kind: Service metadata: name: vllm-llama2-7b-pool spec: selector: app: vllm-llama2-7b-pool ports: - protocol: TCP port: 8000 targetPort: 8000 type: ClusterIP --- apiVersion: v1 kind: ConfigMap metadata: name: chat-template data: llama-2-chat.jinja: | {% if messages[0]['role'] == 'system' %} {% set system_message = '<<SYS>>\n' + messages[0]['content'] | trim + '\n<</SYS>>\n\n' %} {% set messages = messages[1:] %} {% else %} {% set system_message = '' %} {% endif %} {% for message in messages %} {% if (message['role'] == 'user') != (loop.index0 % 2 == 0) %} {{ raise_exception('Conversation roles must alternate user/assistant/user/assistant/...') }} {% endif %} {% if loop.index0 == 0 %} {% set content = system_message + message['content'] %} {% else %} {% set content = message['content'] %} {% endif %} {% if message['role'] == 'user' %} {{ bos_token + '[INST] ' + content | trim + ' [/INST]' }} {% elif message['role'] == 'assistant' %} {{ ' ' + content | trim + ' ' + eos_token }} {% endif %} {% endfor %} --- apiVersion: apps/v1 kind: Deployment metadata: name: vllm-llama2-7b-pool namespace: default spec: replicas: 3 selector: matchLabels: app: vllm-llama2-7b-pool template: metadata: annotations: prometheus.io/path: /metrics prometheus.io/port: '8000' prometheus.io/scrape: 'true' labels: app: vllm-llama2-7b-pool alibabacloud.com/compute-class: gpu # 指定使用GPU算力 alibabacloud.com/compute-qos: default alibabacloud.com/gpu-model-series: "example-model" # 指定GPU型号为example-model,请按实际情况填写 spec: containers: - name: lora image: "registry-cn-hangzhou-vpc.ack.aliyuncs.com/dev/llama2-with-lora:v0.2" imagePullPolicy: IfNotPresent command: ["python3", "-m", "vllm.entrypoints.openai.api_server"] args: - "--model" - "/model/llama2" - "--tensor-parallel-size" - "1" - "--port" - "8000" - '--gpu_memory_utilization' - '0.8' - "--enable-lora" - "--max-loras" - "10" - "--max-cpu-loras" - "12" - "--lora-modules" - 'sql-lora=/adapters/yard1/llama-2-7b-sql-lora-test_0' - 'sql-lora-1=/adapters/yard1/llama-2-7b-sql-lora-test_1' - 'sql-lora-2=/adapters/yard1/llama-2-7b-sql-lora-test_2' - 'sql-lora-3=/adapters/yard1/llama-2-7b-sql-lora-test_3' - 'sql-lora-4=/adapters/yard1/llama-2-7b-sql-lora-test_4' - 'tweet-summary=/adapters/vineetsharma/qlora-adapter-Llama-2-7b-hf-TweetSumm_0' - 'tweet-summary-1=/adapters/vineetsharma/qlora-adapter-Llama-2-7b-hf-TweetSumm_1' - 'tweet-summary-2=/adapters/vineetsharma/qlora-adapter-Llama-2-7b-hf-TweetSumm_2' - 'tweet-summary-3=/adapters/vineetsharma/qlora-adapter-Llama-2-7b-hf-TweetSumm_3' - 'tweet-summary-4=/adapters/vineetsharma/qlora-adapter-Llama-2-7b-hf-TweetSumm_4' - '--chat-template' - '/etc/vllm/llama-2-chat.jinja' env: - name: PORT value: "8000" ports: - containerPort: 8000 name: http protocol: TCP livenessProbe: failureThreshold: 2400 httpGet: path: /health port: http scheme: HTTP initialDelaySeconds: 5 periodSeconds: 5 successThreshold: 1 timeoutSeconds: 1 readinessProbe: failureThreshold: 6000 httpGet: path: /health port: http scheme: HTTP initialDelaySeconds: 5 periodSeconds: 5 successThreshold: 1 timeoutSeconds: 1 resources: limits: cpu: 16 memory: 64Gi nvidia.com/gpu: 1 requests: cpu: 8 memory: 30Gi nvidia.com/gpu: 1 volumeMounts: - mountPath: /data name: data - mountPath: /dev/shm name: shm - mountPath: /etc/vllm name: chat-template restartPolicy: Always schedulerName: default-scheduler terminationGracePeriodSeconds: 30 volumes: - name: data emptyDir: {} - name: shm emptyDir: medium: Memory - name: chat-template configMap: name: chat-template使用数据面集群的kubeconfig,部署LLM推理服务。
kubectl apply -f vllm-service.yaml
步骤二:配置ASM网关规则
部署生效于ASM网关的网关规则,该规则表示开启网关8080端口的监听。
使用以下内容,创建gateway.yaml。
apiVersion: networking.istio.io/v1
kind: Gateway
metadata:
  name: llm-inference-gateway
  namespace: default
spec:
  selector:
    istio: ingressgateway
  servers:
    - hosts:
        - '*'
      port:
        name: http-service
        number: 8080
        protocol: HTTP
创建网关规则。
kubectl apply -f gateway.yaml
步骤三:配置LLM推理服务路由和负载均衡
使用ASM的kubeconfig,启用LLM推理服务路由能力。
kubectl patch asmmeshconfig default --type=merge --patch='{"spec":{"gatewayAPIInferenceExtension":{"enabled":true}}}'部署InferencePool资源。
InferencePool资源通过标签选择器声明一组集群中运行的LLM推理服务工作负载,ASM会根据您创建的InferencePool来对LLM推理服务开启vLLM负载均衡。
使用以下内容,创建inferencepool.yaml。
apiVersion: inference.networking.x-k8s.io/v1alpha1 kind: InferencePool metadata: name: vllm-llama2-7b-pool spec: targetPortNumber: 8000 selector: app: vllm-llama2-7b-pool使用数据面集群的kubeconfig,创建InferencePool资源。
kubectl apply -f inferencepool.yaml
部署InferenceModel资源。
InferenceModel指定了InferencePool中具体模型的流量分发策略。
使用以下内容,创建inferencemodel.yaml。
apiVersion: inference.networking.x-k8s.io/v1alpha1
kind: InferenceModel
metadata:
  name: inferencemodel-sample
spec:
  modelName: lora-request
  poolRef:
    group: inference.networking.x-k8s.io
    kind: InferencePool
    name: vllm-llama2-7b-pool
  targetModels:
  - name: tweet-summary
    weight: 10
  - name: tweet-summary-1
    weight: 10
  - name: tweet-summary-2
    weight: 10
  - name: tweet-summary-3
    weight: 10
  - name: tweet-summary-4
    weight: 10
  - name: sql-lora
    weight: 10
  - name: sql-lora-1
    weight: 10
  - name: sql-lora-2
    weight: 10
  - name: sql-lora-3
    weight: 10
  - name: sql-lora-4
    weight: 10
上述内容配置了当请求的模型名称是
lora-request时,总和为50%的请求由tweet-summary LoRA模型进行推理,另外50%的请求发往sql-lora LoRA模型进行推理。创建InferenceModel资源。
kubectl apply -f inferencemodel.yaml
创建LLMRoute资源。
为网关配置路由规则。此路由规则通过引用InferencePool资源的方式,指定ASM网关将8080端口上接收到的请求全部转发给示例LLM推理服务。
使用以下内容,创建llmroute.yaml。
apiVersion: istio.alibabacloud.com/v1 kind: LLMRoute metadata: name: test-llm-route spec: gateways: - llm-inference-gateway host: test.com rules: - backendRefs: - backendRef: group: inference.networking.x-k8s.io kind: InferencePool name: vllm-llama2-7b-pool创建LLMRoute资源。
kubectl apply -f llmroute.yaml
步骤四:验证执行结果
多次执行以下命令发起测试:
curl -H "host: test.com" ${ASM网关IP}:8080/v1/completions -H 'Content-Type: application/json' -d '{
"model": "lora-request",
"prompt": "Write as if you were a critic: San Francisco",
"max_tokens": 100,
"temperature": 0
}' -v
可以看到和下面内容相似的输出:
{"id":"cmpl-2fc9a351-d866-422b-b561-874a30843a6b","object":"text_completion","created":1736933141,"model":"tweet-summary-1","choices":[{"index":0,"text":", I'm a newbie to this forum. Write a summary of the article.\nWrite a summary of the article.\nWrite a summary of the article. Write a summary of the article. Write a summary of the article. Write a summary of the article. Write a summary of the article. Write a summary of the article. Write a summary of the article. Write a summary of the article. Write a summary of the article. Write a summary of the article. Write a summary","logprobs":null,"finish_reason":"length","stop_reason":null,"prompt_logprobs":null}],"usage":{"prompt_tokens":2,"total_tokens":102,"completion_tokens":100,"prompt_tokens_details":null}}其中model字段表示真正提供服务的模型。多次访问之后,可以看到tweet-summary和sql-lora模型的请求总量比例大致为1:1。
(可选)步骤五:配置LLM服务可观测指标与可观测大盘
在使用InferencePool和InferenceMode资源声明集群中的LLM推理服务,并配置路由策略后,可以通过在日志和监控指标两方面查看LLM推理的可观测能力。
开启ASM的LLM流量可观测能力,采集服务网格监控指标。
通过操作新增日志字段、新增指标以及新增指标维度增强LLM推理请求的可观测性信息。
完成配置后,ASM监控指标中会新增一个
model维度。您可以通过将监控指标采集到可观测监控Prometheus版,或者集成自建Prometheus实现网格监控进行指标采集。ASM新增提供两个指标来表示所有请求的输入token数
asm_llm_proxy_prompt_tokens和输出token数asm_llm_proxy_completion_tokens。您可以为Prometheus增加以下规则来新增这些指标。scrape_configs: - job_name: asm-envoy-stats-llm scrape_interval: 30s scrape_timeout: 30s metrics_path: /stats/prometheus scheme: http kubernetes_sd_configs: - role: pod relabel_configs: - source_labels: - __meta_kubernetes_pod_container_port_name action: keep regex: .*-envoy-prom - source_labels: - __address__ - __meta_kubernetes_pod_annotation_prometheus_io_port action: replace regex: ([^:]+)(?::\d+)?;(\d+) replacement: $1:15090 target_label: __address__ - action: labelmap regex: __meta_kubernetes_pod_label_(.+) - source_labels: - __meta_kubernetes_namespace action: replace target_label: namespace - source_labels: - __meta_kubernetes_pod_name action: replace target_label: pod_name metric_relabel_configs: - action: keep source_labels: - __name__ regex: asm_llm_.*
采集vLLM服务监控指标。
ASM提供的LLM推理请求监控指标主要监控了外部LLM推理请求的吞吐情况。您可以为vLLM服务Pod增加Prometheus采集相关的注解,以采集vLLM服务暴露的监控指标,监控vLLM服务的内部状态。
... annotations: prometheus.io/path: /metrics # 指标暴露的HTTP Path。 prometheus.io/port: "8000" # 指标暴露端口,即为vLLM Server的监听端口。 prometheus.io/scrape: "true" # 是否抓取当前Pod的指标。 ...通过Prometheus实例默认的服务发现机制采集vLLM服务相关指标。具体操作,请参见。
在vLLM服务提供的监控指标中,可以通过以下重点指标来直观了解vLLM工作负载的内部状态。
指标名称
说明
vllm:gpu_cache_usage_perc
vllm的GPU缓存使用百分比。vLLM启动时,会尽可能多地预先占有一块GPU显存,用于进行KV缓存。对于vLLM服务器,缓存利用率越低,代表GPU还有充足的空间将资源分配给新来的请求。
vllm:request_queue_time_seconds_sum
请求在等待状态排队花费的时间。LLM推理请求在到达vLLM服务器后、可能不会被立刻处理,而是需要等待被vLLM调度器调度运行预填充和解码。
vllm:num_requests_running
vllm:num_requests_waiting
vllm:num_requests_swapped
正在运行推理、正在等待和被交换到内存的请求数量。可以用来评估vLLM服务当前的请求压力。
vllm:avg_generation_throughput_toks_per_s
vllm:avg_prompt_throughput_toks_per_s
每秒被预填充阶段消耗的token以及解码阶段生成的token数量。
vllm:time_to_first_token_seconds_bucket
从请求发送到vLLM服务,到响应第一个token为止的时延水平。该指标通常代表了客户端在输出请求内容后得到首个响应所需的时间、是影响LLM用户体验的重要指标。
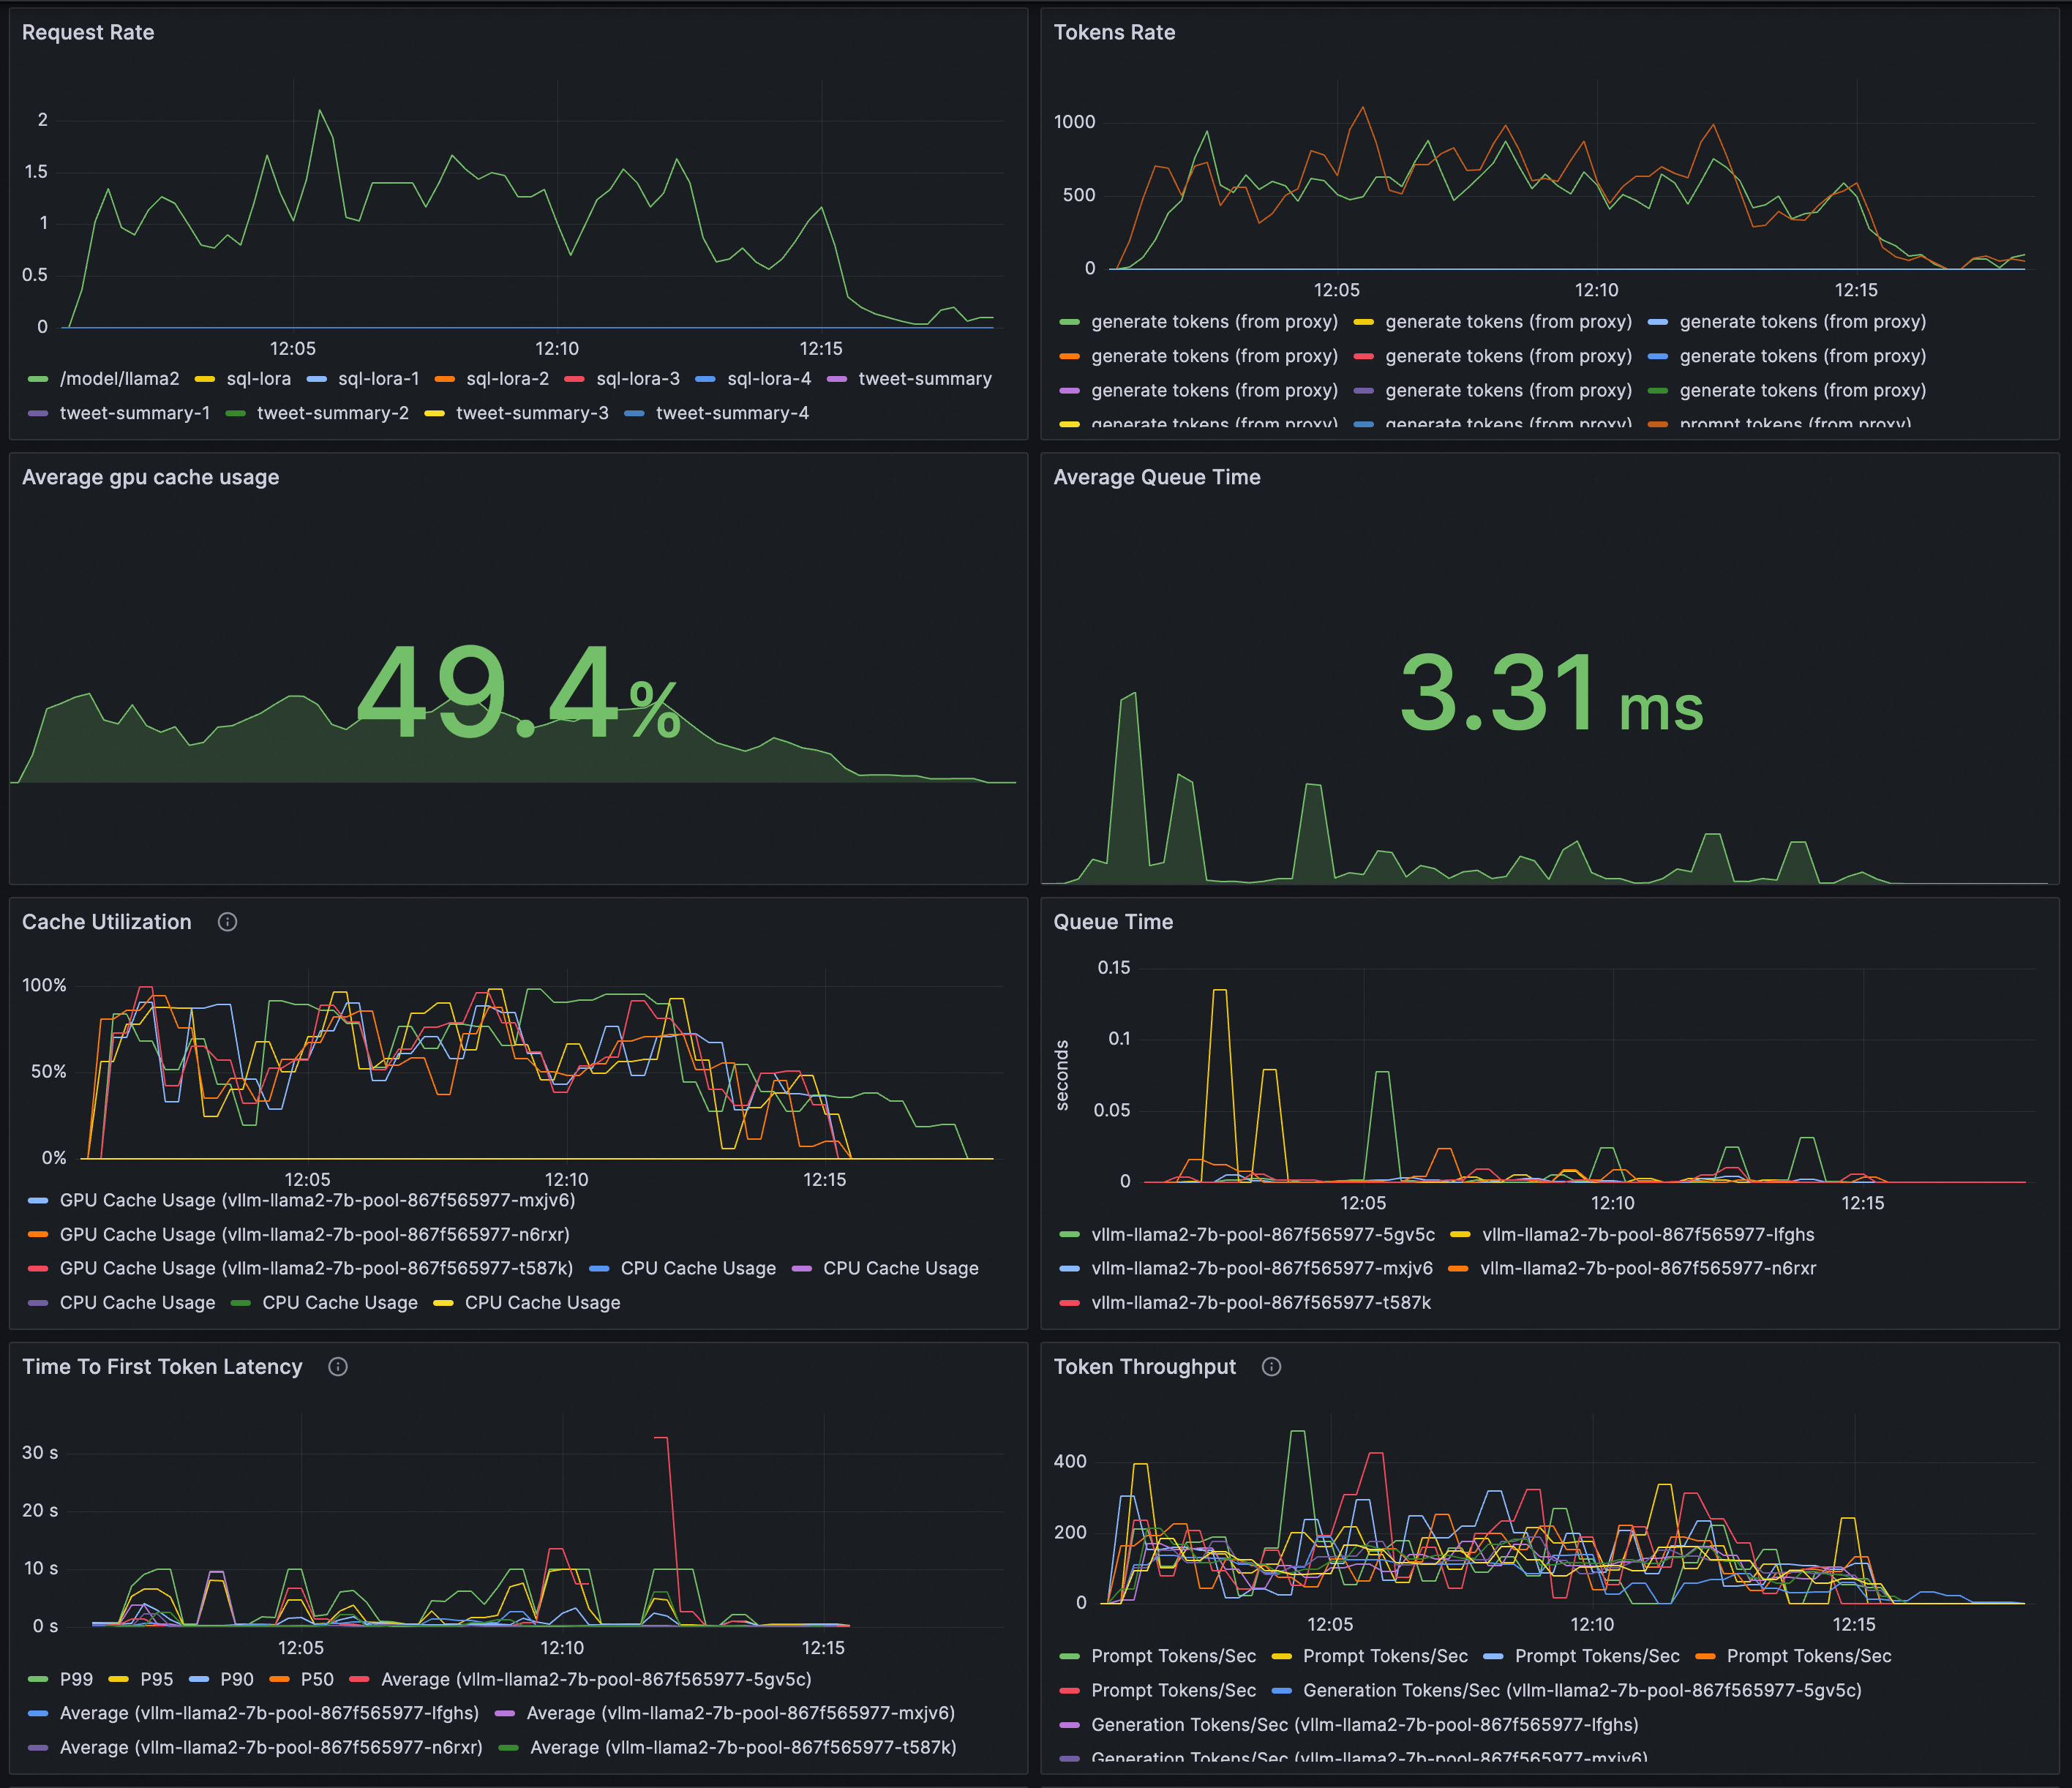
配置Grafana大盘检测LLM推理服务。
您可以通过Grafana大盘来观测基于vLLM部署的LLM推理服务:
通过基于ASM监控指标的面板观测服务的请求速率和整体token吞吐;
通过基于vLLM监控指标的面板观测推理工作负载的内部状态。
请确保Grafana使用的数据源Prometheus实例已经采集服务网格和vLLM的监控指标。
将以下内容导入到Grafana,创建LLM推理服务的可观测大盘。具体导入操作,请参见如何导出和导入Grafana仪表盘。
展开查看JSON内容
{ "annotations": { "list": [ { "builtIn": 1, "datasource": { "type": "grafana", "uid": "-- Grafana --" }, "enable": true, "hide": true, "iconColor": "rgba(0, 211, 255, 1)", "name": "Annotations & Alerts", "target": { "limit": 100, "matchAny": false, "tags": [], "type": "dashboard" }, "type": "dashboard" } ] }, "description": "Monitoring vLLM Inference Server", "editable": true, "fiscalYearStartMonth": 0, "graphTooltip": 0, "id": 49, "links": [], "liveNow": false, "panels": [ { "datasource": { "type": "prometheus", "uid": "${DS_PROMETHEUS}" }, "description": "", "fieldConfig": { "defaults": { "color": { "mode": "palette-classic" }, "custom": { "axisCenteredZero": false, "axisColorMode": "text", "axisLabel": "", "axisPlacement": "auto", "barAlignment": 0, "drawStyle": "line", "fillOpacity": 0, "gradientMode": "none", "hideFrom": { "legend": false, "tooltip": false, "viz": false }, "lineInterpolation": "linear", "lineWidth": 1, "pointSize": 5, "scaleDistribution": { "type": "linear" }, "showPoints": "auto", "spanNulls": false, "stacking": { "group": "A", "mode": "none" }, "thresholdsStyle": { "mode": "off" } }, "mappings": [], "thresholds": { "mode": "absolute", "steps": [ { "color": "green" }, { "color": "red", "value": 80 } ] } }, "overrides": [] }, "gridPos": { "h": 8, "w": 12, "x": 0, "y": 0 }, "id": 23, "options": { "legend": { "calcs": [], "displayMode": "list", "placement": "bottom", "showLegend": true }, "tooltip": { "mode": "single", "sort": "none" } }, "targets": [ { "datasource": { "type": "prometheus", "uid": "${DS_PROMETHEUS}" }, "editorMode": "builder", "exemplar": false, "expr": "sum by(model) (rate(istio_requests_total{model!=\"unknown\"}[$__rate_interval]))", "instant": false, "interval": "", "legendFormat": "__auto", "range": true, "refId": "A" } ], "title": "Request Rate", "type": "timeseries" }, { "datasource": { "type": "prometheus", "uid": "prom-cec64713b1aab44d0b49236b6f54cd671" }, "description": "", "fieldConfig": { "defaults": { "color": { "mode": "palette-classic" }, "custom": { "axisCenteredZero": false, "axisColorMode": "text", "axisLabel": "", "axisPlacement": "auto", "barAlignment": 0, "drawStyle": "line", "fillOpacity": 0, "gradientMode": "none", "hideFrom": { "legend": false, "tooltip": false, "viz": false }, "lineInterpolation": "linear", "lineWidth": 1, "pointSize": 5, "scaleDistribution": { "type": "linear" }, "showPoints": "auto", "spanNulls": false, "stacking": { "group": "A", "mode": "none" }, "thresholdsStyle": { "mode": "off" } }, "mappings": [], "thresholds": { "mode": "absolute", "steps": [ { "color": "green" }, { "color": "red", "value": 80 } ] } }, "overrides": [] }, "gridPos": { "h": 8, "w": 12, "x": 12, "y": 0 }, "id": 20, "options": { "legend": { "calcs": [], "displayMode": "list", "placement": "bottom", "showLegend": true }, "tooltip": { "mode": "single", "sort": "none" } }, "targets": [ { "datasource": { "type": "prometheus", "uid": "prom-cec64713b1aab44d0b49236b6f54cd671" }, "editorMode": "code", "expr": "sum by(llmproxy_model) (rate(asm_llm_proxy_completion_tokens{}[$__rate_interval]))", "instant": false, "legendFormat": "generate tokens (from proxy)", "range": true, "refId": "A" }, { "datasource": { "type": "prometheus", "uid": "prom-cec64713b1aab44d0b49236b6f54cd671" }, "editorMode": "code", "expr": "sum by(llmproxy_model) (rate(asm_llm_proxy_prompt_tokens{}[$__rate_interval]))", "hide": false, "instant": false, "legendFormat": "prompt tokens (from proxy)", "range": true, "refId": "B" } ], "title": "Tokens Rate", "type": "timeseries" }, { "datasource": { "type": "prometheus", "uid": "${DS_PROMETHEUS}" }, "fieldConfig": { "defaults": { "color": { "mode": "thresholds" }, "mappings": [], "min": -1, "thresholds": { "mode": "absolute", "steps": [ { "color": "green", "value": null }, { "color": "red", "value": 80 } ] }, "unit": "percentunit" }, "overrides": [] }, "gridPos": { "h": 8, "w": 12, "x": 0, "y": 8 }, "id": 17, "options": { "colorMode": "value", "graphMode": "area", "justifyMode": "auto", "orientation": "auto", "reduceOptions": { "calcs": [ "mean" ], "fields": "", "values": false }, "textMode": "auto" }, "pluginVersion": "10.0.9", "targets": [ { "datasource": { "type": "prometheus", "uid": "${DS_PROMETHEUS}" }, "editorMode": "builder", "expr": "avg(vllm:gpu_cache_usage_perc)", "hide": false, "instant": false, "range": true, "refId": "A" } ], "title": "Average gpu cache usage", "type": "stat" }, { "datasource": { "type": "prometheus", "uid": "${DS_PROMETHEUS}" }, "fieldConfig": { "defaults": { "color": { "mode": "thresholds" }, "mappings": [], "thresholds": { "mode": "absolute", "steps": [ { "color": "green", "value": null }, { "color": "red", "value": 80 } ] }, "unit": "s" }, "overrides": [] }, "gridPos": { "h": 8, "w": 12, "x": 12, "y": 8 }, "id": 18, "options": { "colorMode": "value", "graphMode": "area", "justifyMode": "auto", "orientation": "auto", "reduceOptions": { "calcs": [ "mean" ], "fields": "", "values": false }, "textMode": "auto" }, "pluginVersion": "10.0.9", "targets": [ { "datasource": { "type": "prometheus", "uid": "${DS_PROMETHEUS}" }, "editorMode": "code", "expr": "avg(rate(vllm:request_queue_time_seconds_sum{model_name=\"$model_name\"}[$__rate_interval]))", "hide": false, "instant": false, "range": true, "refId": "C" } ], "title": "Average Queue Time", "type": "stat" }, { "datasource": { "type": "prometheus", "uid": "${DS_PROMETHEUS}" }, "description": "Percentage of used cache blocks by vLLM.", "fieldConfig": { "defaults": { "color": { "mode": "palette-classic" }, "custom": { "axisCenteredZero": false, "axisColorMode": "text", "axisLabel": "", "axisPlacement": "auto", "barAlignment": 0, "drawStyle": "line", "fillOpacity": 0, "gradientMode": "none", "hideFrom": { "legend": false, "tooltip": false, "viz": false }, "lineInterpolation": "linear", "lineWidth": 1, "pointSize": 5, "scaleDistribution": { "type": "linear" }, "showPoints": "auto", "spanNulls": false, "stacking": { "group": "A", "mode": "none" }, "thresholdsStyle": { "mode": "off" } }, "mappings": [], "thresholds": { "mode": "absolute", "steps": [ { "color": "green", "value": null }, { "color": "red", "value": 80 } ] }, "unit": "percentunit" }, "overrides": [] }, "gridPos": { "h": 8, "w": 12, "x": 0, "y": 16 }, "id": 4, "options": { "legend": { "calcs": [], "displayMode": "list", "placement": "bottom", "showLegend": true }, "tooltip": { "mode": "single", "sort": "none" } }, "targets": [ { "datasource": { "type": "prometheus", "uid": "${DS_PROMETHEUS}" }, "editorMode": "builder", "expr": "sum by(kubernetes_pod_name) (vllm:gpu_cache_usage_perc{model_name=\"$model_name\"})", "instant": false, "legendFormat": "GPU Cache Usage ({{kubernetes_pod_name}})", "range": true, "refId": "A" }, { "datasource": { "type": "prometheus", "uid": "${DS_PROMETHEUS}" }, "editorMode": "code", "expr": "vllm:cpu_cache_usage_perc{model_name=\"$model_name\"}", "hide": false, "instant": false, "legendFormat": "CPU Cache Usage", "range": true, "refId": "B" } ], "title": "Cache Utilization", "type": "timeseries" }, { "datasource": { "type": "prometheus", "uid": "${DS_PROMETHEUS}" }, "fieldConfig": { "defaults": { "color": { "mode": "palette-classic" }, "custom": { "axisCenteredZero": false, "axisColorMode": "text", "axisLabel": "seconds", "axisPlacement": "auto", "barAlignment": 0, "drawStyle": "line", "fillOpacity": 0, "gradientMode": "none", "hideFrom": { "legend": false, "tooltip": false, "viz": false }, "lineInterpolation": "linear", "lineWidth": 1, "pointSize": 5, "scaleDistribution": { "type": "linear" }, "showPoints": "auto", "spanNulls": false, "stacking": { "group": "A", "mode": "none" }, "thresholdsStyle": { "mode": "off" } }, "mappings": [], "thresholds": { "mode": "absolute", "steps": [ { "color": "green", "value": null }, { "color": "red", "value": 80 } ] } }, "overrides": [] }, "gridPos": { "h": 8, "w": 12, "x": 12, "y": 16 }, "id": 14, "options": { "legend": { "calcs": [], "displayMode": "list", "placement": "bottom", "showLegend": true }, "tooltip": { "mode": "single", "sort": "none" } }, "targets": [ { "datasource": { "type": "prometheus", "uid": "edx8memhpd9tsa" }, "disableTextWrap": false, "editorMode": "code", "expr": "sum by(kubernetes_pod_name) (rate(vllm:request_queue_time_seconds_sum{model_name=\"$model_name\"}[$__rate_interval]))", "fullMetaSearch": false, "includeNullMetadata": true, "instant": false, "legendFormat": "__auto", "range": true, "refId": "A", "useBackend": false } ], "title": "Queue Time", "type": "timeseries" }, { "datasource": { "type": "prometheus", "uid": "${DS_PROMETHEUS}" }, "description": "P50, P90, P95, and P99 TTFT latency in seconds.", "fieldConfig": { "defaults": { "color": { "mode": "palette-classic" }, "custom": { "axisCenteredZero": false, "axisColorMode": "text", "axisLabel": "", "axisPlacement": "auto", "barAlignment": 0, "drawStyle": "line", "fillOpacity": 0, "gradientMode": "none", "hideFrom": { "legend": false, "tooltip": false, "viz": false }, "lineInterpolation": "linear", "lineWidth": 1, "pointSize": 5, "scaleDistribution": { "type": "linear" }, "showPoints": "auto", "spanNulls": false, "stacking": { "group": "A", "mode": "none" }, "thresholdsStyle": { "mode": "off" } }, "mappings": [], "thresholds": { "mode": "absolute", "steps": [ { "color": "green", "value": null }, { "color": "red", "value": 80 } ] }, "unit": "s" }, "overrides": [] }, "gridPos": { "h": 8, "w": 12, "x": 0, "y": 24 }, "id": 5, "options": { "legend": { "calcs": [], "displayMode": "list", "placement": "bottom", "showLegend": true }, "tooltip": { "mode": "single", "sort": "none" } }, "targets": [ { "datasource": { "type": "prometheus", "uid": "${DS_PROMETHEUS}" }, "disableTextWrap": false, "editorMode": "builder", "expr": "histogram_quantile(0.99, sum by(le) (rate(vllm:time_to_first_token_seconds_bucket{model_name=\"$model_name\"}[$__rate_interval])))", "fullMetaSearch": false, "hide": false, "includeNullMetadata": false, "instant": false, "legendFormat": "P99", "range": true, "refId": "A", "useBackend": false }, { "datasource": { "type": "prometheus", "uid": "${DS_PROMETHEUS}" }, "disableTextWrap": false, "editorMode": "builder", "expr": "histogram_quantile(0.95, sum by(le) (rate(vllm:time_to_first_token_seconds_bucket{model_name=\"$model_name\"}[$__rate_interval])))", "fullMetaSearch": false, "includeNullMetadata": false, "instant": false, "legendFormat": "P95", "range": true, "refId": "B", "useBackend": false }, { "datasource": { "type": "prometheus", "uid": "${DS_PROMETHEUS}" }, "disableTextWrap": false, "editorMode": "builder", "expr": "histogram_quantile(0.9, sum by(le) (rate(vllm:time_to_first_token_seconds_bucket{model_name=\"$model_name\"}[$__rate_interval])))", "fullMetaSearch": false, "hide": false, "includeNullMetadata": false, "instant": false, "legendFormat": "P90", "range": true, "refId": "C", "useBackend": false }, { "datasource": { "type": "prometheus", "uid": "${DS_PROMETHEUS}" }, "disableTextWrap": false, "editorMode": "builder", "expr": "histogram_quantile(0.5, sum by(le) (rate(vllm:time_to_first_token_seconds_bucket{model_name=\"$model_name\"}[$__rate_interval])))", "fullMetaSearch": false, "hide": false, "includeNullMetadata": false, "instant": false, "legendFormat": "P50", "range": true, "refId": "D", "useBackend": false }, { "datasource": { "type": "prometheus", "uid": "${DS_PROMETHEUS}" }, "editorMode": "builder", "expr": "sum by(kubernetes_pod_name) (rate(vllm:time_to_first_token_seconds_sum{model_name=\"$model_name\"}[$__rate_interval])) / sum by(kubernetes_pod_name) (rate(vllm:time_to_first_token_seconds_count{model_name=\"$model_name\"}[$__rate_interval]))", "hide": false, "instant": false, "legendFormat": "Average ({{kubernetes_pod_name}})", "range": true, "refId": "E" } ], "title": "Time To First Token Latency", "type": "timeseries" }, { "datasource": { "type": "prometheus", "uid": "${DS_PROMETHEUS}" }, "description": "Number of tokens processed per second", "fieldConfig": { "defaults": { "color": { "mode": "palette-classic" }, "custom": { "axisCenteredZero": false, "axisColorMode": "text", "axisLabel": "", "axisPlacement": "auto", "barAlignment": 0, "drawStyle": "line", "fillOpacity": 0, "gradientMode": "none", "hideFrom": { "legend": false, "tooltip": false, "viz": false }, "lineInterpolation": "linear", "lineWidth": 1, "pointSize": 5, "scaleDistribution": { "type": "linear" }, "showPoints": "auto", "spanNulls": false, "stacking": { "group": "A", "mode": "none" }, "thresholdsStyle": { "mode": "off" } }, "mappings": [], "thresholds": { "mode": "absolute", "steps": [ { "color": "green", "value": null }, { "color": "red", "value": 80 } ] } }, "overrides": [] }, "gridPos": { "h": 8, "w": 12, "x": 12, "y": 24 }, "id": 8, "options": { "legend": { "calcs": [], "displayMode": "list", "placement": "bottom", "showLegend": true }, "tooltip": { "mode": "single", "sort": "none" } }, "targets": [ { "datasource": { "type": "prometheus", "uid": "${DS_PROMETHEUS}" }, "disableTextWrap": false, "editorMode": "builder", "expr": "rate(vllm:prompt_tokens_total{model_name=\"$model_name\"}[$__rate_interval])", "fullMetaSearch": false, "includeNullMetadata": false, "instant": false, "legendFormat": "Prompt Tokens/Sec", "range": true, "refId": "A", "useBackend": false }, { "datasource": { "type": "prometheus", "uid": "${DS_PROMETHEUS}" }, "disableTextWrap": false, "editorMode": "code", "expr": "sum by(kubernetes_pod_name) (rate(vllm:generation_tokens_total{model_name=\"$model_name\"}[$__rate_interval]))", "fullMetaSearch": false, "hide": false, "includeNullMetadata": false, "instant": false, "legendFormat": "Generation Tokens/Sec ({{kubernetes_pod_name}})", "range": true, "refId": "B", "useBackend": false } ], "title": "Token Throughput", "type": "timeseries" }, { "datasource": { "type": "prometheus", "uid": "prom-cec64713b1aab44d0b49236b6f54cd671" }, "description": "End to end request latency measured in seconds.", "fieldConfig": { "defaults": { "color": { "mode": "palette-classic" }, "custom": { "axisCenteredZero": false, "axisColorMode": "text", "axisLabel": "", "axisPlacement": "auto", "barAlignment": 0, "drawStyle": "line", "fillOpacity": 0, "gradientMode": "none", "hideFrom": { "legend": false, "tooltip": false, "viz": false }, "lineInterpolation": "linear", "lineWidth": 1, "pointSize": 5, "scaleDistribution": { "type": "linear" }, "showPoints": "auto", "spanNulls": false, "stacking": { "group": "A", "mode": "none" }, "thresholdsStyle": { "mode": "off" } }, "mappings": [], "thresholds": { "mode": "absolute", "steps": [ { "color": "green", "value": null }, { "color": "red", "value": 80 } ] }, "unit": "s" }, "overrides": [] }, "gridPos": { "h": 8, "w": 12, "x": 0, "y": 32 }, "id": 9, "options": { "legend": { "calcs": [], "displayMode": "list", "placement": "bottom", "showLegend": true }, "tooltip": { "mode": "single", "sort": "none" } }, "targets": [ { "datasource": { "type": "prometheus", "uid": "prom-cec64713b1aab44d0b49236b6f54cd671" }, "disableTextWrap": false, "editorMode": "builder", "expr": "histogram_quantile(0.99, sum by(le) (rate(vllm:e2e_request_latency_seconds_bucket{model_name=\"$model_name\"}[$__rate_interval])))", "fullMetaSearch": false, "hide": false, "includeNullMetadata": false, "instant": false, "legendFormat": "P99", "range": true, "refId": "A", "useBackend": false }, { "datasource": { "type": "prometheus", "uid": "prom-cec64713b1aab44d0b49236b6f54cd671" }, "disableTextWrap": false, "editorMode": "builder", "expr": "histogram_quantile(0.95, sum by(le) (rate(vllm:e2e_request_latency_seconds_bucket{model_name=\"$model_name\"}[$__rate_interval])))", "fullMetaSearch": false, "hide": false, "includeNullMetadata": false, "instant": false, "legendFormat": "P95", "range": true, "refId": "B", "useBackend": false }, { "datasource": { "type": "prometheus", "uid": "prom-cec64713b1aab44d0b49236b6f54cd671" }, "disableTextWrap": false, "editorMode": "builder", "expr": "histogram_quantile(0.9, sum by(le) (rate(vllm:e2e_request_latency_seconds_bucket{model_name=\"$model_name\"}[$__rate_interval])))", "fullMetaSearch": false, "hide": false, "includeNullMetadata": false, "instant": false, "legendFormat": "P90", "range": true, "refId": "C", "useBackend": false }, { "datasource": { "type": "prometheus", "uid": "prom-cec64713b1aab44d0b49236b6f54cd671" }, "disableTextWrap": false, "editorMode": "builder", "expr": "histogram_quantile(0.5, sum by(le) (rate(vllm:e2e_request_latency_seconds_bucket{model_name=\"$model_name\"}[$__rate_interval])))", "fullMetaSearch": false, "hide": false, "includeNullMetadata": false, "instant": false, "legendFormat": "P50", "range": true, "refId": "D", "useBackend": false }, { "datasource": { "type": "prometheus", "uid": "prom-cec64713b1aab44d0b49236b6f54cd671" }, "editorMode": "code", "expr": "rate(vllm:e2e_request_latency_seconds_sum{model_name=\"$model_name\"}[$__rate_interval])\n/\nrate(vllm:e2e_request_latency_seconds_count{model_name=\"$model_name\"}[$__rate_interval])", "hide": false, "instant": false, "legendFormat": "Average", "range": true, "refId": "E" } ], "title": "E2E Request Latency", "type": "timeseries" }, { "datasource": { "type": "prometheus", "uid": "${DS_PROMETHEUS}" }, "description": "Number of requests in RUNNING, WAITING, and SWAPPED state", "fieldConfig": { "defaults": { "color": { "mode": "palette-classic" }, "custom": { "axisCenteredZero": false, "axisColorMode": "text", "axisLabel": "", "axisPlacement": "auto", "barAlignment": 0, "drawStyle": "line", "fillOpacity": 0, "gradientMode": "none", "hideFrom": { "legend": false, "tooltip": false, "viz": false }, "lineInterpolation": "linear", "lineWidth": 1, "pointSize": 5, "scaleDistribution": { "type": "linear" }, "showPoints": "auto", "spanNulls": false, "stacking": { "group": "A", "mode": "none" }, "thresholdsStyle": { "mode": "off" } }, "mappings": [], "thresholds": { "mode": "absolute", "steps": [ { "color": "green", "value": null }, { "color": "red", "value": 80 } ] }, "unit": "none" }, "overrides": [] }, "gridPos": { "h": 8, "w": 12, "x": 12, "y": 32 }, "id": 3, "options": { "legend": { "calcs": [], "displayMode": "list", "placement": "bottom", "showLegend": true }, "tooltip": { "mode": "single", "sort": "none" } }, "targets": [ { "datasource": { "type": "prometheus", "uid": "${DS_PROMETHEUS}" }, "disableTextWrap": false, "editorMode": "builder", "expr": "vllm:num_requests_running{model_name=\"$model_name\"}", "fullMetaSearch": false, "hide": false, "includeNullMetadata": true, "instant": false, "legendFormat": "Num Running", "range": true, "refId": "A", "useBackend": false }, { "datasource": { "type": "prometheus", "uid": "${DS_PROMETHEUS}" }, "disableTextWrap": false, "editorMode": "builder", "expr": "vllm:num_requests_swapped{model_name=\"$model_name\"}", "fullMetaSearch": false, "hide": false, "includeNullMetadata": true, "instant": false, "legendFormat": "Num Swapped", "range": true, "refId": "B", "useBackend": false }, { "datasource": { "type": "prometheus", "uid": "${DS_PROMETHEUS}" }, "disableTextWrap": false, "editorMode": "builder", "exemplar": false, "expr": "sum by(kubernetes_pod_name) (vllm:num_requests_waiting{model_name=\"$model_name\"})", "fullMetaSearch": false, "hide": false, "includeNullMetadata": true, "instant": false, "legendFormat": "Num Waiting for {{kubernetes_pod_name}}", "range": true, "refId": "C", "useBackend": false } ], "title": "Scheduler State", "type": "timeseries" }, { "datasource": { "type": "prometheus", "uid": "${DS_PROMETHEUS}" }, "description": "Inter token latency in seconds.", "fieldConfig": { "defaults": { "color": { "mode": "palette-classic" }, "custom": { "axisCenteredZero": false, "axisColorMode": "text", "axisLabel": "", "axisPlacement": "auto", "barAlignment": 0, "drawStyle": "line", "fillOpacity": 0, "gradientMode": "none", "hideFrom": { "legend": false, "tooltip": false, "viz": false }, "lineInterpolation": "linear", "lineWidth": 1, "pointSize": 5, "scaleDistribution": { "type": "linear" }, "showPoints": "auto", "spanNulls": false, "stacking": { "group": "A", "mode": "none" }, "thresholdsStyle": { "mode": "off" } }, "mappings": [], "thresholds": { "mode": "absolute", "steps": [ { "color": "green", "value": null }, { "color": "red", "value": 80 } ] }, "unit": "s" }, "overrides": [] }, "gridPos": { "h": 8, "w": 12, "x": 0, "y": 40 }, "id": 10, "options": { "legend": { "calcs": [], "displayMode": "list", "placement": "bottom", "showLegend": true }, "tooltip": { "mode": "single", "sort": "none" } }, "targets": [ { "datasource": { "type": "prometheus", "uid": "${DS_PROMETHEUS}" }, "disableTextWrap": false, "editorMode": "builder", "expr": "histogram_quantile(0.99, sum by(le) (rate(vllm:time_per_output_token_seconds_bucket{model_name=\"$model_name\"}[$__rate_interval])))", "fullMetaSearch": false, "includeNullMetadata": false, "instant": false, "legendFormat": "P99", "range": true, "refId": "A", "useBackend": false }, { "datasource": { "type": "prometheus", "uid": "${DS_PROMETHEUS}" }, "disableTextWrap": false, "editorMode": "builder", "expr": "histogram_quantile(0.95, sum by(le) (rate(vllm:time_per_output_token_seconds_bucket{model_name=\"$model_name\"}[$__rate_interval])))", "fullMetaSearch": false, "hide": false, "includeNullMetadata": false, "instant": false, "legendFormat": "P95", "range": true, "refId": "B", "useBackend": false }, { "datasource": { "type": "prometheus", "uid": "${DS_PROMETHEUS}" }, "disableTextWrap": false, "editorMode": "builder", "expr": "histogram_quantile(0.9, sum by(le) (rate(vllm:time_per_output_token_seconds_bucket{model_name=\"$model_name\"}[$__rate_interval])))", "fullMetaSearch": false, "hide": false, "includeNullMetadata": false, "instant": false, "legendFormat": "P90", "range": true, "refId": "C", "useBackend": false }, { "datasource": { "type": "prometheus", "uid": "${DS_PROMETHEUS}" }, "disableTextWrap": false, "editorMode": "builder", "expr": "histogram_quantile(0.5, sum by(le) (rate(vllm:time_per_output_token_seconds_bucket{model_name=\"$model_name\"}[$__rate_interval])))", "fullMetaSearch": false, "hide": false, "includeNullMetadata": false, "instant": false, "legendFormat": "P50", "range": true, "refId": "D", "useBackend": false }, { "datasource": { "type": "prometheus", "uid": "${DS_PROMETHEUS}" }, "editorMode": "code", "expr": "rate(vllm:time_per_output_token_seconds_sum{model_name=\"$model_name\"}[$__rate_interval])\n/\nrate(vllm:time_per_output_token_seconds_count{model_name=\"$model_name\"}[$__rate_interval])", "hide": false, "instant": false, "legendFormat": "Mean", "range": true, "refId": "E" } ], "title": "Time Per Output Token Latency", "type": "timeseries" }, { "datasource": { "default": false, "type": "prometheus", "uid": "${DS_PROMETHEUS}" }, "fieldConfig": { "defaults": { "color": { "mode": "palette-classic" }, "custom": { "axisCenteredZero": false, "axisColorMode": "text", "axisLabel": "", "axisPlacement": "auto", "barAlignment": 0, "drawStyle": "line", "fillOpacity": 0, "gradientMode": "none", "hideFrom": { "legend": false, "tooltip": false, "viz": false }, "lineInterpolation": "linear", "lineWidth": 1, "pointSize": 5, "scaleDistribution": { "type": "linear" }, "showPoints": "auto", "spanNulls": false, "stacking": { "group": "A", "mode": "none" }, "thresholdsStyle": { "mode": "off" } }, "mappings": [], "thresholds": { "mode": "absolute", "steps": [ { "color": "green", "value": null }, { "color": "red", "value": 80 } ] } }, "overrides": [ { "__systemRef": "hideSeriesFrom", "matcher": { "id": "byNames", "options": { "mode": "exclude", "names": [ "Decode" ], "prefix": "All except:", "readOnly": true } }, "properties": [ { "id": "custom.hideFrom", "value": { "legend": false, "tooltip": false, "viz": true } } ] } ] }, "gridPos": { "h": 8, "w": 12, "x": 12, "y": 40 }, "id": 15, "options": { "legend": { "calcs": [], "displayMode": "list", "placement": "bottom", "showLegend": true }, "tooltip": { "mode": "single", "sort": "none" } }, "targets": [ { "datasource": { "type": "prometheus", "uid": "edx8memhpd9tsa" }, "disableTextWrap": false, "editorMode": "code", "expr": "rate(vllm:request_prefill_time_seconds_sum{model_name=\"$model_name\"}[$__rate_interval])", "fullMetaSearch": false, "includeNullMetadata": true, "instant": false, "legendFormat": "Prefill", "range": true, "refId": "A", "useBackend": false }, { "datasource": { "type": "prometheus", "uid": "${DS_PROMETHEUS}" }, "editorMode": "code", "expr": "rate(vllm:request_decode_time_seconds_sum{model_name=\"$model_name\"}[$__rate_interval])", "hide": false, "instant": false, "legendFormat": "Decode", "range": true, "refId": "B" } ], "title": "Requests Prefill and Decode Time", "type": "timeseries" }, { "datasource": { "type": "prometheus", "uid": "${DS_PROMETHEUS}" }, "description": "Heatmap of request prompt length", "fieldConfig": { "defaults": { "custom": { "hideFrom": { "legend": false, "tooltip": false, "viz": false }, "scaleDistribution": { "type": "linear" } } }, "overrides": [] }, "gridPos": { "h": 8, "w": 12, "x": 0, "y": 48 }, "id": 12, "options": { "calculate": false, "cellGap": 1, "cellValues": { "unit": "none" }, "color": { "exponent": 0.5, "fill": "dark-orange", "min": 0, "mode": "scheme", "reverse": false, "scale": "exponential", "scheme": "Spectral", "steps": 64 }, "exemplars": { "color": "rgba(255,0,255,0.7)" }, "filterValues": { "le": 1e-9 }, "legend": { "show": true }, "rowsFrame": { "layout": "auto", "value": "Request count" }, "tooltip": { "mode": "single", "show": true, "showColorScale": false, "yHistogram": true }, "yAxis": { "axisLabel": "Prompt Length", "axisPlacement": "left", "reverse": false, "unit": "none" } }, "pluginVersion": "10.0.9", "targets": [ { "datasource": { "type": "prometheus", "uid": "${DS_PROMETHEUS}" }, "disableTextWrap": false, "editorMode": "builder", "expr": "sum by(le) (increase(vllm:request_prompt_tokens_bucket{model_name=\"$model_name\"}[$__rate_interval]))", "format": "heatmap", "fullMetaSearch": false, "includeNullMetadata": true, "instant": false, "legendFormat": "{{le}}", "range": true, "refId": "A", "useBackend": false } ], "title": "Request Prompt Length", "type": "heatmap" }, { "datasource": { "type": "prometheus", "uid": "${DS_PROMETHEUS}" }, "description": "Heatmap of request generation length", "fieldConfig": { "defaults": { "custom": { "hideFrom": { "legend": false, "tooltip": false, "viz": false }, "scaleDistribution": { "type": "linear" } } }, "overrides": [] }, "gridPos": { "h": 8, "w": 12, "x": 12, "y": 48 }, "id": 13, "options": { "calculate": false, "cellGap": 1, "cellValues": { "unit": "none" }, "color": { "exponent": 0.5, "fill": "dark-orange", "min": 0, "mode": "scheme", "reverse": false, "scale": "exponential", "scheme": "Spectral", "steps": 64 }, "exemplars": { "color": "rgba(255,0,255,0.7)" }, "filterValues": { "le": 1e-9 }, "legend": { "show": true }, "rowsFrame": { "layout": "auto", "value": "Request count" }, "tooltip": { "mode": "single", "show": true, "showColorScale": false, "yHistogram": true }, "yAxis": { "axisLabel": "Generation Length", "axisPlacement": "left", "reverse": false, "unit": "none" } }, "pluginVersion": "10.0.9", "targets": [ { "datasource": { "type": "prometheus", "uid": "${DS_PROMETHEUS}" }, "disableTextWrap": false, "editorMode": "builder", "expr": "sum by(le) (increase(vllm:request_generation_tokens_bucket{model_name=\"$model_name\"}[$__rate_interval]))", "format": "heatmap", "fullMetaSearch": false, "includeNullMetadata": true, "instant": false, "legendFormat": "{{le}}", "range": true, "refId": "A", "useBackend": false } ], "title": "Request Generation Length", "type": "heatmap" }, { "datasource": { "type": "prometheus", "uid": "${DS_PROMETHEUS}" }, "description": "Number of finished requests by their finish reason: either an EOS token was generated or the max sequence length was reached.", "fieldConfig": { "defaults": { "color": { "mode": "palette-classic" }, "custom": { "axisCenteredZero": false, "axisColorMode": "text", "axisLabel": "", "axisPlacement": "auto", "barAlignment": 0, "drawStyle": "line", "fillOpacity": 0, "gradientMode": "none", "hideFrom": { "legend": false, "tooltip": false, "viz": false }, "lineInterpolation": "linear", "lineWidth": 1, "pointSize": 5, "scaleDistribution": { "type": "linear" }, "showPoints": "auto", "spanNulls": false, "stacking": { "group": "A", "mode": "none" }, "thresholdsStyle": { "mode": "off" } }, "mappings": [], "thresholds": { "mode": "absolute", "steps": [ { "color": "green", "value": null }, { "color": "red", "value": 80 } ] } }, "overrides": [] }, "gridPos": { "h": 8, "w": 12, "x": 0, "y": 56 }, "id": 11, "options": { "legend": { "calcs": [], "displayMode": "list", "placement": "bottom", "showLegend": true }, "tooltip": { "mode": "single", "sort": "none" } }, "targets": [ { "datasource": { "type": "prometheus", "uid": "${DS_PROMETHEUS}" }, "disableTextWrap": false, "editorMode": "builder", "expr": "sum by(finished_reason) (increase(vllm:request_success_total{model_name=\"$model_name\"}[$__rate_interval]))", "fullMetaSearch": false, "includeNullMetadata": true, "instant": false, "interval": "", "legendFormat": "__auto", "range": true, "refId": "A", "useBackend": false } ], "title": "Finish Reason", "type": "timeseries" }, { "datasource": { "default": false, "type": "prometheus", "uid": "${DS_PROMETHEUS}" }, "fieldConfig": { "defaults": { "color": { "mode": "palette-classic" }, "custom": { "axisCenteredZero": false, "axisColorMode": "text", "axisLabel": "", "axisPlacement": "auto", "barAlignment": 0, "drawStyle": "line", "fillOpacity": 0, "gradientMode": "none", "hideFrom": { "legend": false, "tooltip": false, "viz": false }, "lineInterpolation": "linear", "lineWidth": 1, "pointSize": 5, "scaleDistribution": { "type": "linear" }, "showPoints": "auto", "spanNulls": false, "stacking": { "group": "A", "mode": "none" }, "thresholdsStyle": { "mode": "off" } }, "mappings": [], "thresholds": { "mode": "absolute", "steps": [ { "color": "green", "value": null }, { "color": "red", "value": 80 } ] } }, "overrides": [ { "__systemRef": "hideSeriesFrom", "matcher": { "id": "byNames", "options": { "mode": "exclude", "names": [ "Tokens" ], "prefix": "All except:", "readOnly": true } }, "properties": [ { "id": "custom.hideFrom", "value": { "legend": false, "tooltip": false, "viz": true } } ] } ] }, "gridPos": { "h": 8, "w": 12, "x": 12, "y": 56 }, "id": 16, "options": { "legend": { "calcs": [], "displayMode": "list", "placement": "bottom", "showLegend": true }, "tooltip": { "mode": "single", "sort": "none" } }, "targets": [ { "datasource": { "type": "prometheus", "uid": "edx8memhpd9tsa" }, "disableTextWrap": false, "editorMode": "code", "expr": "rate(vllm:request_max_num_generation_tokens_sum{model_name=\"$model_name\"}[$__rate_interval])", "fullMetaSearch": false, "includeNullMetadata": true, "instant": false, "legendFormat": "Tokens", "range": true, "refId": "A", "useBackend": false } ], "title": "Max Generation Token in Sequence Group", "type": "timeseries" } ], "refresh": false, "schemaVersion": 38, "style": "dark", "tags": [], "templating": { "list": [ { "current": { "selected": true, "text": "prom-cec64713b1aab44d0b49236b6f54cd671", "value": "prom-cec64713b1aab44d0b49236b6f54cd671" }, "hide": 0, "includeAll": false, "label": "datasource", "multi": false, "name": "DS_PROMETHEUS", "options": [], "query": "prometheus", "queryValue": "", "refresh": 1, "regex": "", "skipUrlSync": false, "type": "datasource" }, { "current": { "selected": false, "text": "/model/llama2", "value": "/model/llama2" }, "datasource": { "type": "prometheus", "uid": "prom-cec64713b1aab44d0b49236b6f54cd671" }, "definition": "label_values(model_name)", "hide": 0, "includeAll": false, "label": "model_name", "multi": false, "name": "model_name", "options": [], "query": { "query": "label_values(model_name)", "refId": "StandardVariableQuery" }, "refresh": 1, "regex": "", "skipUrlSync": false, "sort": 0, "type": "query" } ] }, "time": { "from": "2025-01-10T04:00:36.511Z", "to": "2025-01-10T04:18:26.639Z" }, "timepicker": {}, "timezone": "", "title": "vLLM", "uid": "b281712d-8bff-41ef-9f3f-71ad43c05e9c", "version": 10, "weekStart": "" }大盘效果如下: